| Param | Original file | Final file |
|---|---|---|
| Filename | modeM0/AS1A06_003T02_9000002926_19655cztM0_level2.evt | modeM0/AS1A06_003T02_9000002926_19655cztM0_level2_quad_clean.evt |
| Size (bytes) | 170,850,240 | 32,385,600 |
| Size | 162.9 MB | 30.9 MB |
| Events in quadrant A | 1,090,185 | 208,264 |
| Events in quadrant B | 1,199,164 | 215,726 |
| Events in quadrant C | 1,118,141 | 200,524 |
| Events in quadrant D | 1,609,592 | 191,361 |
| Mode SS | |||
|---|---|---|---|
| Quadrant | BADHDUFLAG | Total packets | Discarded packets |
| A | 0 | 46 | 0 |
| B | 0 | 46 | 0 |
| C | 0 | 46 | 0 |
| D | 0 | 46 | 0 |
| Mode M9 | |||
|---|---|---|---|
| Quadrant | BADHDUFLAG | Total packets | Discarded packets |
| A | 0 | 10 | 0 |
| B | 0 | 11 | 0 |
| C | 0 | 11 | 0 |
| D | 0 | 11 | 0 |
| Mode M0 | |||
|---|---|---|---|
| Quadrant | BADHDUFLAG | Total packets | Discarded packets |
| A | 0 | 4715 | 1 |
| B | 0 | 5014 | 1 |
| C | 0 | 4759 | 1 |
| D | 0 | 6272 | 1 |
| Quadrant | Total seconds | Saturated seconds | Saturation percentage |
|---|---|---|---|
| A | 2277 | 1 | 0.043917% |
| B | 2277 | 3 | 0.131752% |
| C | 2277 | 7 | 0.307422% |
| D | 2277 | 133 | 5.841019% |
Noise dominated data is calculated using 1-second bins in cleaned event files. If a bin has >2000 counts, and if more than 50% of those come from <1% of pixels, then it is considered to be noise-dominated and hence unusable.
| Quadrant | # 1 sec bins | Bins with >0 counts | Bins with >2000 counts | High rate bins dominated by noise | Noise dominated (total time) | Noise dominated (detector-on time) | Marked lightcurve |
|---|---|---|---|---|---|---|---|
| A | 2277 | 2277 | 0 | 0 | 0.00% | 0.00% | 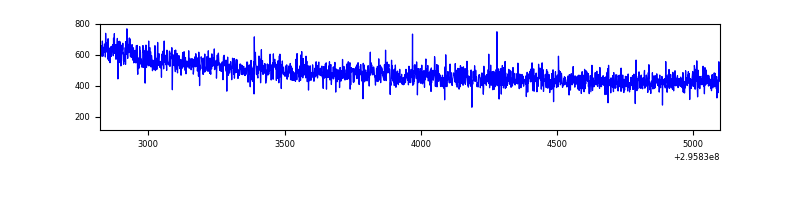 |
| B | 2277 | 2277 | 0 | 0 | 0.00% | 0.00% | 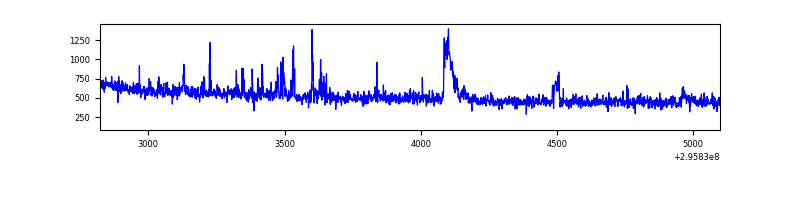 |
| C | 2277 | 2277 | 0 | 0 | 0.00% | 0.00% | 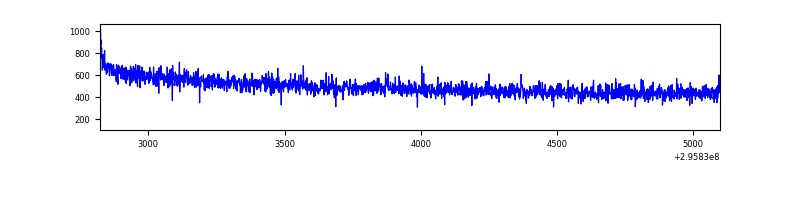 |
| D | 2277 | 2277 | 148 | 148 | 6.50% | 6.50% | 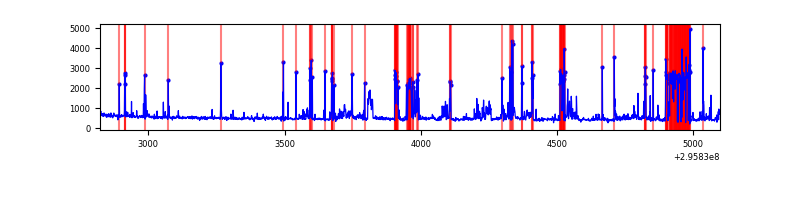 |
Top three noisy pixels from each quadrant. If the there are fewer than three noisy pixels in the level2.evt file, extra rows are filled as -1
| Pixel properties | Quadrant properties | ||||||
|---|---|---|---|---|---|---|---|
| Quadrant | DetID | PixID | Counts | Sigma | Mean | Median | Sigma |
| A | 11 | 29 | 4680 | 76.37 | 282 | 277 | 57.7 |
| A | 13 | 254 | 2886 | 45.25 | 282 | 277 | 57.7 |
| A | 0 | 226 | 2423 | 37.22 | 282 | 277 | 57.7 |
| B | 12 | 0 | 38931 | 694.37 | 287 | 281 | 55.7 |
| B | 4 | 80 | 18050 | 319.23 | 287 | 281 | 55.7 |
| B | 3 | 112 | 6595 | 113.43 | 287 | 281 | 55.7 |
| C | 14 | 238 | 43445 | 664.92 | 272 | 274 | 64.9 |
| C | 3 | 233 | 12519 | 188.6 | 272 | 274 | 64.9 |
| C | 13 | 61 | 1947 | 25.77 | 272 | 274 | 64.9 |
| D | 1 | 52 | 540355 | 8342.29 | 260 | 253 | 64.7 |
| D | 2 | 16 | 39815 | 611.07 | 260 | 253 | 64.7 |
| D | 12 | 218 | 33201 | 508.91 | 260 | 253 | 64.7 |
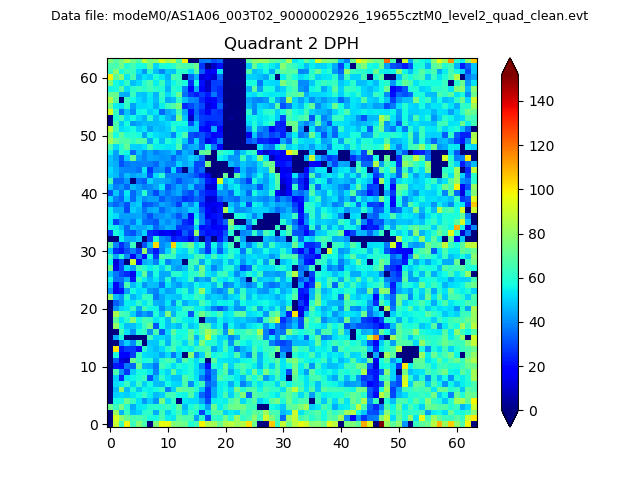
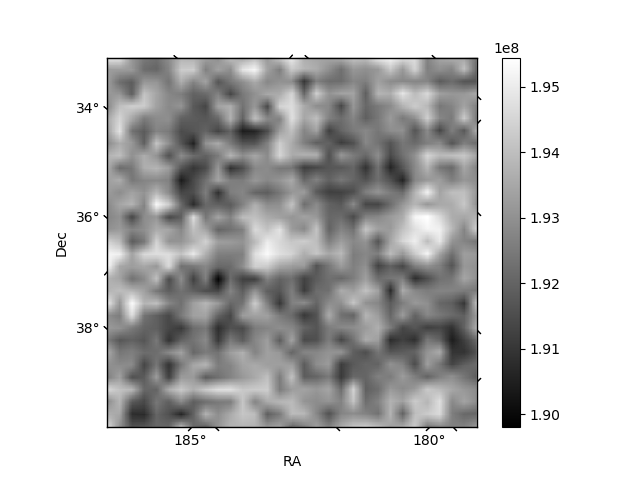
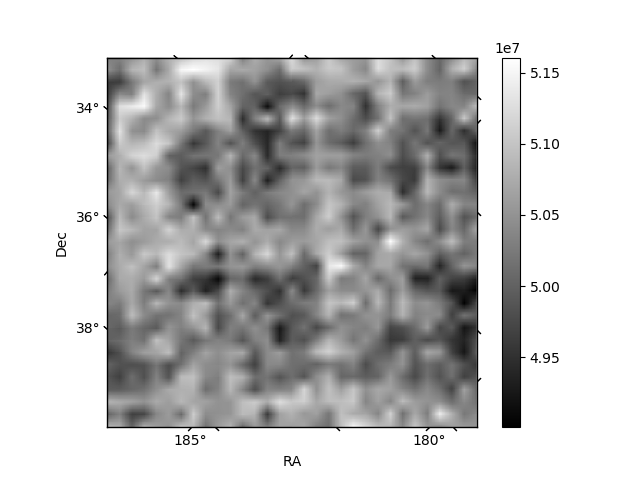
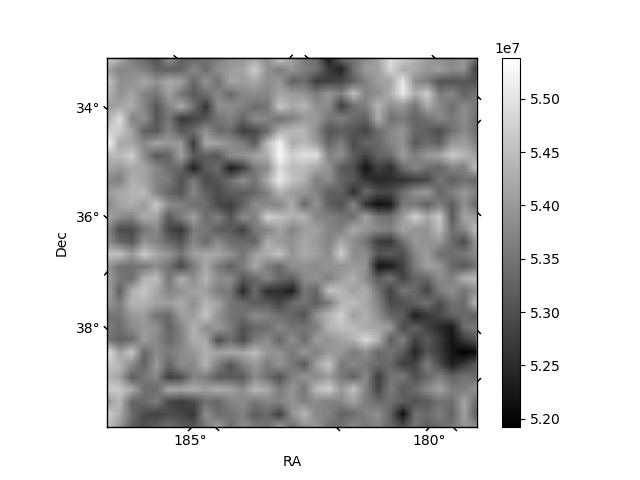
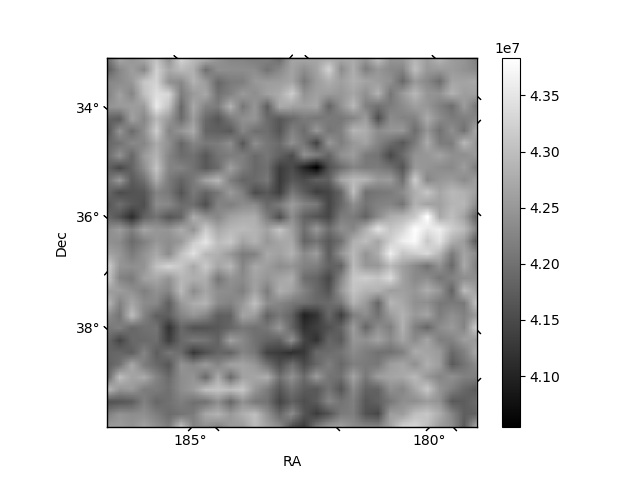
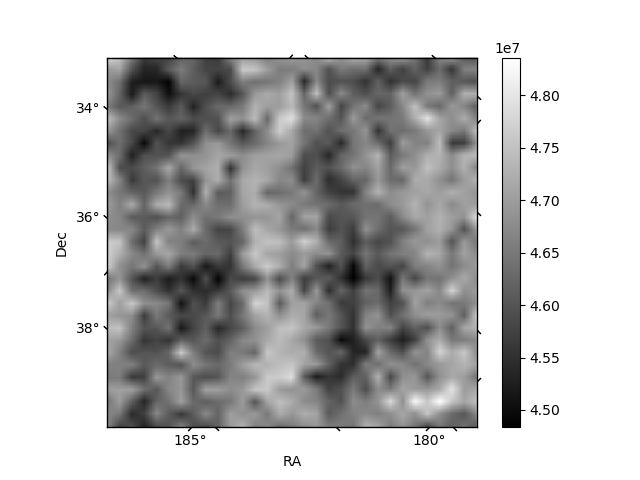
Histogram calculated using DETX and DETY for each event in the final _common_clean file
| Quadrant A | 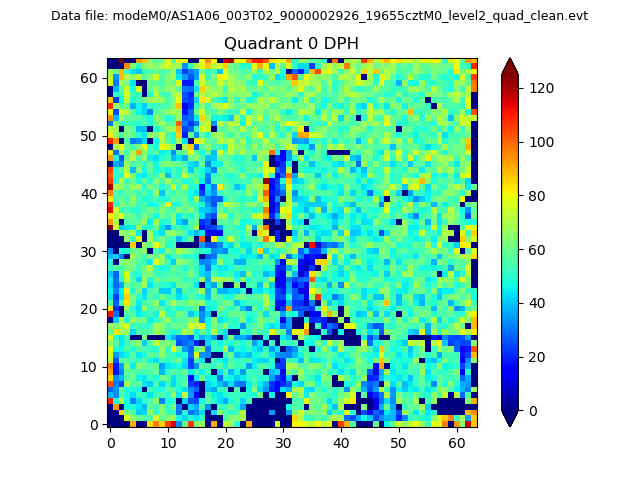 |
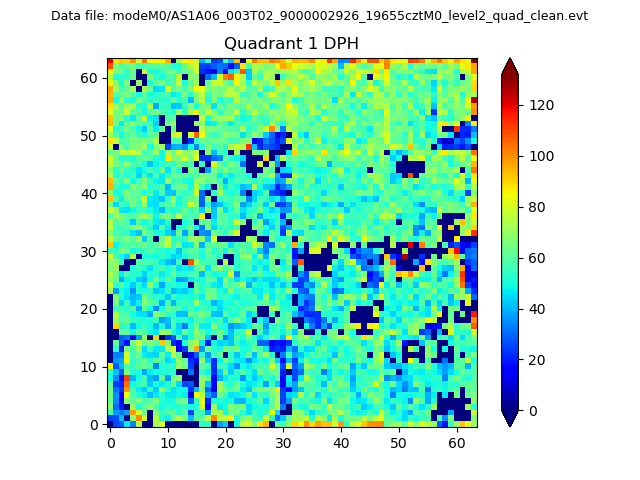 |
Quadrant B |
|---|---|---|---|
| Quadrant D | 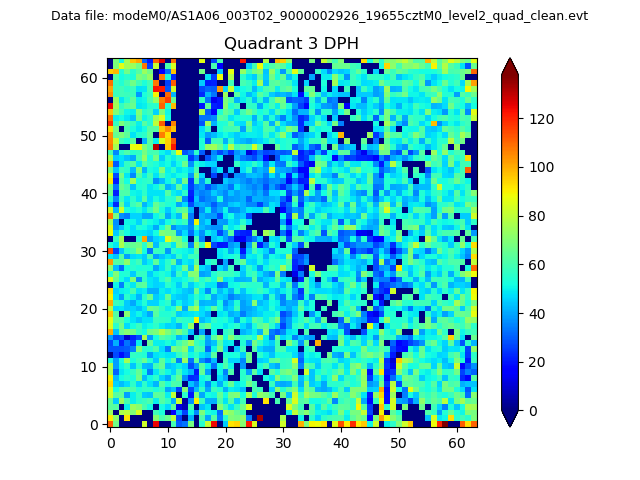 |
 |
Quadrant C |
| Plot type | Count rate plots | Images |
|---|---|---|
| Comparison with Poisson distribution Blue bars denote a histogram of data divided into 1 sec bins. Red curve is a Poisson curve with rate = median count rate of data. |
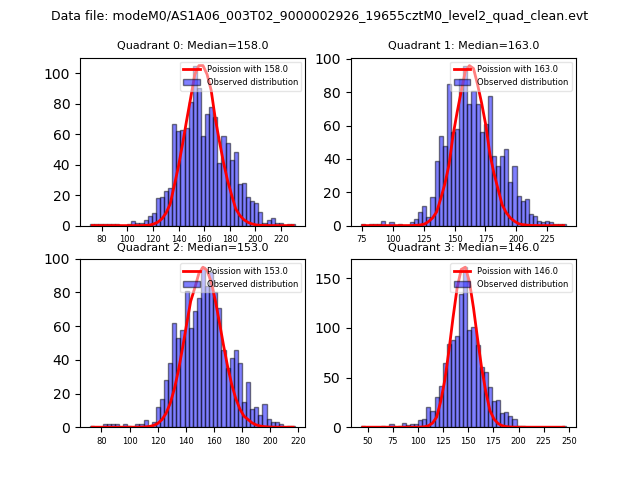 |
 |
| Quadrant-wise count rates Data is divided into 100 sec bins |
 |
|
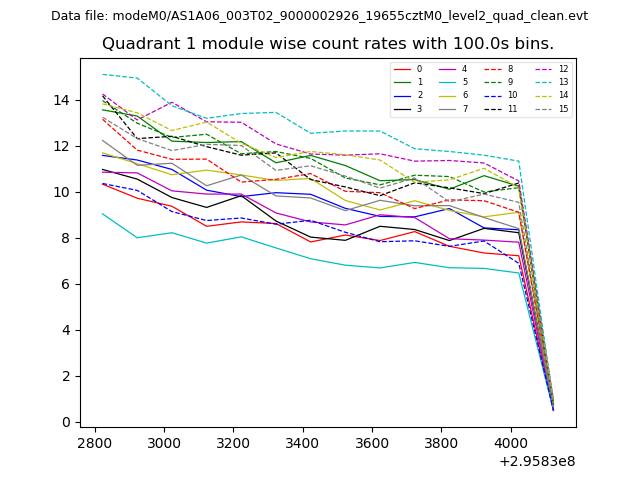
| Module-wise count rates for Quadrant A Data is divided into 100 sec bins |
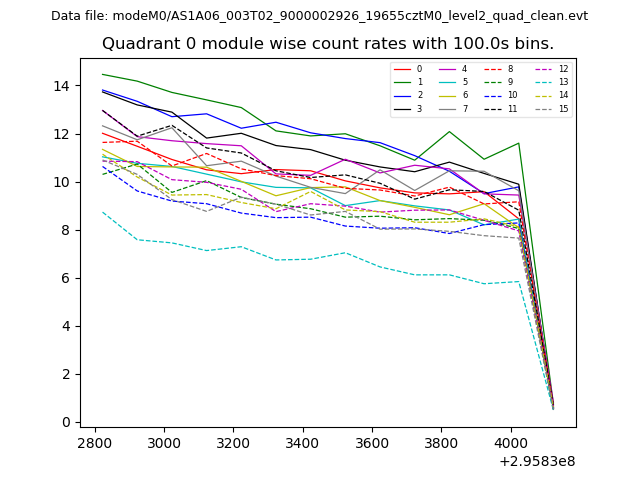 |
 |
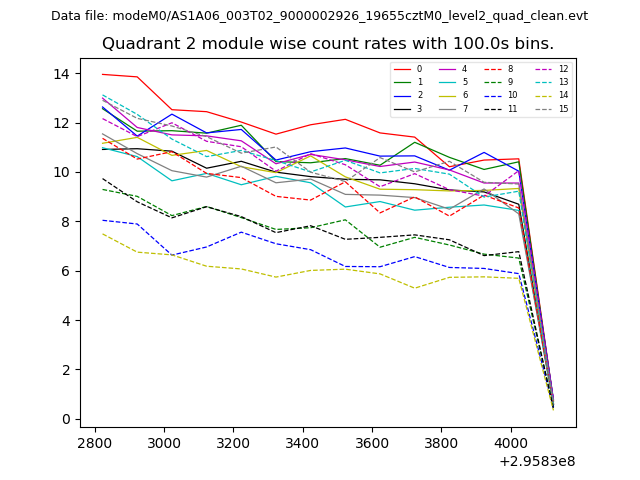
| Module-wise count rates for Quadrant B Data is divided into 100 sec bins |
 |
 |
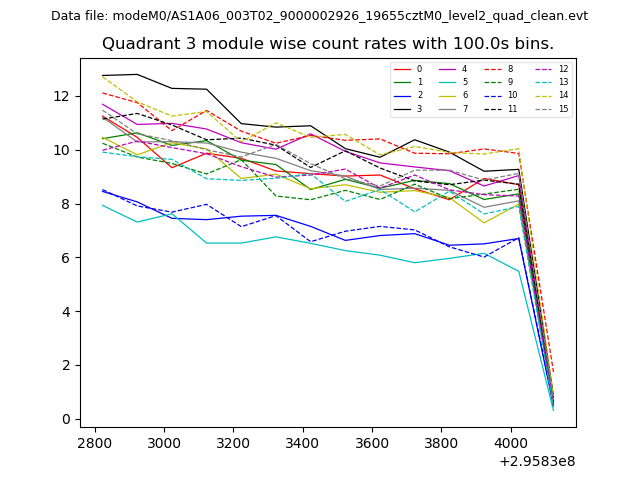
| Module-wise count rates for Quadrant C Data is divided into 100 sec bins |
 |
 |
| Module-wise count rates for Quadrant D Data is divided into 100 sec bins |
 |
 |
| Parameter | Plot |
|---|---|
| CZT HV Monitor | 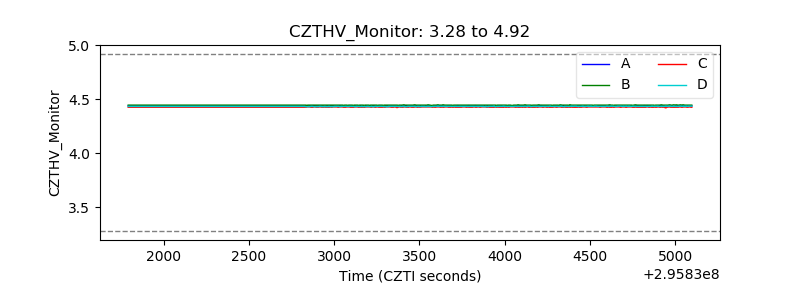 |
| D_VDD | 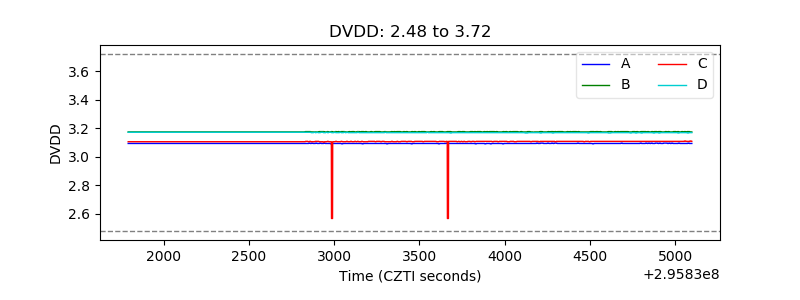 |
| Temperature 1 | 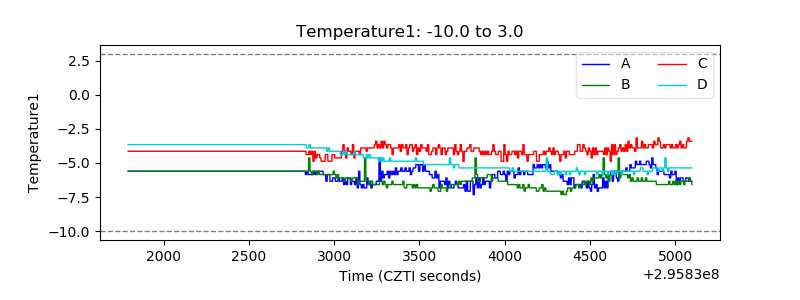 |
| Veto HV Monitor | 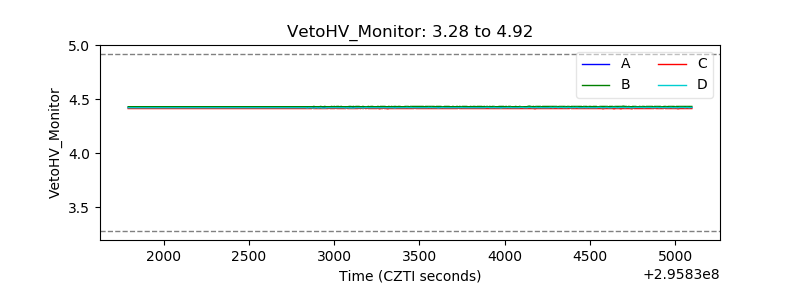 |
| Veto LLD |  |
| Alpha Counter | 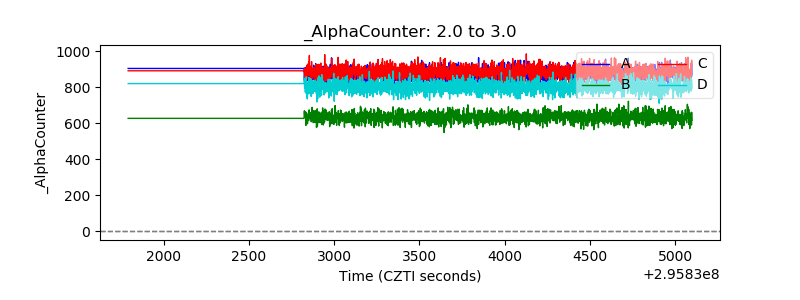 |
| _CPM_Rate | 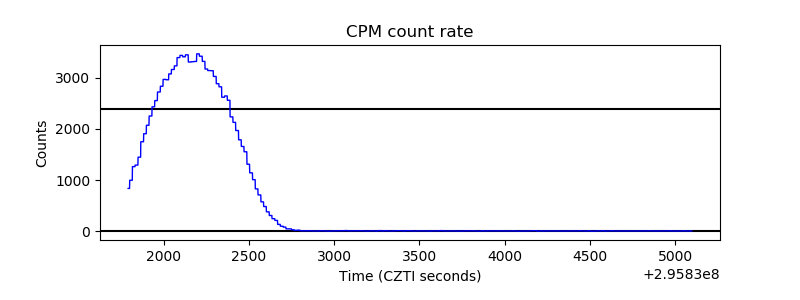 |
| CZT Counter | 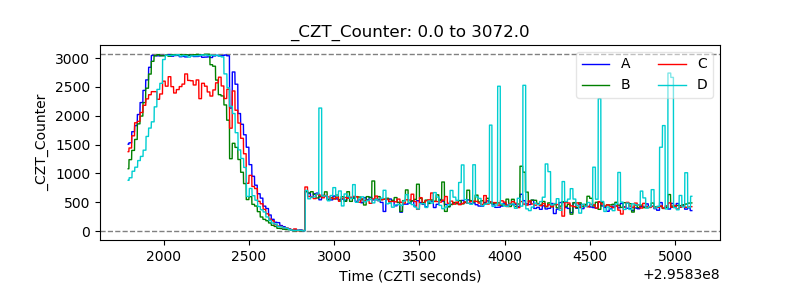 |
| +2.5 Volts monitor |  |
| +5 Volts monitor |  |
| _ROLL_ROT | 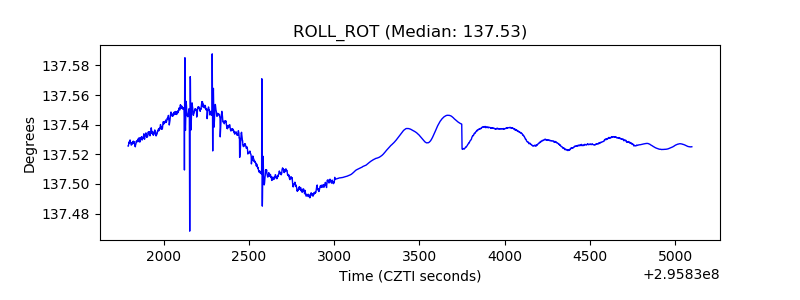 |
| _Roll_DEC | 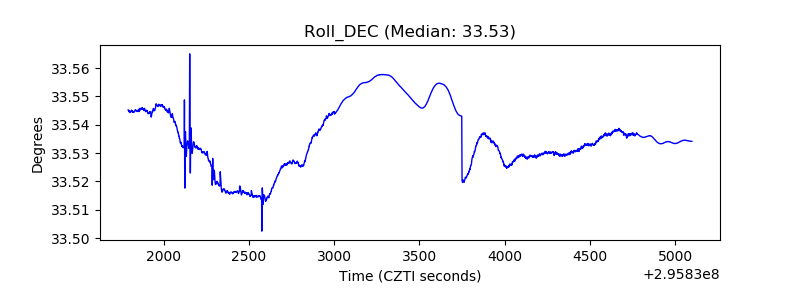 |
| _Roll_RA | 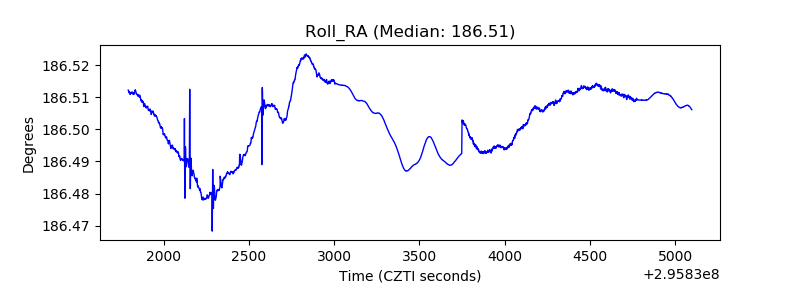 |
| Veto Counter | 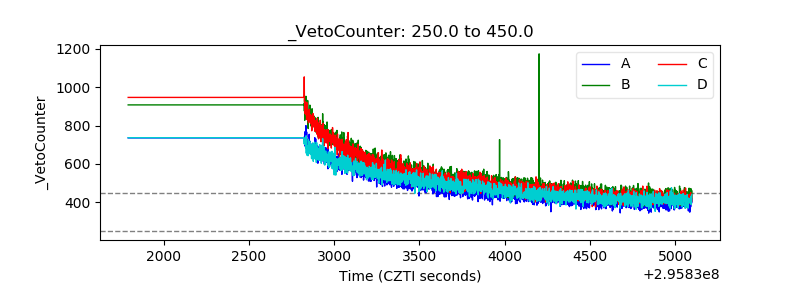 |