| Param | Original file | Final file |
|---|---|---|
| Filename | modeM0/AS1T03_005T01_9000002928cztM0_level2.fits | modeM0/AS1T03_005T01_9000002928cztM0_level2_quad_clean.evt |
| Size (bytes) | 726,359,040 | 623,131,200 |
| Size | 692.7 MB | 594.3 MB |
| Events in quadrant A | 4,486,708 | 3,618,943 |
| Events in quadrant B | 4,320,830 | 3,623,922 |
| Events in quadrant C | 4,328,370 | 3,401,505 |
| Events in quadrant D | 3,780,896 | 3,145,182 |
| Mode SS | |||
|---|---|---|---|
| Quadrant | BADHDUFLAG | Total packets | Discarded packets |
| A | 0 | 1510 | 0 |
| B | 0 | 1510 | 0 |
| C | 0 | 1510 | 0 |
| D | 0 | 1510 | 0 |
| Mode M9 | |||
|---|---|---|---|
| Quadrant | BADHDUFLAG | Total packets | Discarded packets |
| A | 0 | 120 | 0 |
| B | 0 | 120 | 0 |
| C | 0 | 120 | 0 |
| D | 0 | 120 | 0 |
| Mode M0 | |||
|---|---|---|---|
| Quadrant | BADHDUFLAG | Total packets | Discarded packets |
| A | 0 | 153758 | 0 |
| B | 0 | 157059 | 0 |
| C | 0 | 154381 | 0 |
| D | 0 | 173071 | 0 |
| Quadrant | Total seconds | Saturated seconds | Saturation percentage |
|---|---|---|---|
| A | 74097 | 1081 | 1.458898% |
| B | 74097 | 1385 | 1.869171% |
| C | 74097 | 1334 | 1.800343% |
| D | 74097 | 1444 | 1.948797% |
Noise dominated data is calculated using 1-second bins in cleaned event files. If a bin has >2000 counts, and if more than 50% of those come from <1% of pixels, then it is considered to be noise-dominated and hence unusable.
| Quadrant | # 1 sec bins | Bins with >0 counts | Bins with >2000 counts | High rate bins dominated by noise | Noise dominated (total time) | Noise dominated (detector-on time) | Marked lightcurve |
|---|---|---|---|---|---|---|---|
| A | 86122 | 74086 | 0 | 0 | 0.00% | 0.00% |  |
| B | 86122 | 74087 | 0 | 0 | 0.00% | 0.00% |  |
| C | 86122 | 74087 | 0 | 0 | 0.00% | 0.00% |  |
| D | 86122 | 74043 | 0 | 0 | 0.00% | 0.00% |  |
Top three noisy pixels from each quadrant. If the there are fewer than three noisy pixels in the level2.evt file, extra rows are filled as -1
| Pixel properties | Quadrant properties | ||||||
|---|---|---|---|---|---|---|---|
| Quadrant | DetID | PixID | Counts | Sigma | Mean | Median | Sigma |
| A | 0 | 29 | 4316 | 11.18 | 1167 | 1096 | 288.0 |
| A | 7 | 110 | 3507 | 8.37 | 1167 | 1096 | 288.0 |
| A | 9 | 19 | 3440 | 8.14 | 1167 | 1096 | 288.0 |
| B | 2 | 9 | 3494 | 10.79 | 1140 | 1086 | 223.1 |
| B | 2 | 8 | 2919 | 8.21 | 1140 | 1086 | 223.1 |
| B | 5 | 232 | 2831 | 7.82 | 1140 | 1086 | 223.1 |
| C | 1 | 81 | 3233 | 7.36 | 1142 | 1063 | 295.0 |
| C | 1 | 80 | 3182 | 7.18 | 1142 | 1063 | 295.0 |
| C | 12 | 241 | 3075 | 6.82 | 1142 | 1063 | 295.0 |
| D | 3 | 14 | 2742 | 6.11 | 1079 | 980 | 288.5 |
| D | 10 | 189 | 2686 | 5.91 | 1079 | 980 | 288.5 |
| D | 6 | 67 | 2641 | 5.76 | 1079 | 980 | 288.5 |
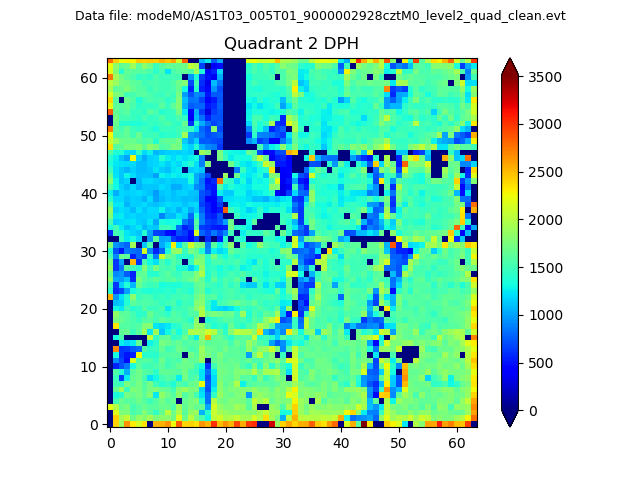
Histogram calculated using DETX and DETY for each event in the final _common_clean file
| Quadrant A |  |
 |
Quadrant B |
|---|---|---|---|
| Quadrant D | 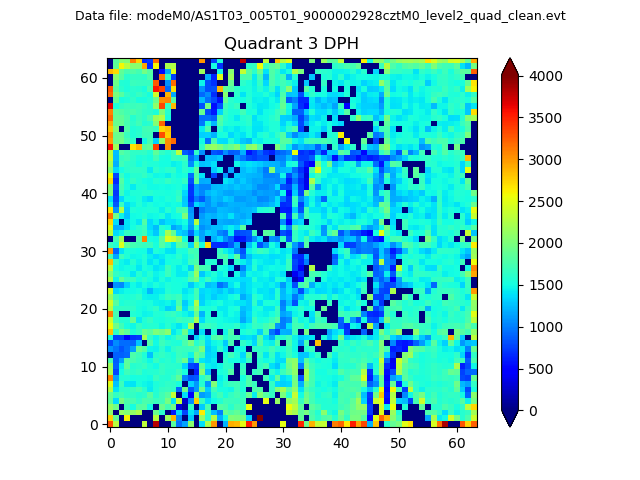 |
 |
Quadrant C |
| Plot type | Count rate plots | Images |
|---|---|---|
| Comparison with Poisson distribution Blue bars denote a histogram of data divided into 1 sec bins. Red curve is a Poisson curve with rate = median count rate of data. |
 |
 |
| Quadrant-wise count rates Data is divided into 100 sec bins |
 |
|
| Module-wise count rates for Quadrant A Data is divided into 100 sec bins |
 |
 |
| Module-wise count rates for Quadrant B Data is divided into 100 sec bins |
 |
 |
| Module-wise count rates for Quadrant C Data is divided into 100 sec bins |
 |
 |
| Module-wise count rates for Quadrant D Data is divided into 100 sec bins |
 |
 |
| Parameter | Plot |
|---|---|
| CZT HV Monitor |  |
| D_VDD |  |
| Temperature 1 |  |
| Veto HV Monitor |  |
| Veto LLD |  |
| Alpha Counter |  |
| _CPM_Rate |  |
| CZT Counter |  |
| +2.5 Volts monitor |  |
| +5 Volts monitor |  |
| _ROLL_ROT |  |
| _Roll_DEC |  |
| _Roll_RA |  |
| Veto Counter |  |