| Param | Original file | Final file |
|---|---|---|
| Filename | modeM0/AS1T03_005T01_9000002928_19655cztM0_level2.evt | modeM0/AS1T03_005T01_9000002928_19655cztM0_level2_quad_clean.evt |
| Size (bytes) | 267,920,640 | 55,100,160 |
| Size | 255.5 MB | 52.5 MB |
| Events in quadrant A | 1,849,845 | 363,538 |
| Events in quadrant B | 2,010,225 | 372,735 |
| Events in quadrant C | 1,866,441 | 347,598 |
| Events in quadrant D | 2,144,777 | 333,037 |
| Mode SS | |||
|---|---|---|---|
| Quadrant | BADHDUFLAG | Total packets | Discarded packets |
| A | 0 | 72 | 0 |
| B | 0 | 72 | 0 |
| C | 0 | 72 | 0 |
| D | 0 | 72 | 0 |
| Mode M9 | |||
|---|---|---|---|
| Quadrant | BADHDUFLAG | Total packets | Discarded packets |
| A | 0 | 13 | 0 |
| B | 0 | 13 | 0 |
| C | 0 | 13 | 0 |
| D | 0 | 13 | 0 |
| Mode M0 | |||
|---|---|---|---|
| Quadrant | BADHDUFLAG | Total packets | Discarded packets |
| A | 0 | 7498 | 1 |
| B | 0 | 8092 | 2 |
| C | 0 | 7565 | 1 |
| D | 0 | 8519 | 1 |
| Quadrant | Total seconds | Saturated seconds | Saturation percentage |
|---|---|---|---|
| A | 3555 | 23 | 0.646976% |
| B | 3554 | 50 | 1.406866% |
| C | 3554 | 47 | 1.322454% |
| D | 3554 | 128 | 3.601576% |
Noise dominated data is calculated using 1-second bins in cleaned event files. If a bin has >2000 counts, and if more than 50% of those come from <1% of pixels, then it is considered to be noise-dominated and hence unusable.
| Quadrant | # 1 sec bins | Bins with >0 counts | Bins with >2000 counts | High rate bins dominated by noise | Noise dominated (total time) | Noise dominated (detector-on time) | Marked lightcurve |
|---|---|---|---|---|---|---|---|
| A | 4865 | 3555 | 0 | 0 | 0.00% | 0.00% | 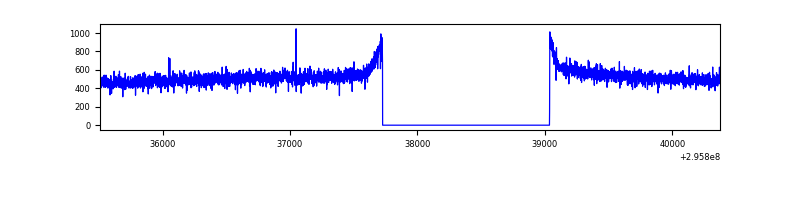 |
| B | 4864 | 3555 | 8 | 8 | 0.16% | 0.23% | 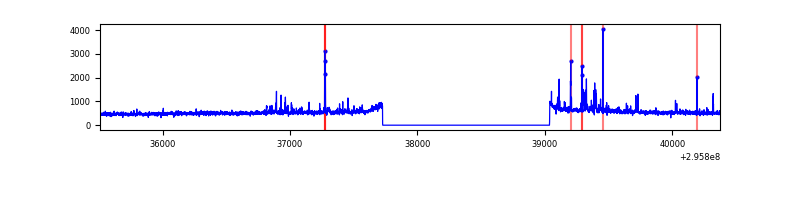 |
| C | 4864 | 3554 | 0 | 0 | 0.00% | 0.00% | 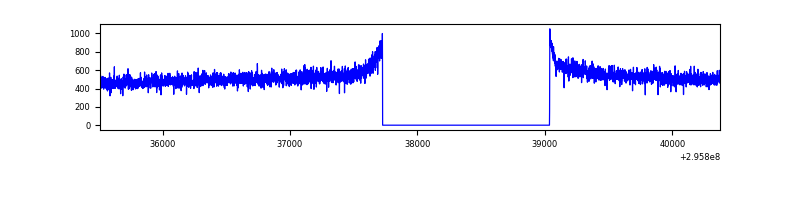 |
| D | 4864 | 3555 | 108 | 108 | 2.22% | 3.04% | 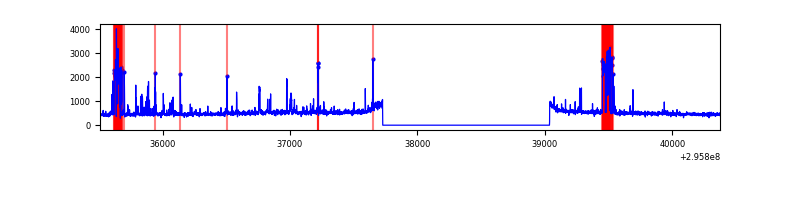 |
Top three noisy pixels from each quadrant. If the there are fewer than three noisy pixels in the level2.evt file, extra rows are filled as -1
| Pixel properties | Quadrant properties | ||||||
|---|---|---|---|---|---|---|---|
| Quadrant | DetID | PixID | Counts | Sigma | Mean | Median | Sigma |
| A | 11 | 29 | 5845 | 55.03 | 478 | 468 | 97.7 |
| A | 13 | 254 | 4271 | 38.92 | 478 | 468 | 97.7 |
| A | 0 | 226 | 4228 | 38.48 | 478 | 468 | 97.7 |
| B | 3 | 112 | 92355 | 1014.58 | 478 | 467 | 90.6 |
| B | 0 | 198 | 17179 | 184.53 | 478 | 467 | 90.6 |
| B | 12 | 111 | 10673 | 112.69 | 478 | 467 | 90.6 |
| C | 14 | 238 | 72842 | 675.01 | 455 | 458 | 107.2 |
| C | 3 | 233 | 14690 | 132.72 | 455 | 458 | 107.2 |
| C | 13 | 61 | 3253 | 26.06 | 455 | 458 | 107.2 |
| D | 1 | 52 | 387150 | 3558.5 | 450 | 438 | 108.7 |
| D | 10 | 199 | 31048 | 281.67 | 450 | 438 | 108.7 |
| D | 2 | 16 | 15192 | 135.77 | 450 | 438 | 108.7 |
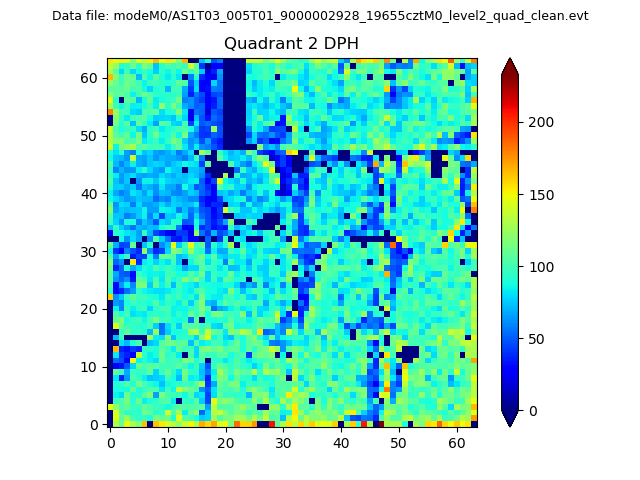
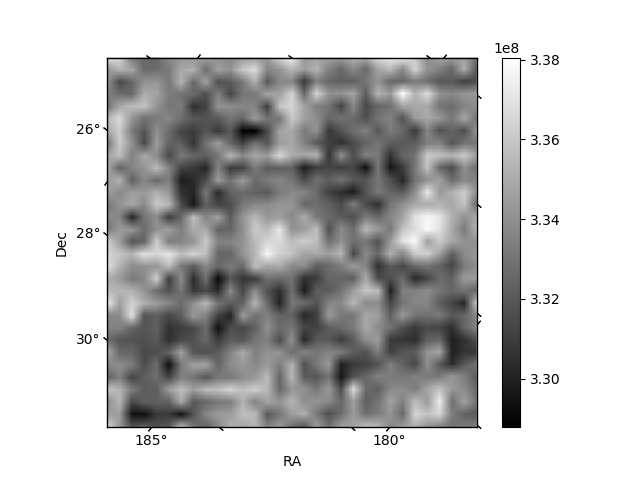
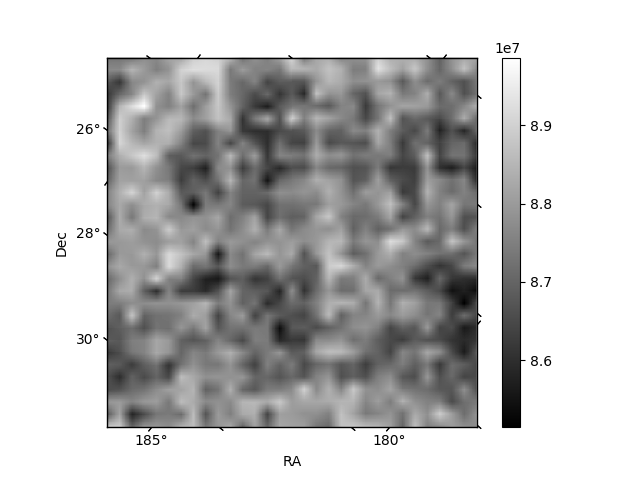
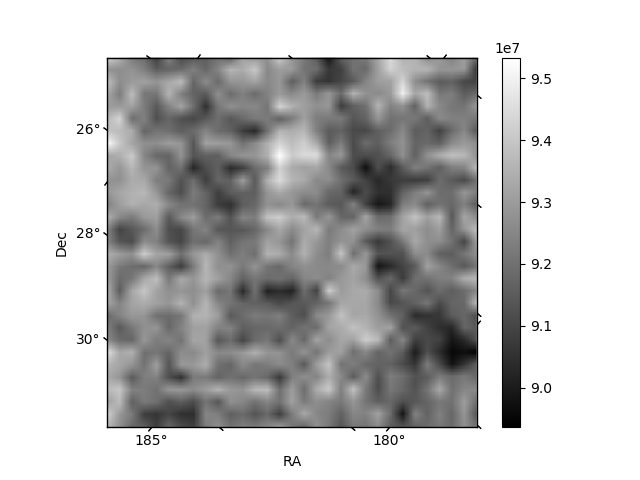
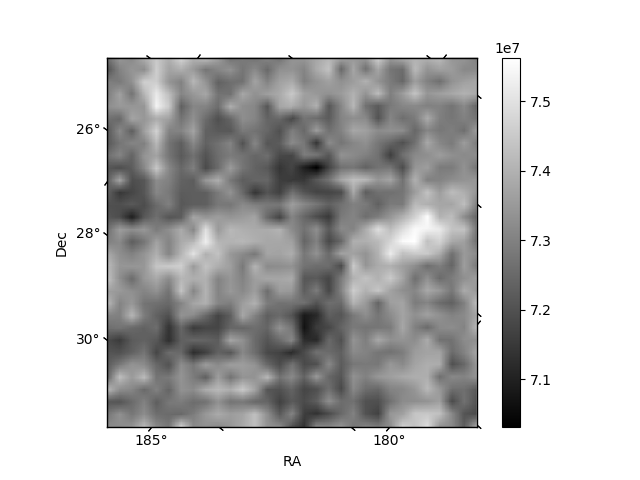
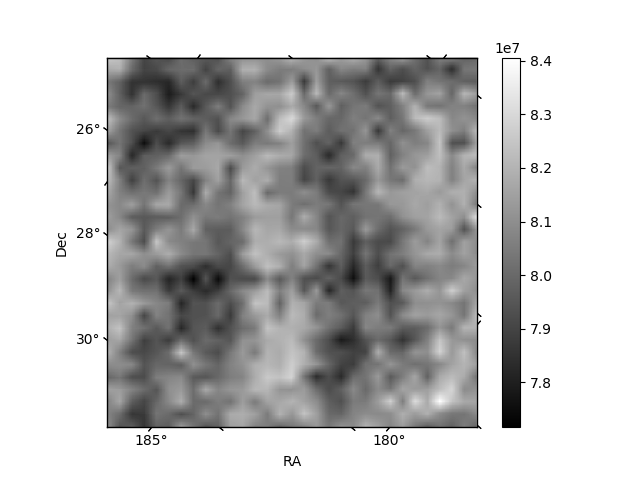
Histogram calculated using DETX and DETY for each event in the final _common_clean file
| Quadrant A | 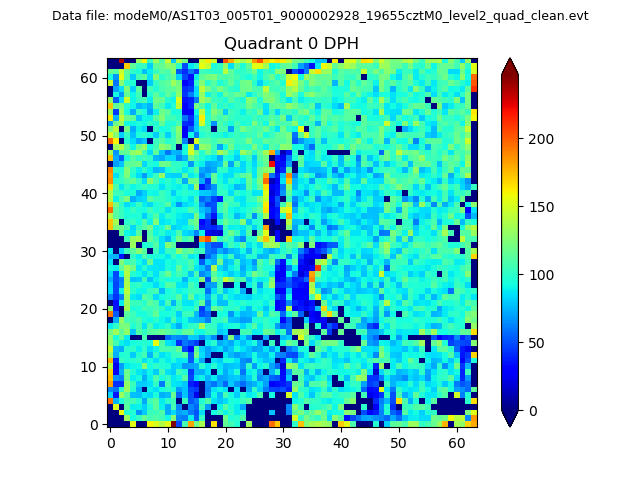 |
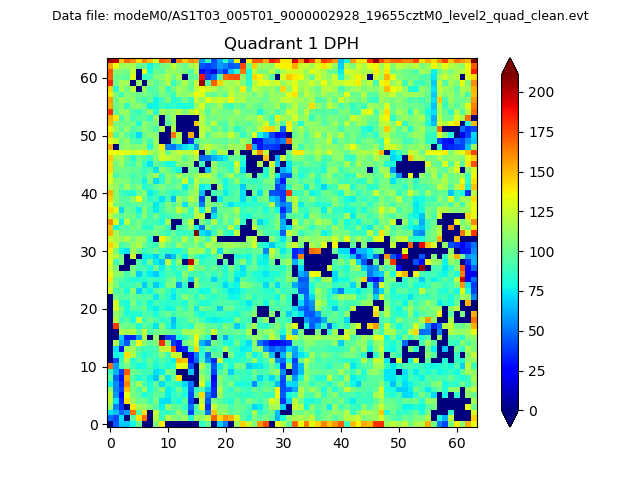 |
Quadrant B |
|---|---|---|---|
| Quadrant D | 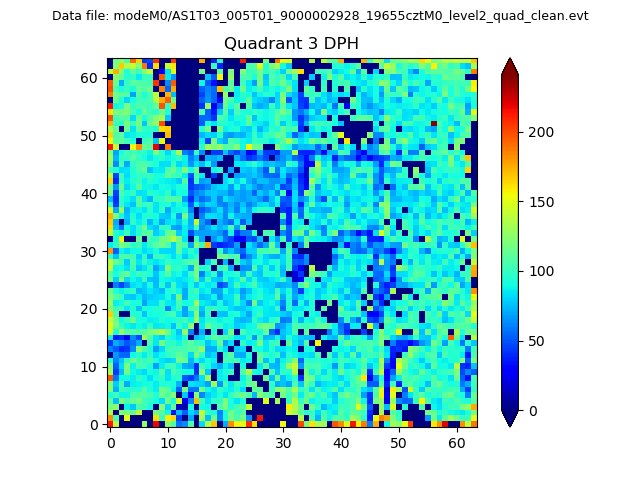 |
 |
Quadrant C |
| Plot type | Count rate plots | Images |
|---|---|---|
| Comparison with Poisson distribution Blue bars denote a histogram of data divided into 1 sec bins. Red curve is a Poisson curve with rate = median count rate of data. |
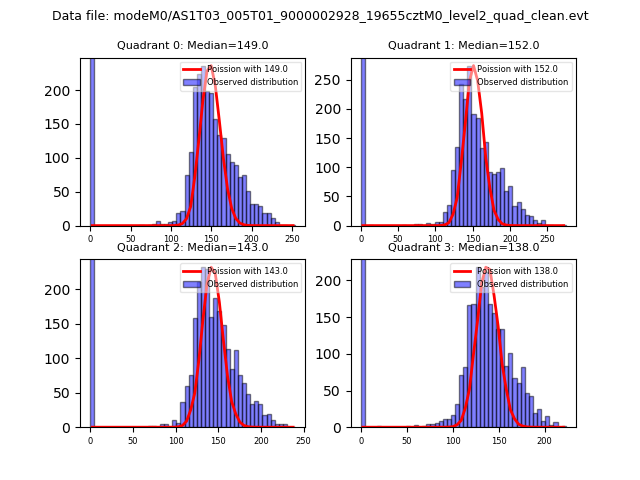 |
 |
| Quadrant-wise count rates Data is divided into 100 sec bins |
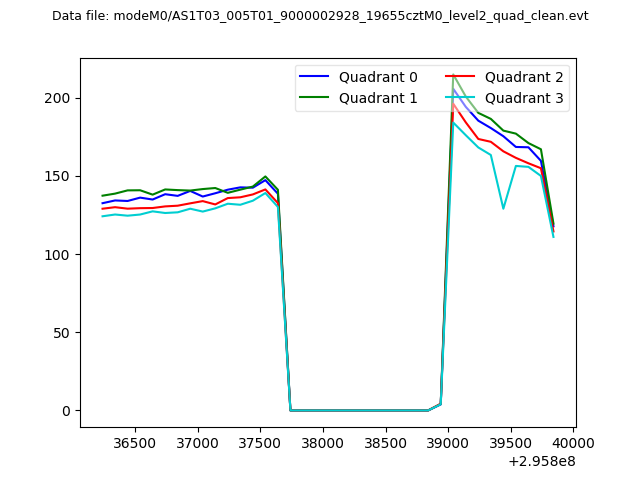 |
|
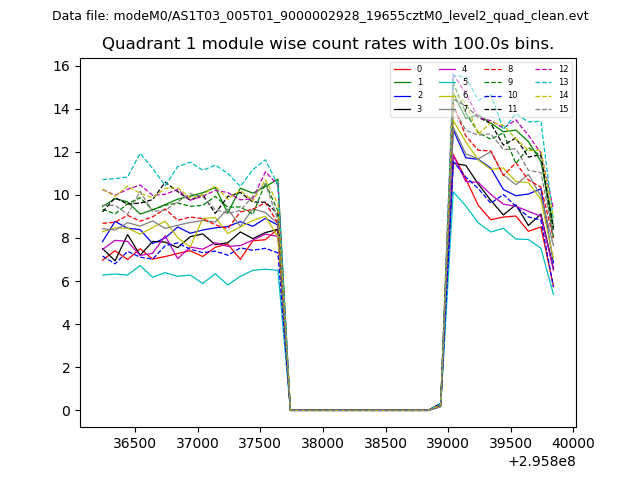
| Module-wise count rates for Quadrant A Data is divided into 100 sec bins |
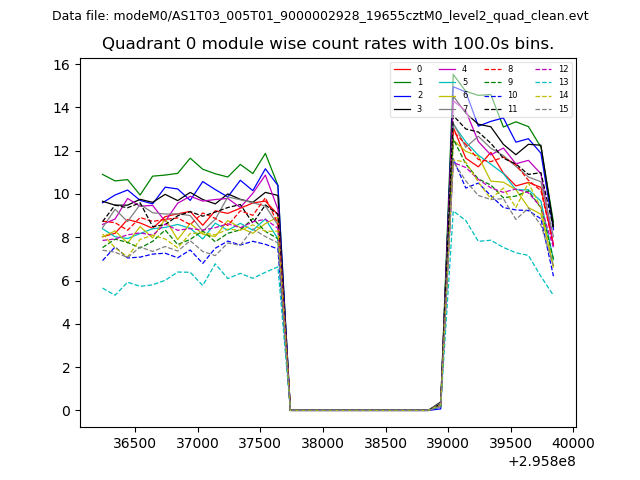 |
 |
| Module-wise count rates for Quadrant B Data is divided into 100 sec bins |
 |
 |
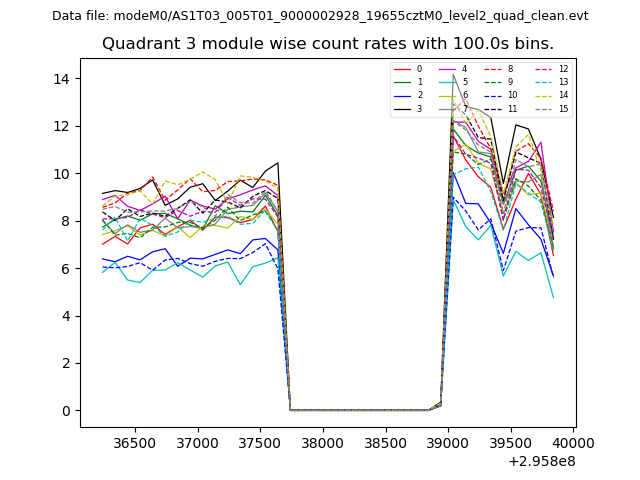
| Module-wise count rates for Quadrant C Data is divided into 100 sec bins |
 |
 |
| Module-wise count rates for Quadrant D Data is divided into 100 sec bins |
 |
 |
| Parameter | Plot |
|---|---|
| CZT HV Monitor | 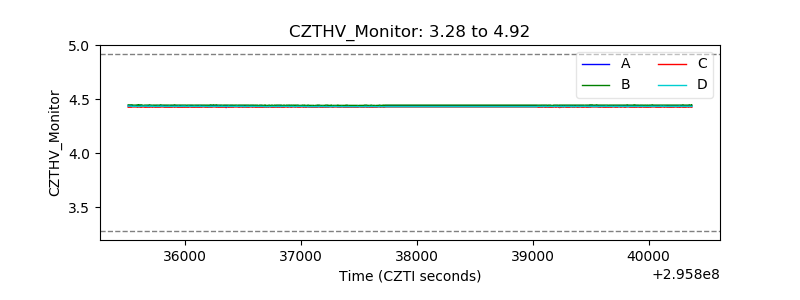 |
| D_VDD | 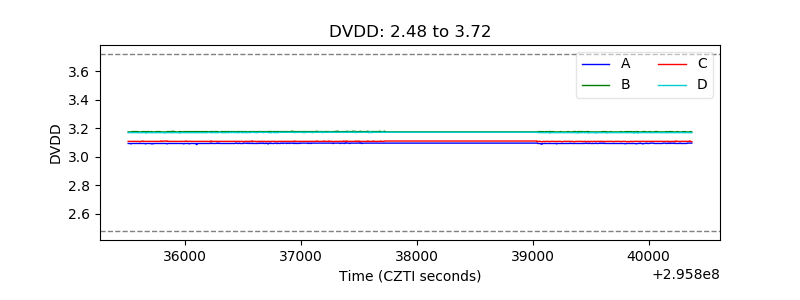 |
| Temperature 1 | 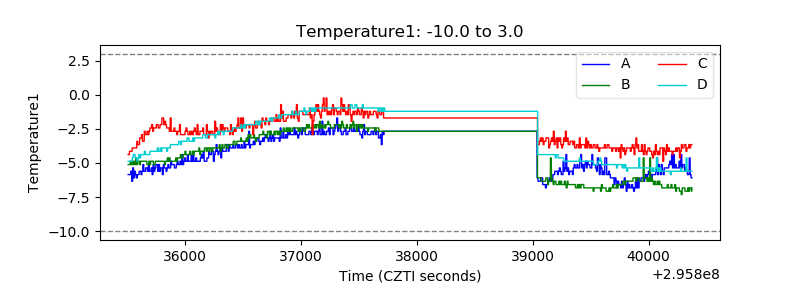 |
| Veto HV Monitor | 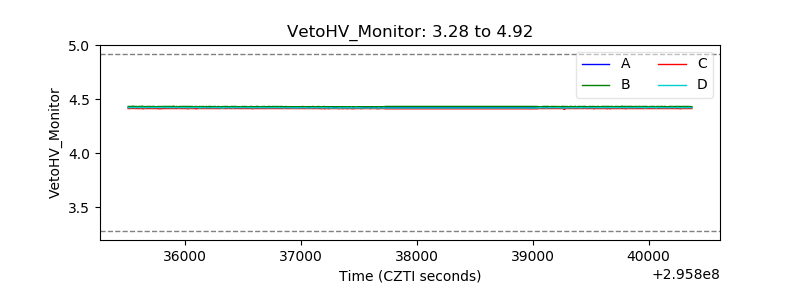 |
| Veto LLD | 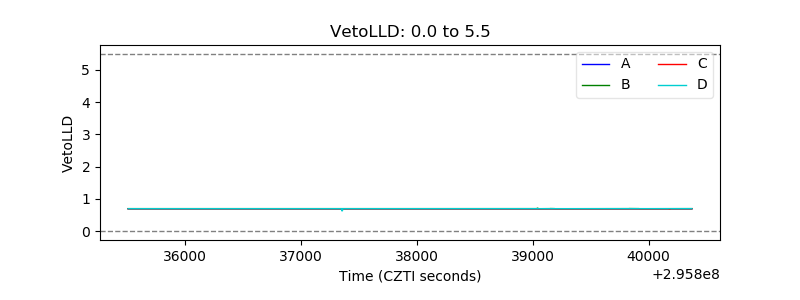 |
| Alpha Counter | 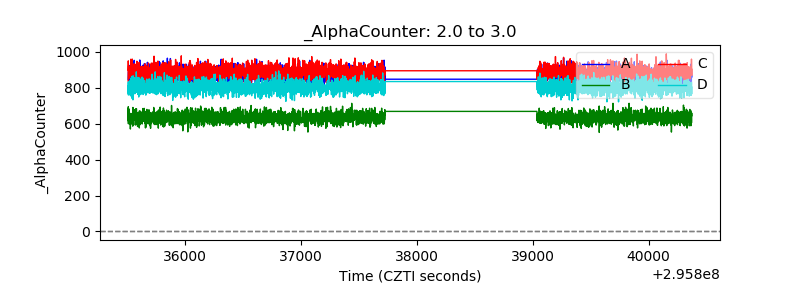 |
| _CPM_Rate | 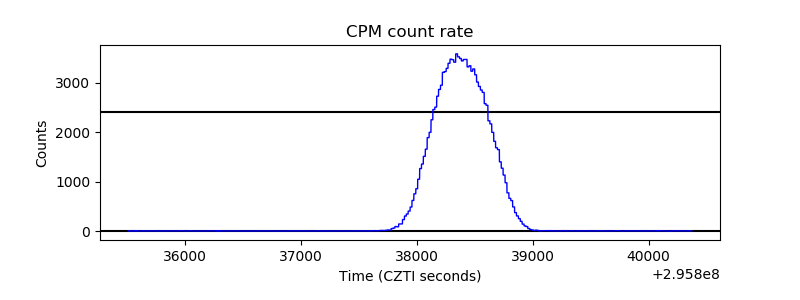 |
| CZT Counter | 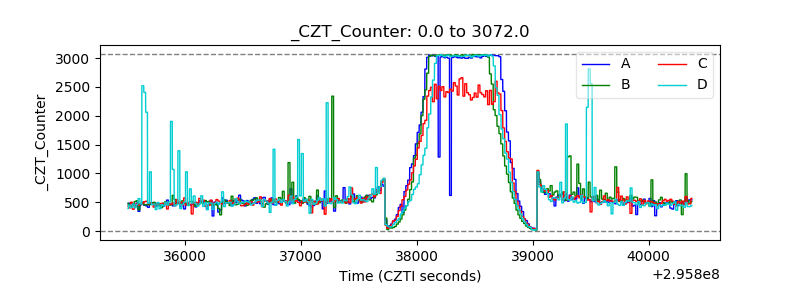 |
| +2.5 Volts monitor | 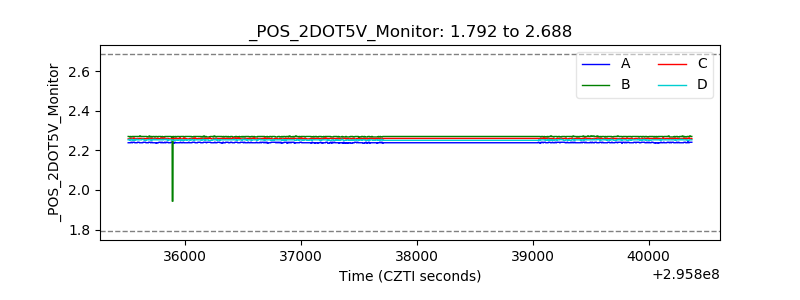 |
| +5 Volts monitor | 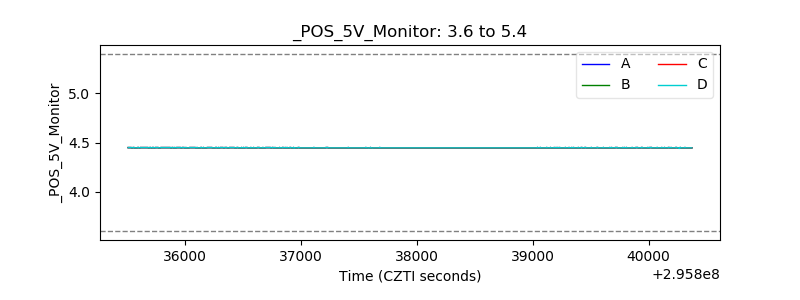 |
| _ROLL_ROT | 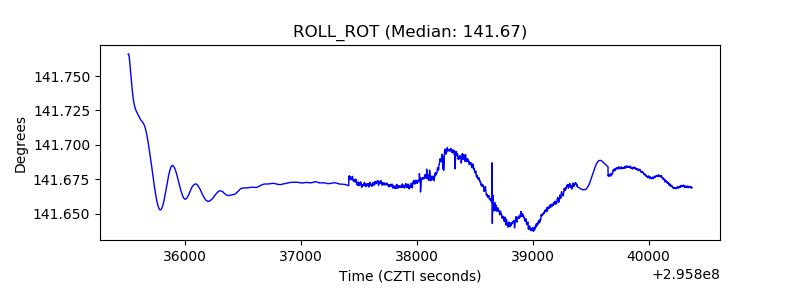 |
| _Roll_DEC |  |
| _Roll_RA | 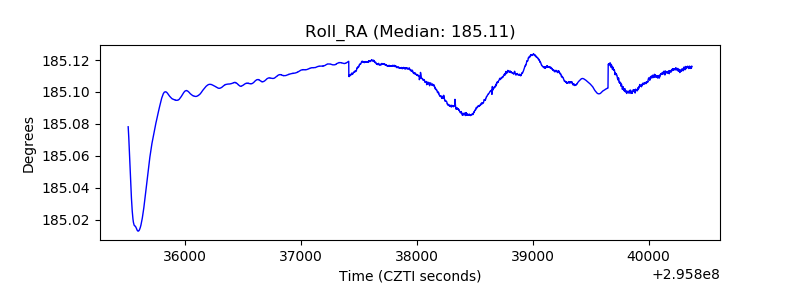 |
| Veto Counter | 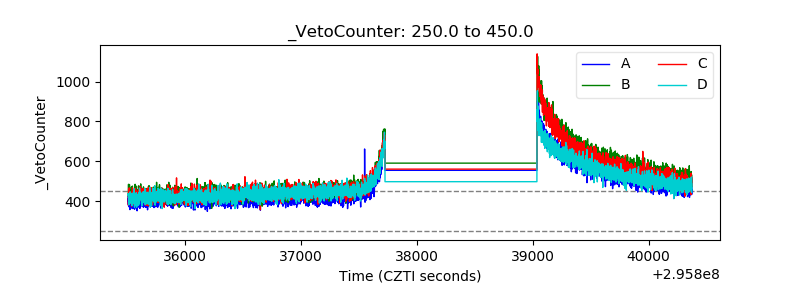 |