| Param | Original file | Final file |
|---|---|---|
| Filename | modeM0/AS1T03_005T01_9000002928_19657cztM0_level2.evt | modeM0/AS1T03_005T01_9000002928_19657cztM0_level2_quad_clean.evt |
| Size (bytes) | 454,743,360 | 67,023,360 |
| Size | 433.7 MB | 63.9 MB |
| Events in quadrant A | 3,274,259 | 405,418 |
| Events in quadrant B | 3,467,050 | 413,701 |
| Events in quadrant C | 3,301,386 | 384,566 |
| Events in quadrant D | 3,292,014 | 376,518 |
| Mode SS | |||
|---|---|---|---|
| Quadrant | BADHDUFLAG | Total packets | Discarded packets |
| A | 0 | 130 | 0 |
| B | 0 | 130 | 0 |
| C | 0 | 130 | 0 |
| D | 0 | 130 | 0 |
| Mode M9 | |||
|---|---|---|---|
| Quadrant | BADHDUFLAG | Total packets | Discarded packets |
| A | 0 | 14 | 0 |
| B | 0 | 14 | 0 |
| C | 0 | 14 | 0 |
| D | 0 | 14 | 0 |
| Mode M0 | |||
|---|---|---|---|
| Quadrant | BADHDUFLAG | Total packets | Discarded packets |
| A | 0 | 13382 | 1 |
| B | 0 | 13953 | 1 |
| C | 0 | 13486 | 1 |
| D | 0 | 13811 | 1 |
| Quadrant | Total seconds | Saturated seconds | Saturation percentage |
|---|---|---|---|
| A | 6438 | 21 | 0.326188% |
| B | 6438 | 56 | 0.869835% |
| C | 6439 | 56 | 0.869700% |
| D | 6439 | 12 | 0.186364% |
Noise dominated data is calculated using 1-second bins in cleaned event files. If a bin has >2000 counts, and if more than 50% of those come from <1% of pixels, then it is considered to be noise-dominated and hence unusable.
| Quadrant | # 1 sec bins | Bins with >0 counts | Bins with >2000 counts | High rate bins dominated by noise | Noise dominated (total time) | Noise dominated (detector-on time) | Marked lightcurve |
|---|---|---|---|---|---|---|---|
| A | 7798 | 6439 | 0 | 0 | 0.00% | 0.00% | 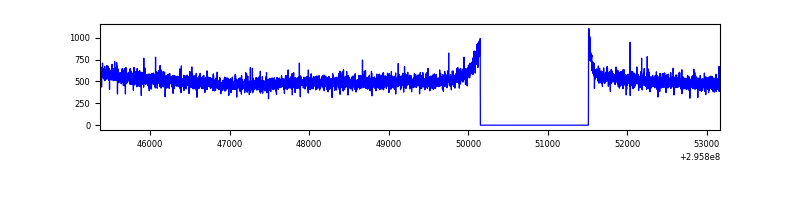 |
| B | 7798 | 6439 | 14 | 14 | 0.18% | 0.22% | 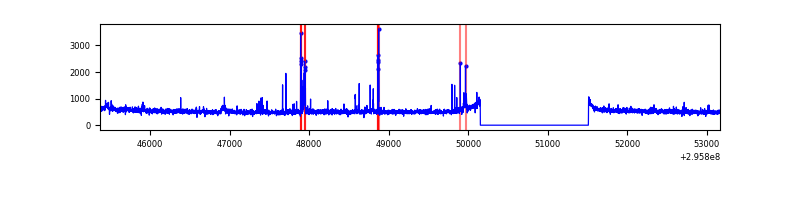 |
| C | 7799 | 6440 | 0 | 0 | 0.00% | 0.00% | 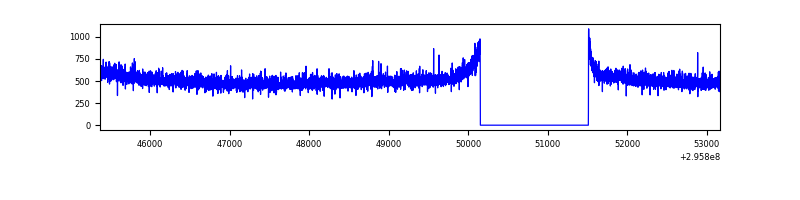 |
| D | 7799 | 6440 | 6 | 6 | 0.08% | 0.09% | 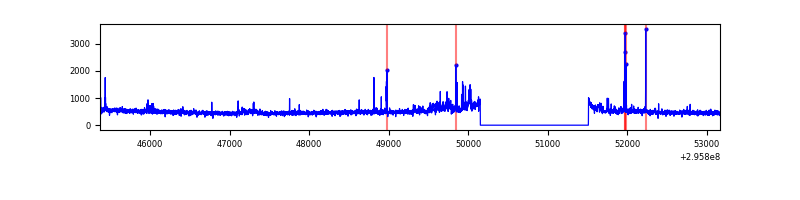 |
Top three noisy pixels from each quadrant. If the there are fewer than three noisy pixels in the level2.evt file, extra rows are filled as -1
| Pixel properties | Quadrant properties | ||||||
|---|---|---|---|---|---|---|---|
| Quadrant | DetID | PixID | Counts | Sigma | Mean | Median | Sigma |
| A | 0 | 226 | 7224 | 37.81 | 849 | 835 | 169.0 |
| A | 3 | 137 | 6369 | 32.75 | 849 | 835 | 169.0 |
| A | 13 | 254 | 6316 | 32.44 | 849 | 835 | 169.0 |
| B | 3 | 112 | 71453 | 443.02 | 848 | 832 | 159.4 |
| B | 7 | 220 | 29945 | 182.63 | 848 | 832 | 159.4 |
| B | 12 | 111 | 18430 | 110.4 | 848 | 832 | 159.4 |
| C | 14 | 238 | 127546 | 681.71 | 803 | 813 | 185.9 |
| C | 3 | 233 | 15505 | 79.03 | 803 | 813 | 185.9 |
| C | 4 | 175 | 14703 | 74.72 | 803 | 813 | 185.9 |
| D | 1 | 52 | 147544 | 756.78 | 807 | 785 | 193.9 |
| D | 1 | 20 | 28829 | 144.61 | 807 | 785 | 193.9 |
| D | 10 | 199 | 24335 | 121.44 | 807 | 785 | 193.9 |
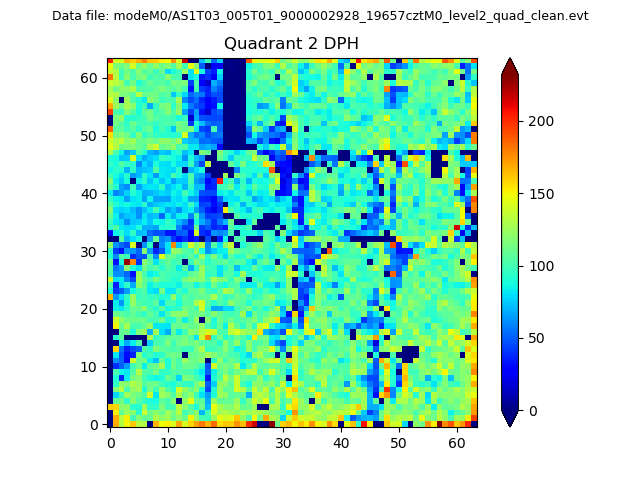
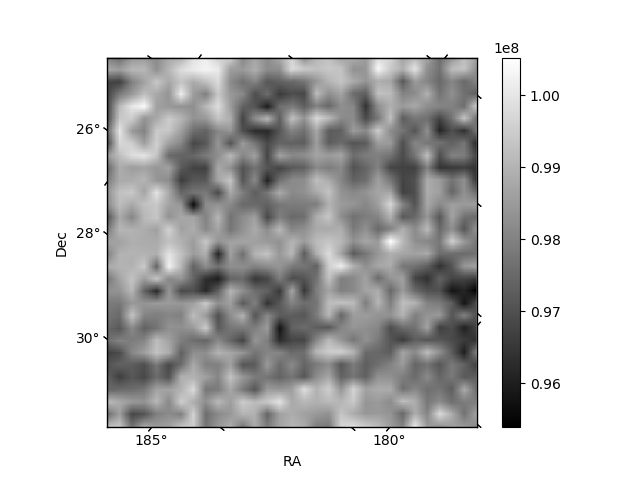
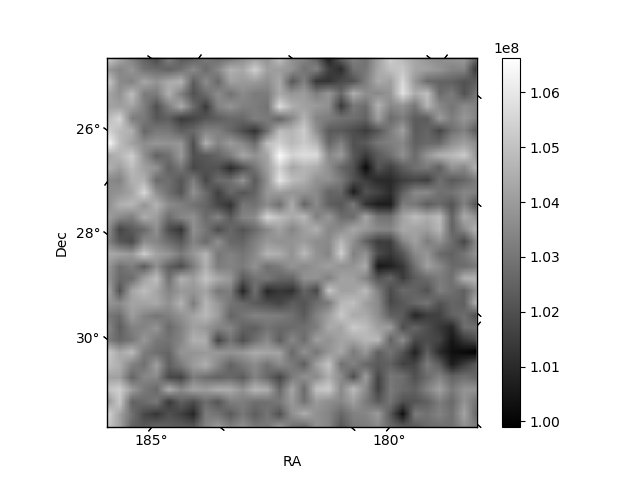
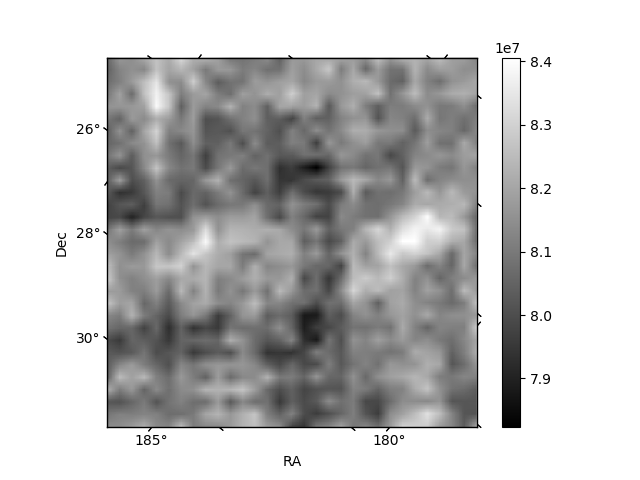
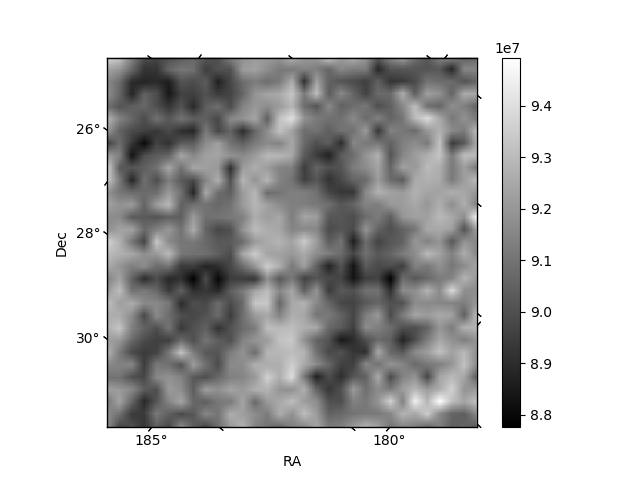
Histogram calculated using DETX and DETY for each event in the final _common_clean file
| Quadrant A | 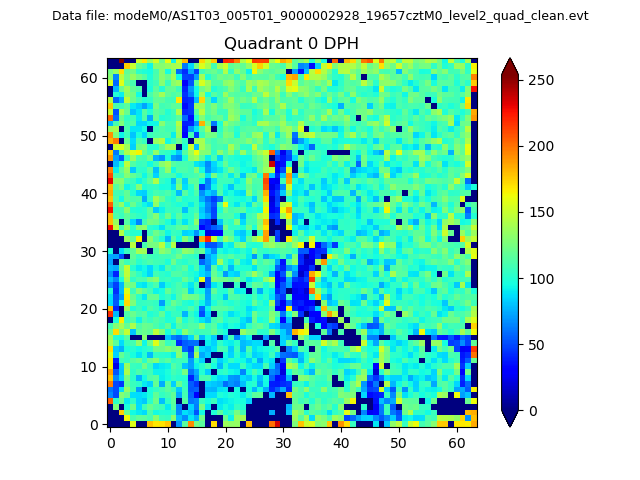 |
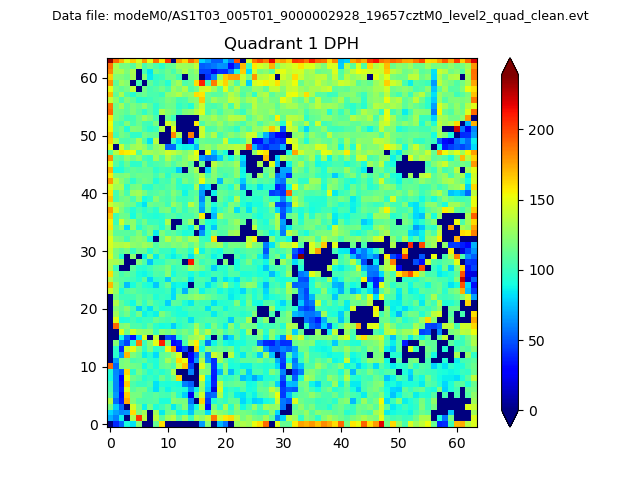 |
Quadrant B |
|---|---|---|---|
| Quadrant D | 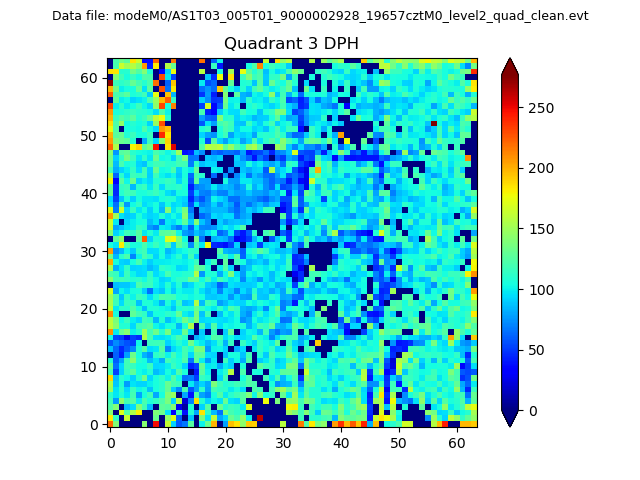 |
 |
Quadrant C |
| Plot type | Count rate plots | Images |
|---|---|---|
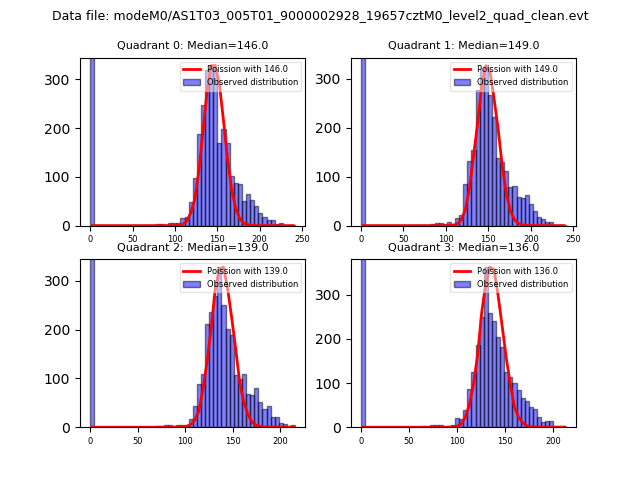
| Comparison with Poisson distribution Blue bars denote a histogram of data divided into 1 sec bins. Red curve is a Poisson curve with rate = median count rate of data. |
 |
 |
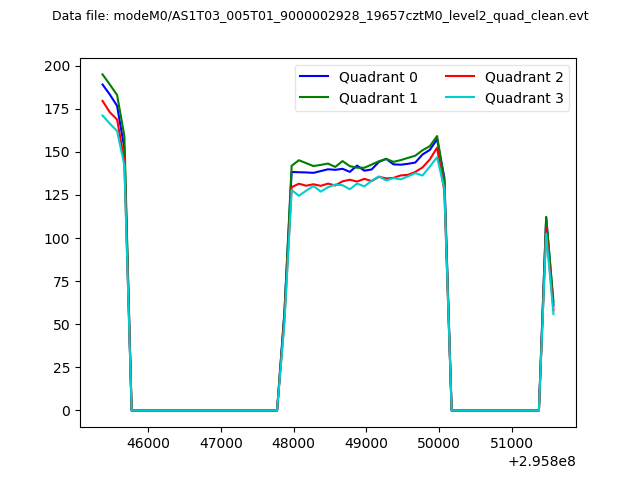
| Quadrant-wise count rates Data is divided into 100 sec bins |
 |
|
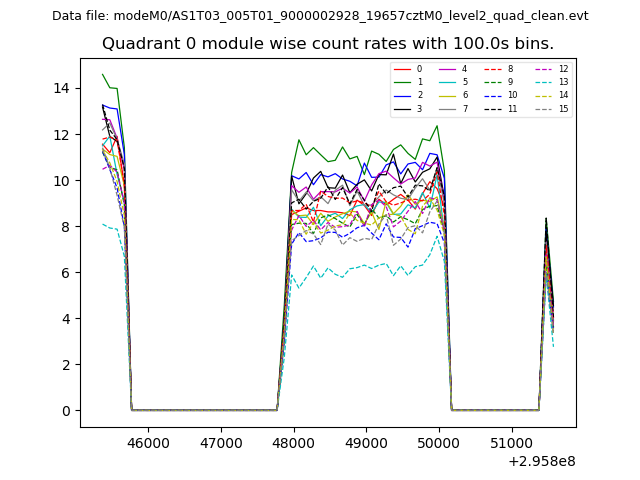
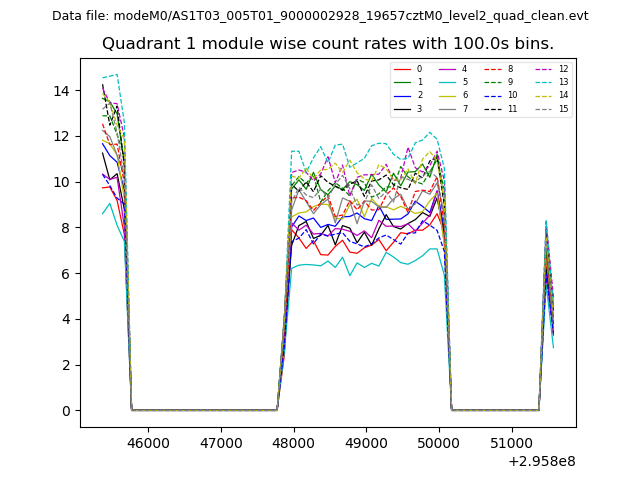
| Module-wise count rates for Quadrant A Data is divided into 100 sec bins |
 |
 |
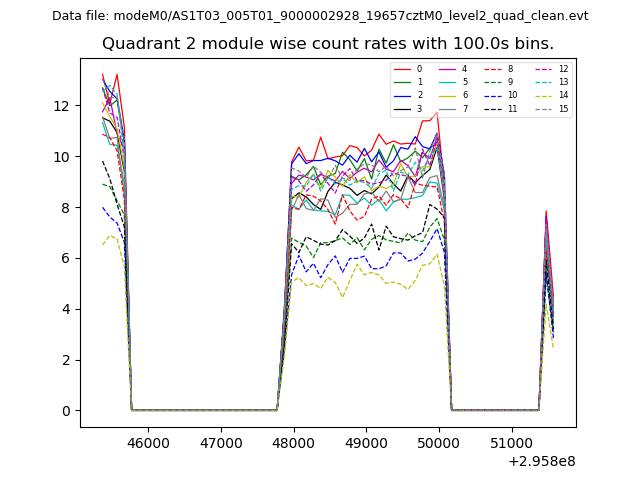
| Module-wise count rates for Quadrant B Data is divided into 100 sec bins |
 |
 |
| Module-wise count rates for Quadrant C Data is divided into 100 sec bins |
 |
 |
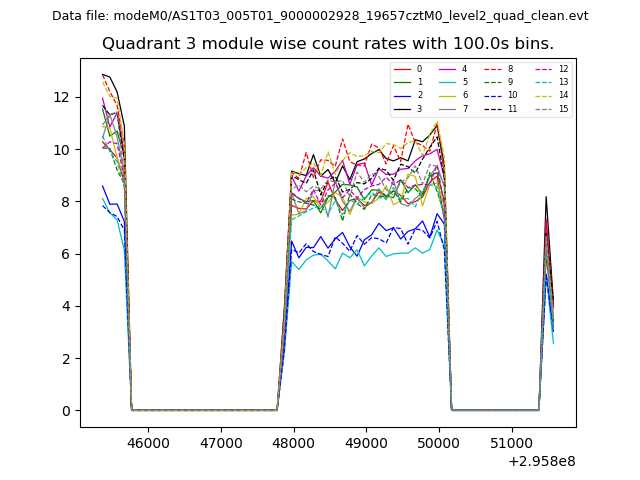
| Module-wise count rates for Quadrant D Data is divided into 100 sec bins |
 |
 |
| Parameter | Plot |
|---|---|
| CZT HV Monitor | 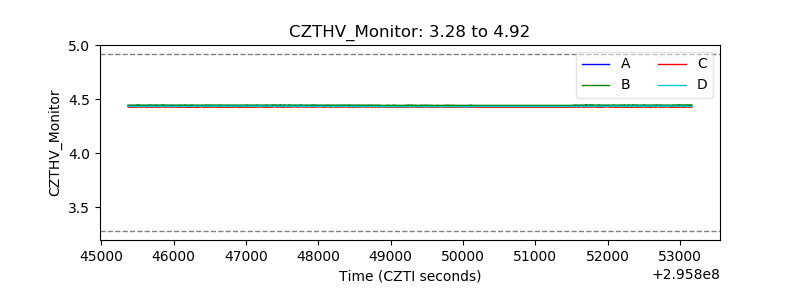 |
| D_VDD | 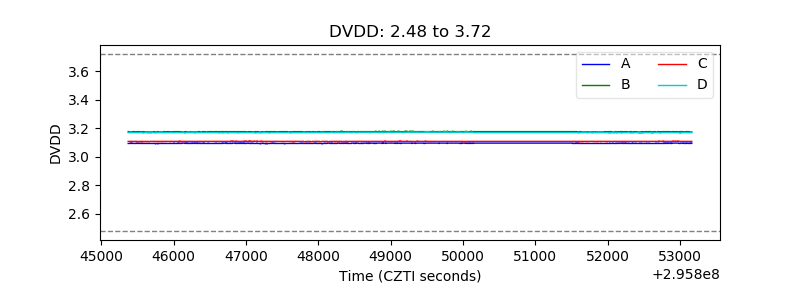 |
| Temperature 1 | 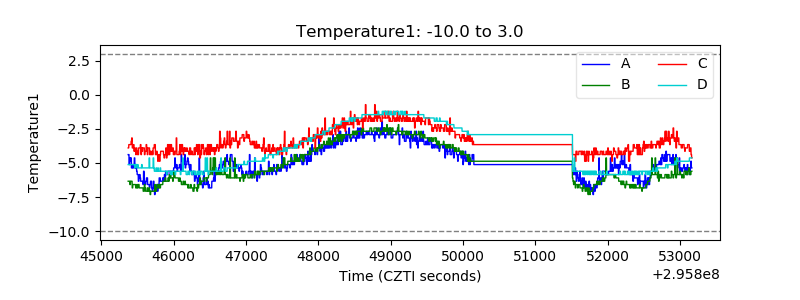 |
| Veto HV Monitor |  |
| Veto LLD | 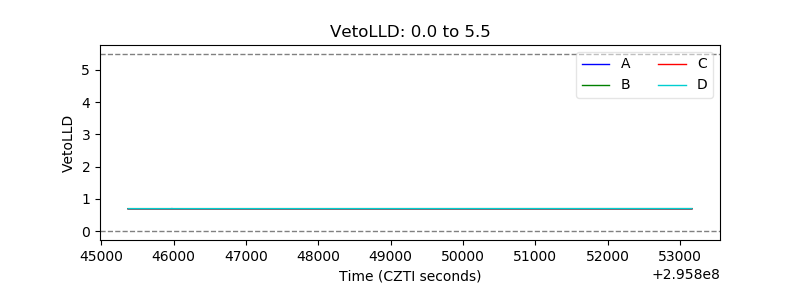 |
| Alpha Counter |  |
| _CPM_Rate |  |
| CZT Counter | 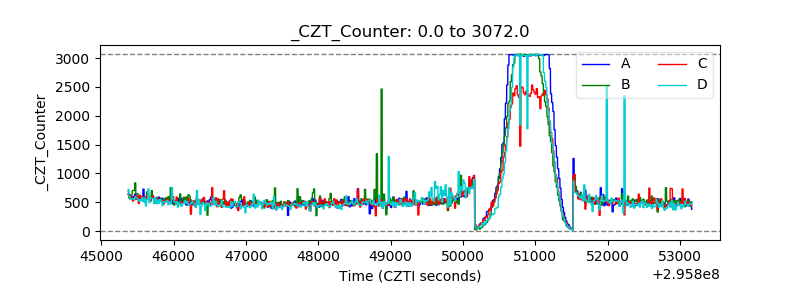 |
| +2.5 Volts monitor |  |
| +5 Volts monitor |  |
| _ROLL_ROT | 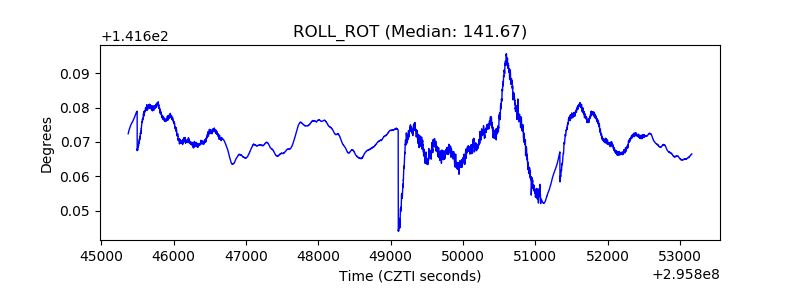 |
| _Roll_DEC | 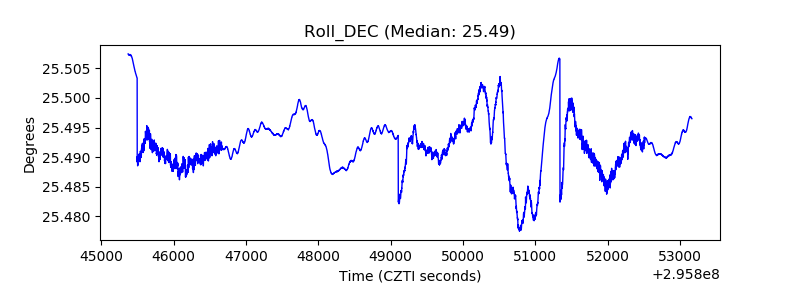 |
| _Roll_RA | 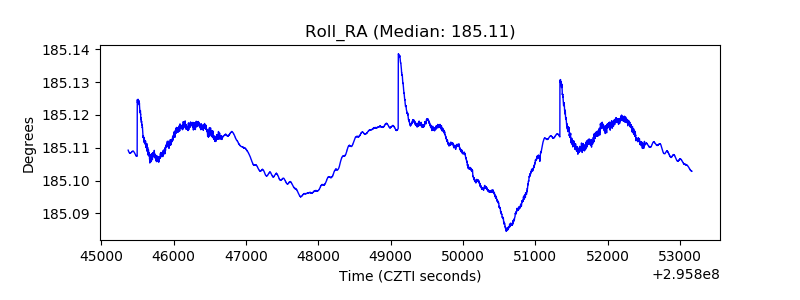 |
| Veto Counter | 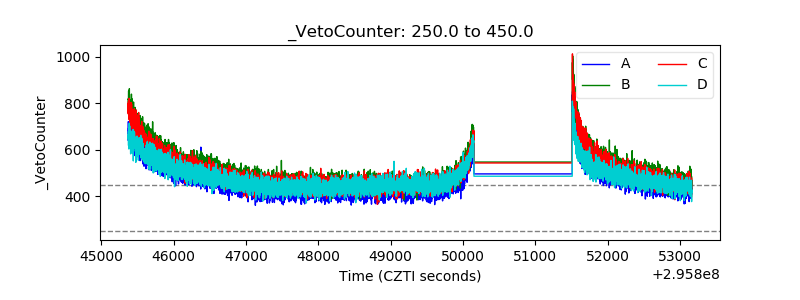 |