| Param | Original file | Final file |
|---|---|---|
| Filename | modeM0/AS1T03_005T01_9000002928_19658cztM0_level2.evt | modeM0/AS1T03_005T01_9000002928_19658cztM0_level2_quad_clean.evt |
| Size (bytes) | 459,331,200 | 65,980,800 |
| Size | 438.1 MB | 62.9 MB |
| Events in quadrant A | 3,218,834 | 397,093 |
| Events in quadrant B | 3,270,241 | 402,658 |
| Events in quadrant C | 3,235,061 | 378,601 |
| Events in quadrant D | 3,749,937 | 370,749 |
| Mode SS | |||
|---|---|---|---|
| Quadrant | BADHDUFLAG | Total packets | Discarded packets |
| A | 0 | 130 | 0 |
| B | 0 | 130 | 0 |
| C | 0 | 130 | 0 |
| D | 0 | 130 | 0 |
| Mode M9 | |||
|---|---|---|---|
| Quadrant | BADHDUFLAG | Total packets | Discarded packets |
| A | 0 | 11 | 0 |
| B | 0 | 11 | 0 |
| C | 0 | 11 | 0 |
| D | 0 | 11 | 0 |
| Mode M0 | |||
|---|---|---|---|
| Quadrant | BADHDUFLAG | Total packets | Discarded packets |
| A | 0 | 13362 | 1 |
| B | 0 | 13404 | 1 |
| C | 0 | 13386 | 1 |
| D | 0 | 15465 | 2 |
| Quadrant | Total seconds | Saturated seconds | Saturation percentage |
|---|---|---|---|
| A | 6430 | 104 | 1.617418% |
| B | 6430 | 121 | 1.881804% |
| C | 6431 | 111 | 1.726015% |
| D | 6430 | 98 | 1.524106% |
Noise dominated data is calculated using 1-second bins in cleaned event files. If a bin has >2000 counts, and if more than 50% of those come from <1% of pixels, then it is considered to be noise-dominated and hence unusable.
| Quadrant | # 1 sec bins | Bins with >0 counts | Bins with >2000 counts | High rate bins dominated by noise | Noise dominated (total time) | Noise dominated (detector-on time) | Marked lightcurve |
|---|---|---|---|---|---|---|---|
| A | 7545 | 6430 | 0 | 0 | 0.00% | 0.00% | 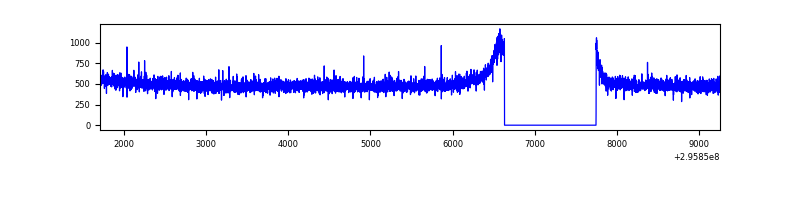 |
| B | 7545 | 6430 | 0 | 0 | 0.00% | 0.00% | 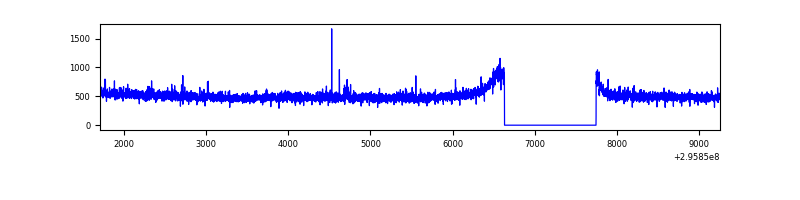 |
| C | 7546 | 6431 | 0 | 0 | 0.00% | 0.00% | 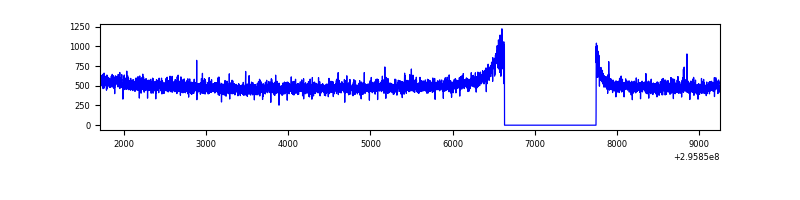 |
| D | 7545 | 6430 | 7 | 7 | 0.09% | 0.11% | 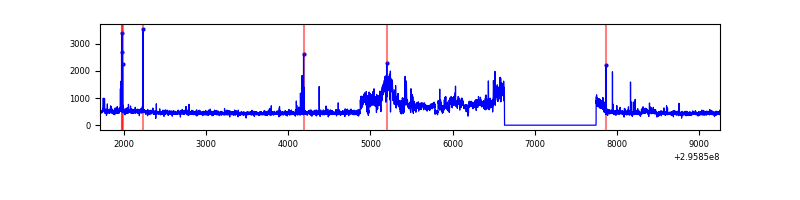 |
Top three noisy pixels from each quadrant. If the there are fewer than three noisy pixels in the level2.evt file, extra rows are filled as -1
| Pixel properties | Quadrant properties | ||||||
|---|---|---|---|---|---|---|---|
| Quadrant | DetID | PixID | Counts | Sigma | Mean | Median | Sigma |
| A | 11 | 29 | 9058 | 48.96 | 834 | 818 | 168.3 |
| A | 13 | 254 | 7183 | 37.82 | 834 | 818 | 168.3 |
| A | 0 | 226 | 7169 | 37.74 | 834 | 818 | 168.3 |
| B | 12 | 111 | 19175 | 117.12 | 828 | 808 | 156.8 |
| B | 11 | 111 | 16815 | 102.07 | 828 | 808 | 156.8 |
| B | 0 | 198 | 15331 | 92.61 | 828 | 808 | 156.8 |
| C | 14 | 238 | 122985 | 663.16 | 787 | 792 | 184.3 |
| C | 3 | 233 | 26341 | 138.66 | 787 | 792 | 184.3 |
| C | 9 | 221 | 10541 | 52.91 | 787 | 792 | 184.3 |
| D | 1 | 52 | 694789 | 3611.81 | 794 | 773 | 192.2 |
| D | 7 | 96 | 27506 | 139.12 | 794 | 773 | 192.2 |
| D | 2 | 234 | 22427 | 112.69 | 794 | 773 | 192.2 |
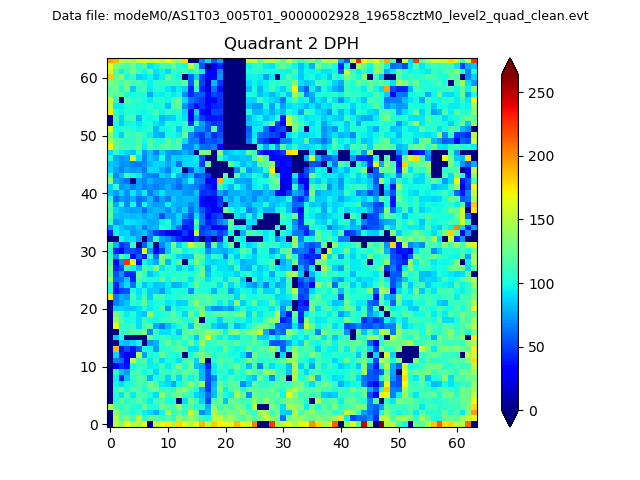
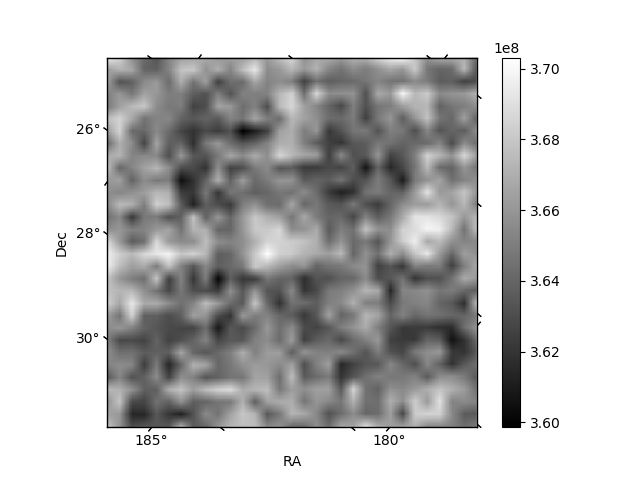
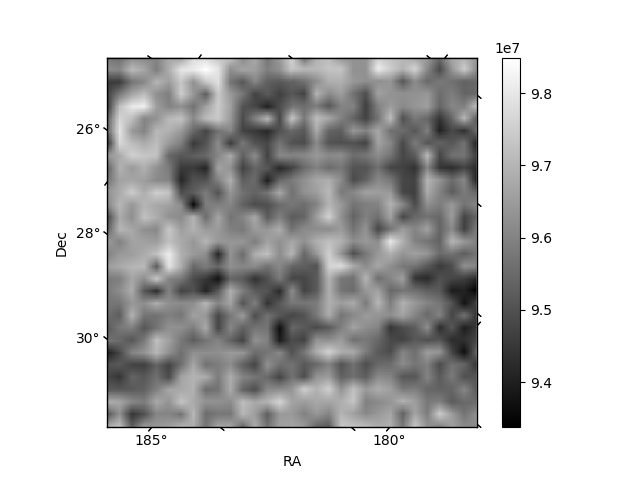
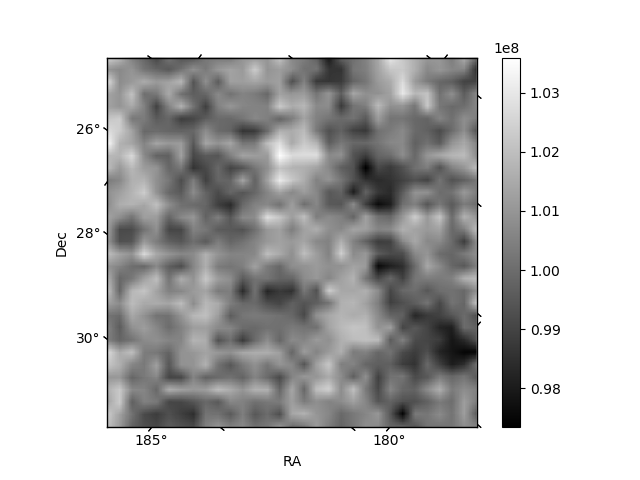
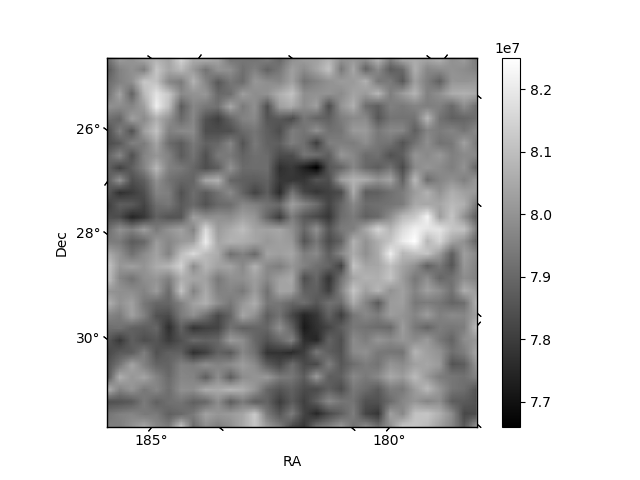
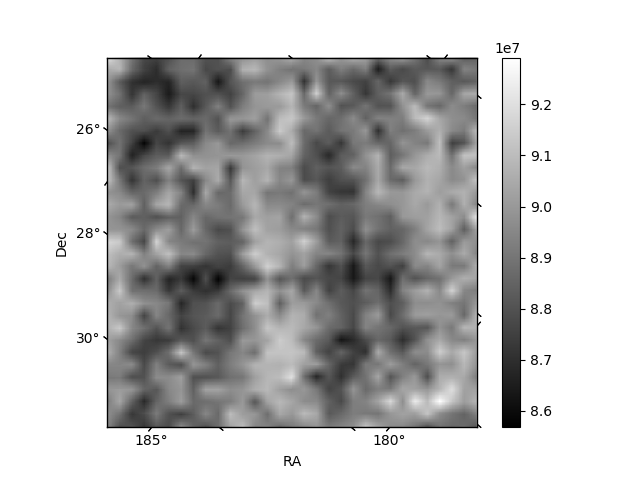
Histogram calculated using DETX and DETY for each event in the final _common_clean file
| Quadrant A | 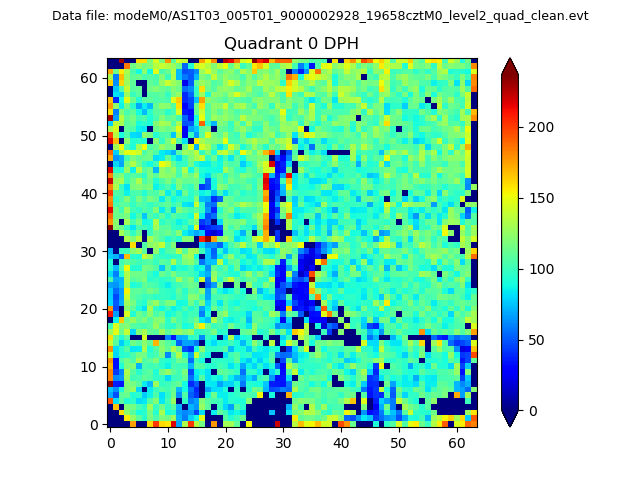 |
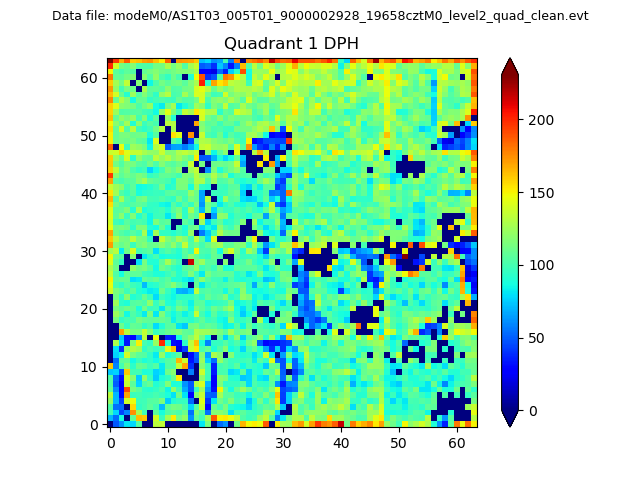 |
Quadrant B |
|---|---|---|---|
| Quadrant D | 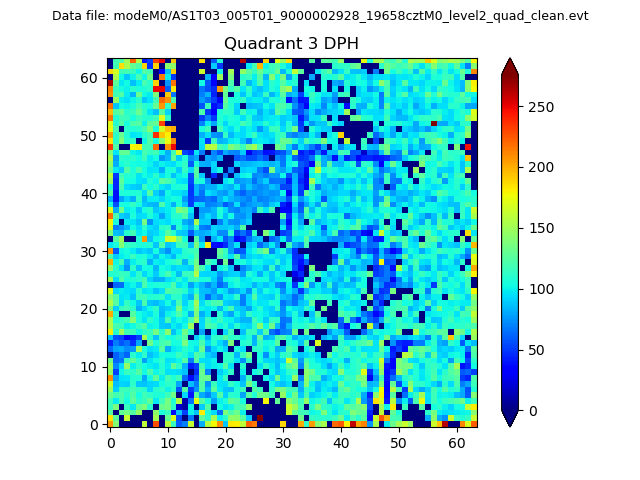 |
 |
Quadrant C |
| Plot type | Count rate plots | Images |
|---|---|---|
| Comparison with Poisson distribution Blue bars denote a histogram of data divided into 1 sec bins. Red curve is a Poisson curve with rate = median count rate of data. |
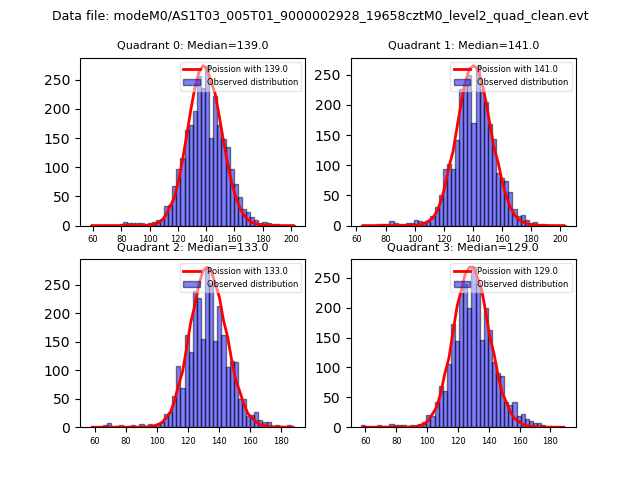 |
 |
| Quadrant-wise count rates Data is divided into 100 sec bins |
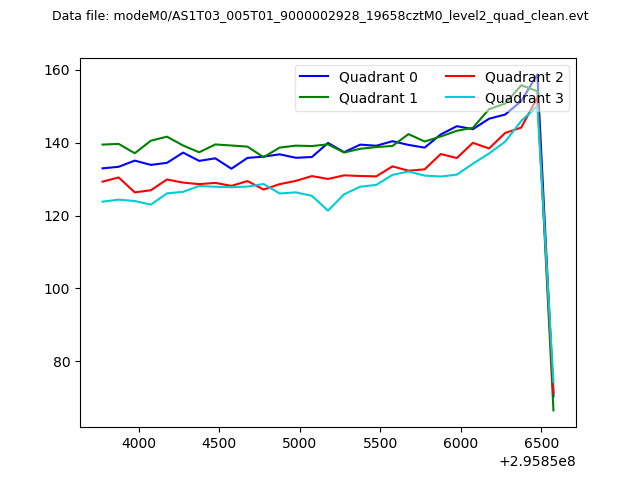 |
|
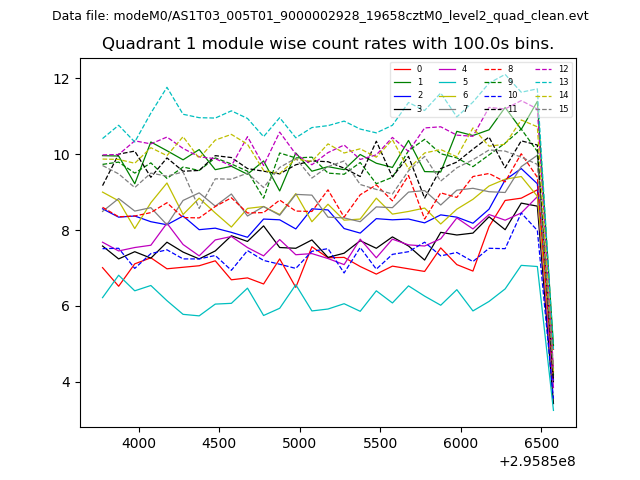
| Module-wise count rates for Quadrant A Data is divided into 100 sec bins |
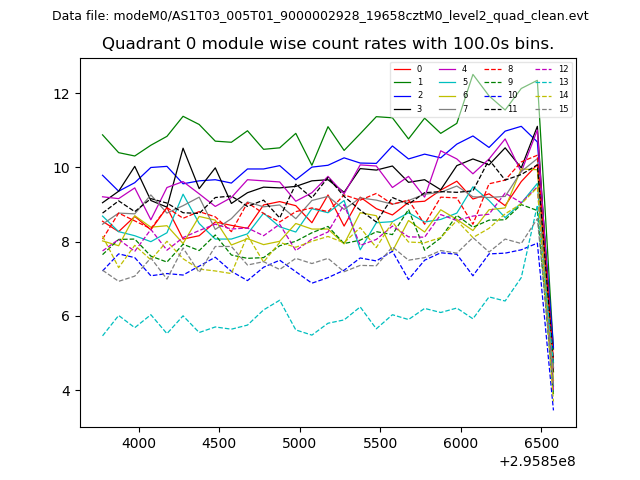 |
 |
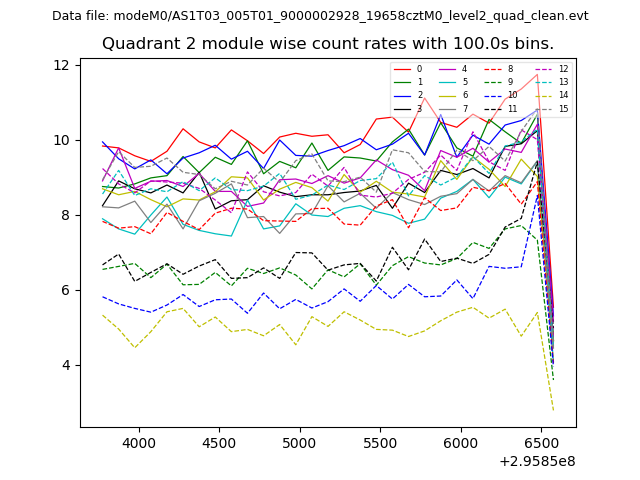
| Module-wise count rates for Quadrant B Data is divided into 100 sec bins |
 |
 |
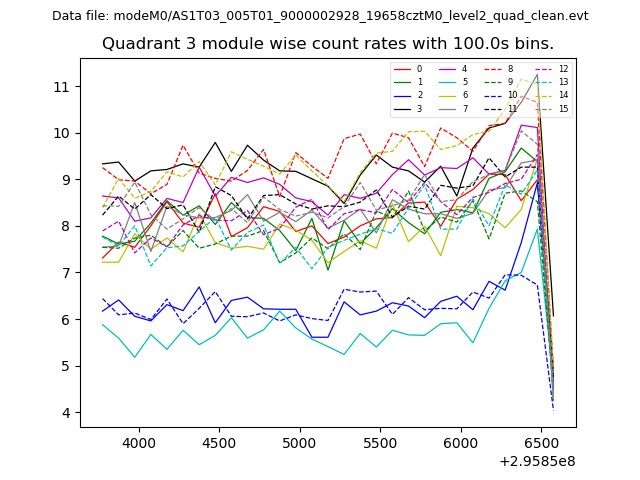
| Module-wise count rates for Quadrant C Data is divided into 100 sec bins |
 |
 |
| Module-wise count rates for Quadrant D Data is divided into 100 sec bins |
 |
 |
| Parameter | Plot |
|---|---|
| CZT HV Monitor | 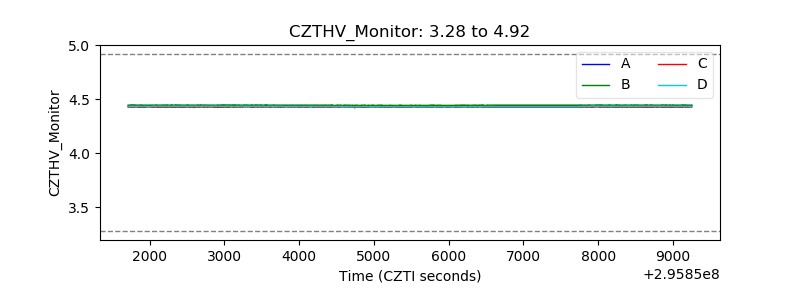 |
| D_VDD | 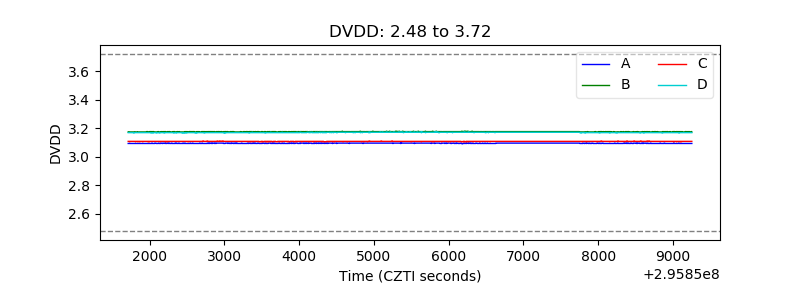 |
| Temperature 1 | 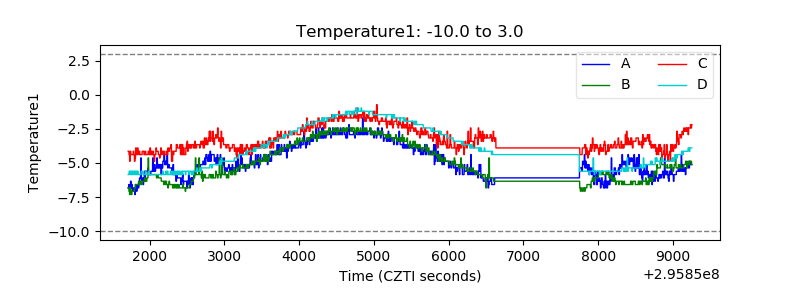 |
| Veto HV Monitor | 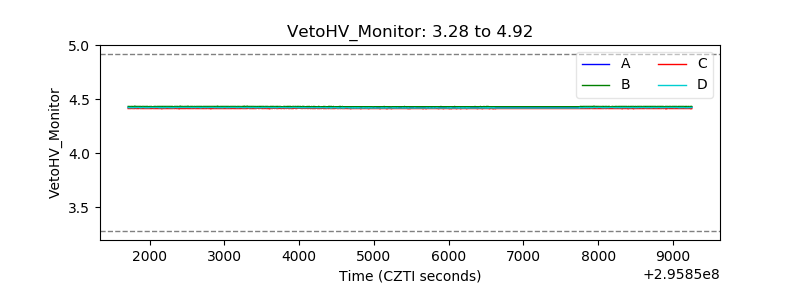 |
| Veto LLD | 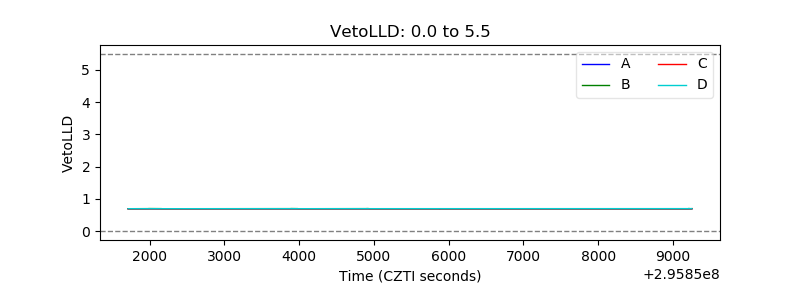 |
| Alpha Counter | 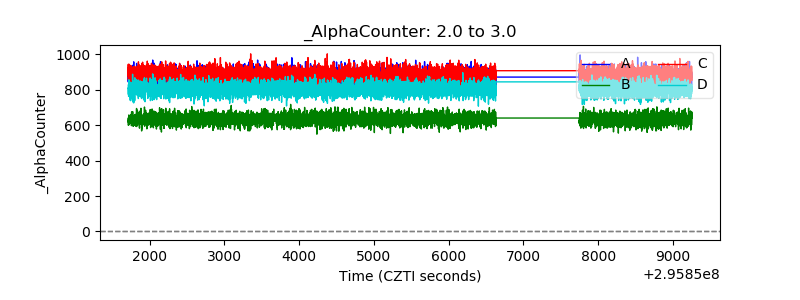 |
| _CPM_Rate | 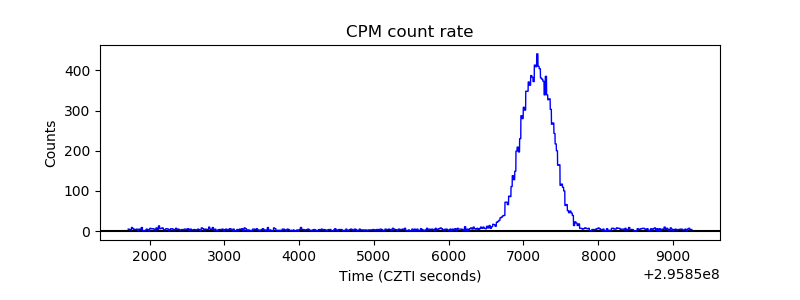 |
| CZT Counter | 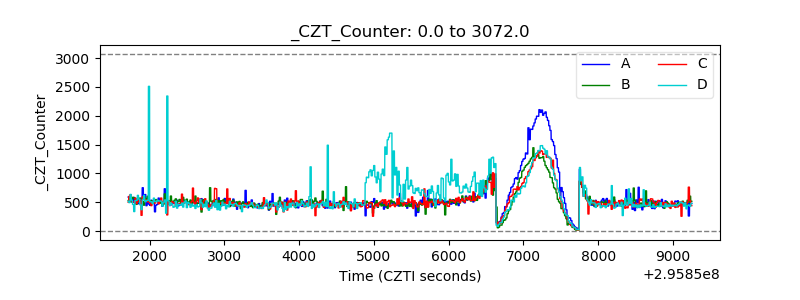 |
| +2.5 Volts monitor |  |
| +5 Volts monitor |  |
| _ROLL_ROT | 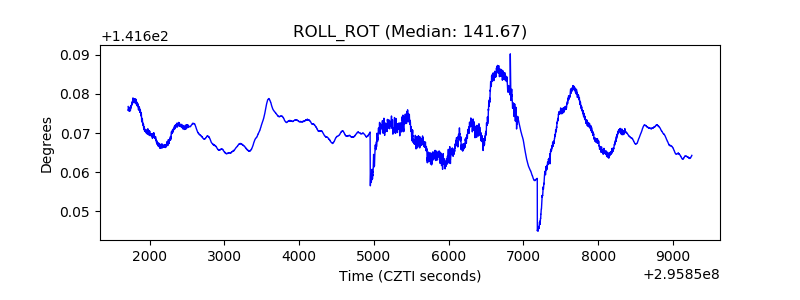 |
| _Roll_DEC |  |
| _Roll_RA | 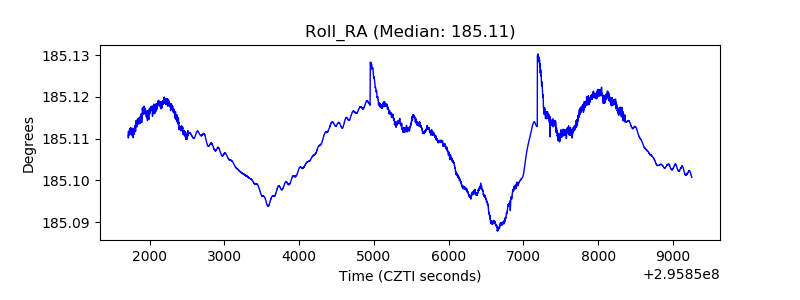 |
| Veto Counter | 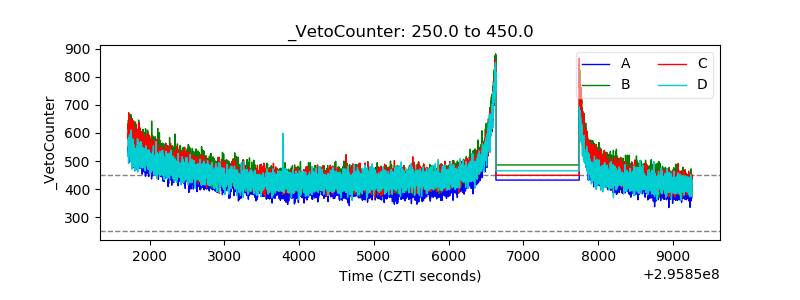 |