| Param | Original file | Final file |
|---|---|---|
| Filename | modeM0/AS1T03_005T01_9000002928_19659cztM0_level2.evt | modeM0/AS1T03_005T01_9000002928_19659cztM0_level2_quad_clean.evt |
| Size (bytes) | 489,764,160 | 81,224,640 |
| Size | 467.1 MB | 77.5 MB |
| Events in quadrant A | 3,589,528 | 500,000 |
| Events in quadrant B | 3,633,972 | 506,809 |
| Events in quadrant C | 3,587,125 | 480,689 |
| Events in quadrant D | 3,535,881 | 473,953 |
| Mode SS | |||
|---|---|---|---|
| Quadrant | BADHDUFLAG | Total packets | Discarded packets |
| A | 0 | 148 | 0 |
| B | 0 | 148 | 0 |
| C | 0 | 148 | 0 |
| D | 0 | 148 | 0 |
| Mode M9 | |||
|---|---|---|---|
| Quadrant | BADHDUFLAG | Total packets | Discarded packets |
| A | 0 | 18 | 0 |
| B | 0 | 18 | 0 |
| C | 0 | 18 | 0 |
| D | 0 | 18 | 0 |
| Mode M0 | |||
|---|---|---|---|
| Quadrant | BADHDUFLAG | Total packets | Discarded packets |
| A | 0 | 15139 | 2 |
| B | 0 | 15128 | 2 |
| C | 0 | 15025 | 2 |
| D | 0 | 15314 | 2 |
| Quadrant | Total seconds | Saturated seconds | Saturation percentage |
|---|---|---|---|
| A | 7144 | 201 | 2.813550% |
| B | 7145 | 246 | 3.442967% |
| C | 7145 | 221 | 3.093072% |
| D | 7145 | 161 | 2.253324% |
Noise dominated data is calculated using 1-second bins in cleaned event files. If a bin has >2000 counts, and if more than 50% of those come from <1% of pixels, then it is considered to be noise-dominated and hence unusable.
| Quadrant | # 1 sec bins | Bins with >0 counts | Bins with >2000 counts | High rate bins dominated by noise | Noise dominated (total time) | Noise dominated (detector-on time) | Marked lightcurve |
|---|---|---|---|---|---|---|---|
| A | 8989 | 7144 | 3 | 3 | 0.03% | 0.04% | 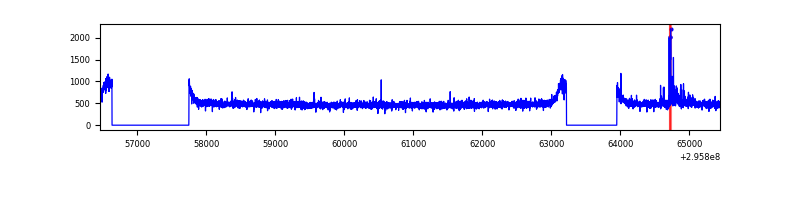 |
| B | 8990 | 7145 | 3 | 3 | 0.03% | 0.04% | 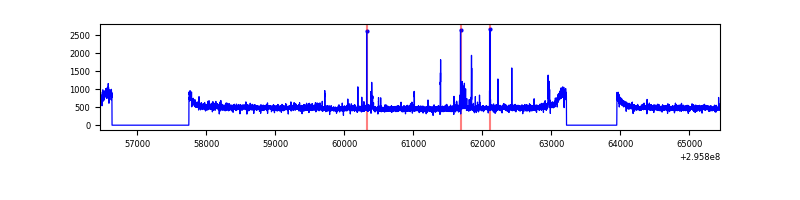 |
| C | 8990 | 7145 | 0 | 0 | 0.00% | 0.00% | 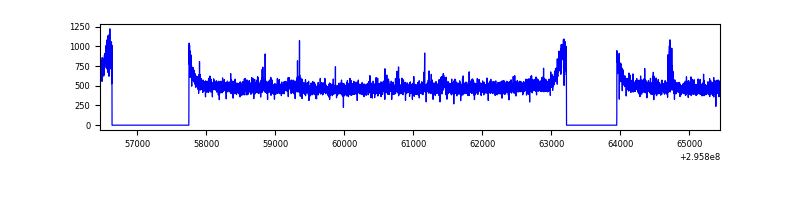 |
| D | 8990 | 7145 | 6 | 6 | 0.07% | 0.08% | 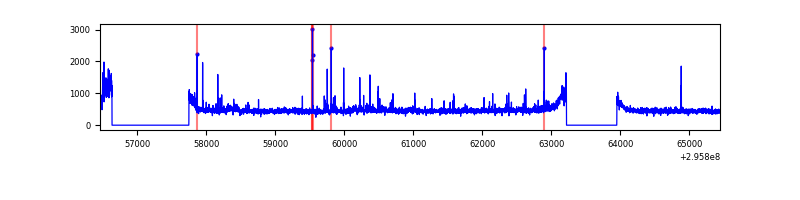 |
Top three noisy pixels from each quadrant. If the there are fewer than three noisy pixels in the level2.evt file, extra rows are filled as -1
| Pixel properties | Quadrant properties | ||||||
|---|---|---|---|---|---|---|---|
| Quadrant | DetID | PixID | Counts | Sigma | Mean | Median | Sigma |
| A | 13 | 252 | 56947 | 304.59 | 911 | 891 | 184.0 |
| A | 11 | 29 | 20480 | 106.44 | 911 | 891 | 184.0 |
| A | 9 | 143 | 8612 | 41.95 | 911 | 891 | 184.0 |
| B | 7 | 220 | 25677 | 141.84 | 905 | 883 | 174.8 |
| B | 0 | 198 | 21502 | 117.95 | 905 | 883 | 174.8 |
| B | 12 | 111 | 21428 | 117.53 | 905 | 883 | 174.8 |
| C | 14 | 238 | 134083 | 653.69 | 864 | 869 | 203.8 |
| C | 3 | 233 | 68938 | 334.02 | 864 | 869 | 203.8 |
| C | 9 | 221 | 15711 | 72.83 | 864 | 869 | 203.8 |
| D | 1 | 52 | 134922 | 620.9 | 878 | 851 | 215.9 |
| D | 1 | 20 | 46619 | 211.96 | 878 | 851 | 215.9 |
| D | 2 | 234 | 25957 | 116.27 | 878 | 851 | 215.9 |
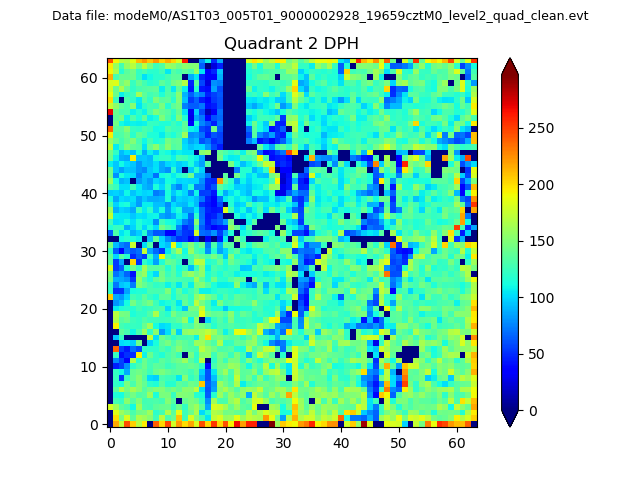
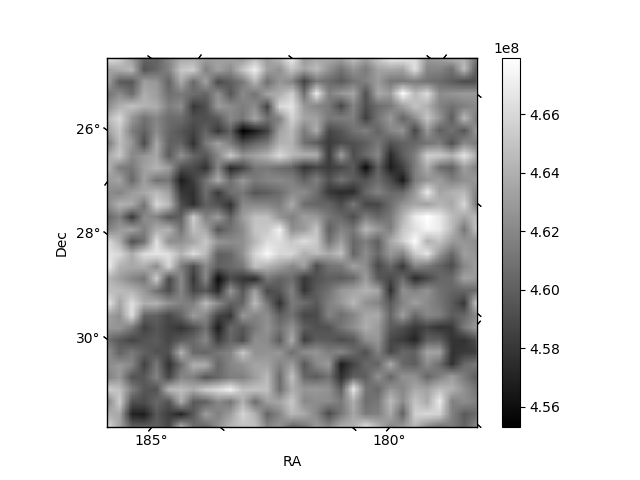
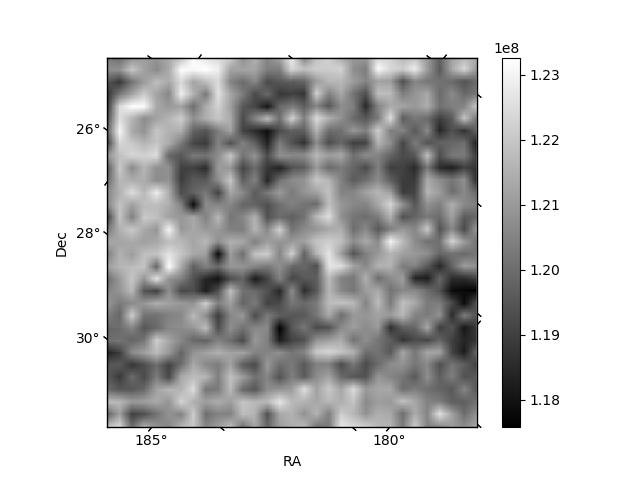
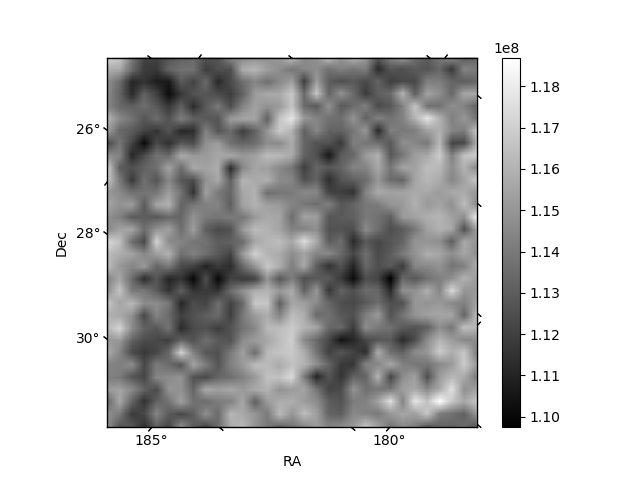
Histogram calculated using DETX and DETY for each event in the final _common_clean file
| Quadrant A | 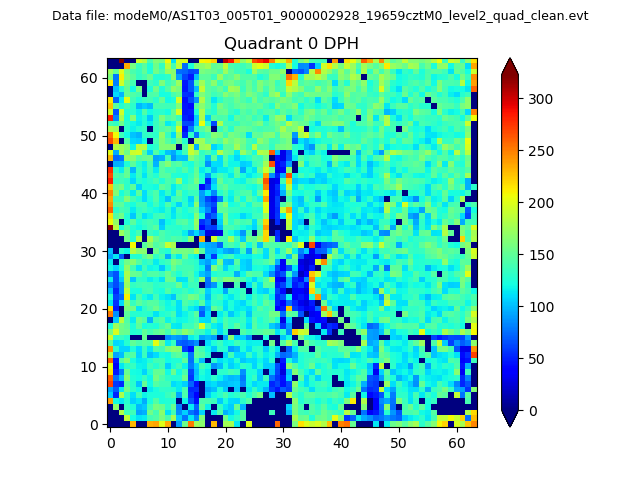 |
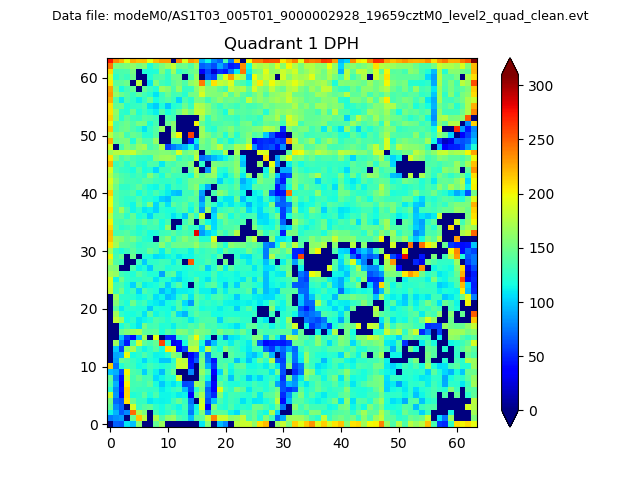 |
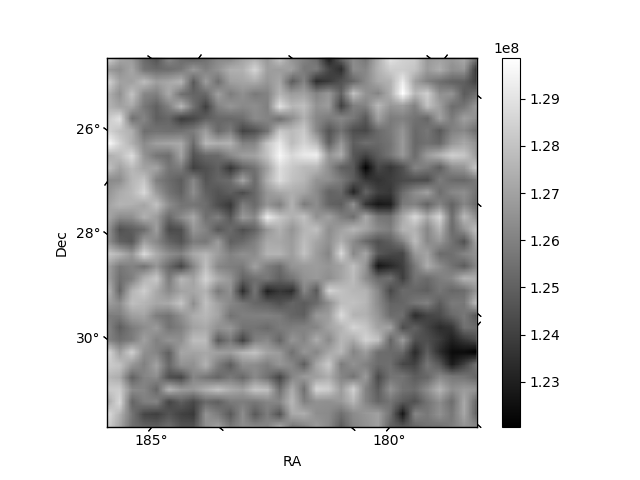
Quadrant B |
|---|---|---|---|
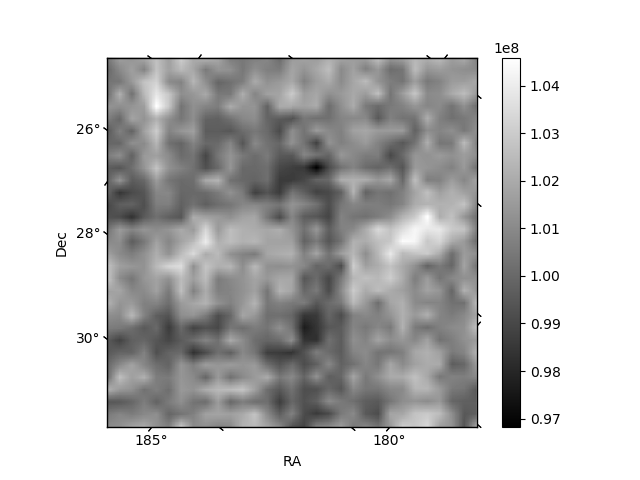
| Quadrant D | 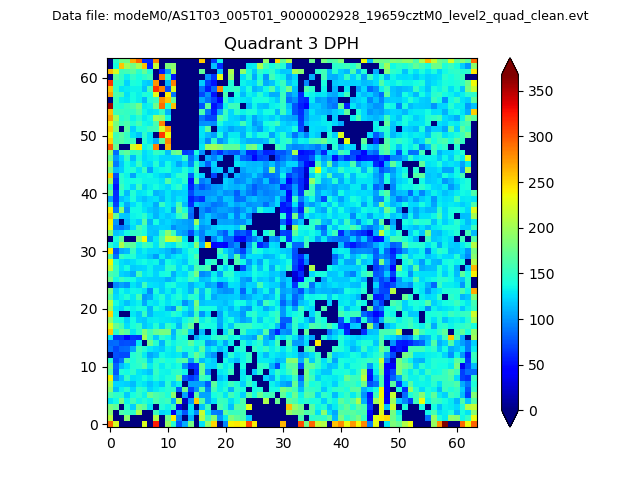 |
 |
Quadrant C |
| Plot type | Count rate plots | Images |
|---|---|---|
| Comparison with Poisson distribution Blue bars denote a histogram of data divided into 1 sec bins. Red curve is a Poisson curve with rate = median count rate of data. |
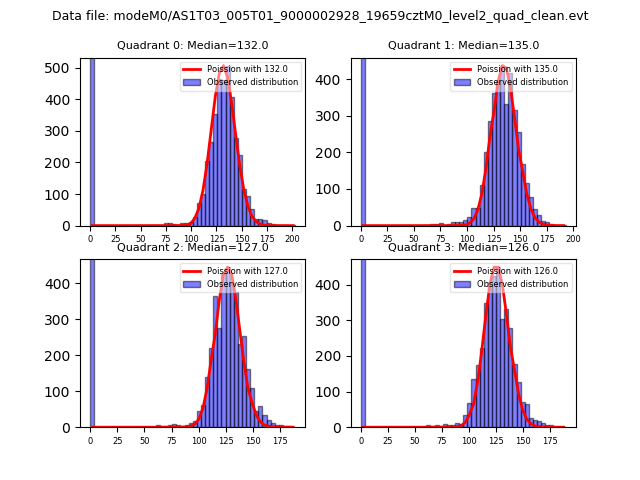 |
 |
| Quadrant-wise count rates Data is divided into 100 sec bins |
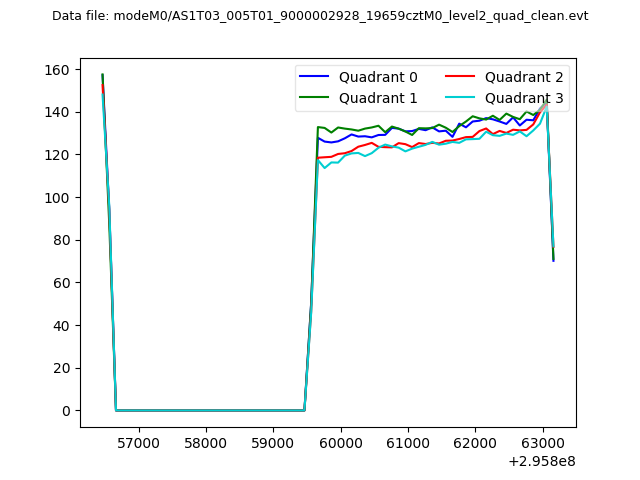 |
|
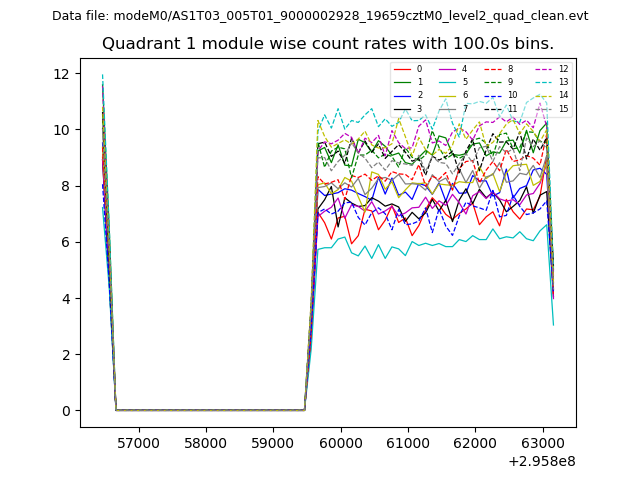
| Module-wise count rates for Quadrant A Data is divided into 100 sec bins |
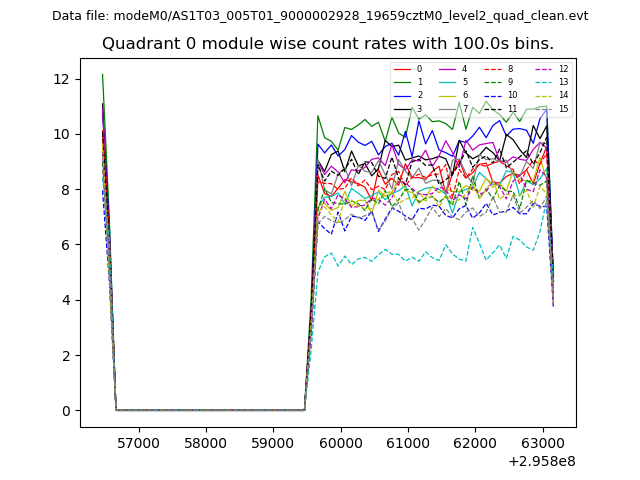 |
 |
| Module-wise count rates for Quadrant B Data is divided into 100 sec bins |
 |
 |
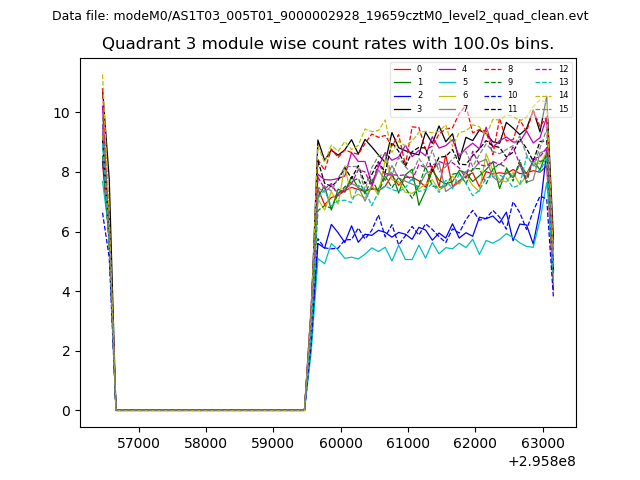
| Module-wise count rates for Quadrant C Data is divided into 100 sec bins |
 |
 |
| Module-wise count rates for Quadrant D Data is divided into 100 sec bins |
 |
 |
| Parameter | Plot |
|---|---|
| CZT HV Monitor | 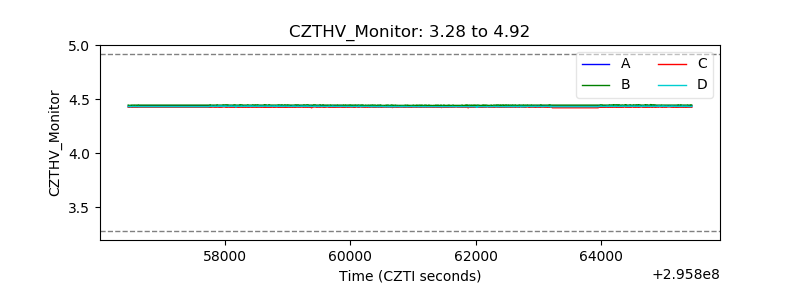 |
| D_VDD | 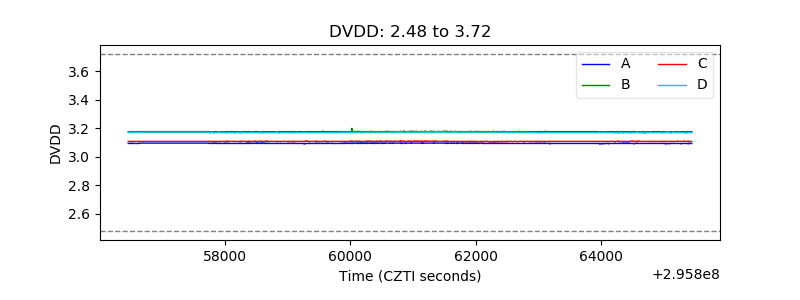 |
| Temperature 1 | 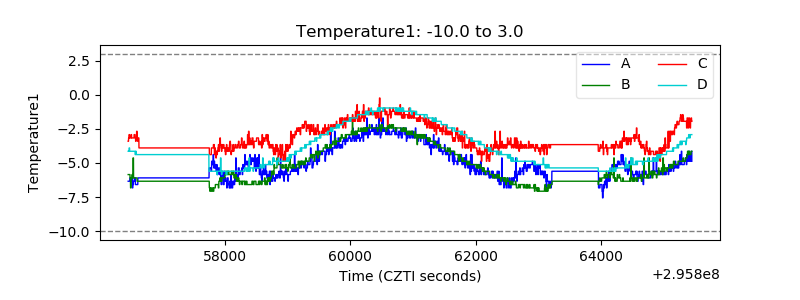 |
| Veto HV Monitor | 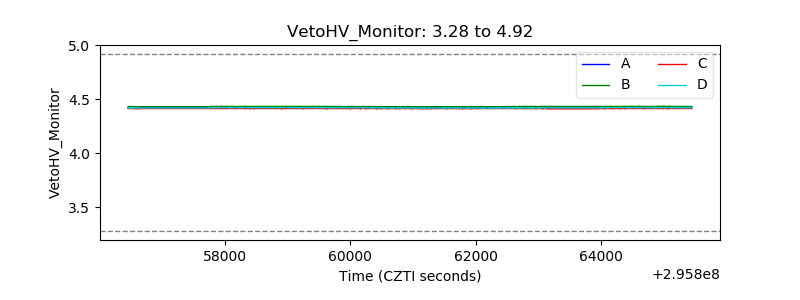 |
| Veto LLD | 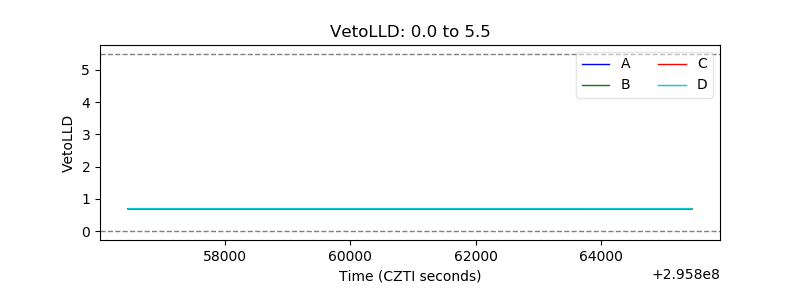 |
| Alpha Counter | 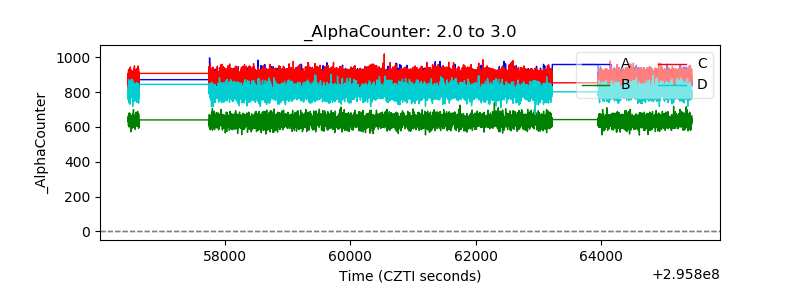 |
| _CPM_Rate | 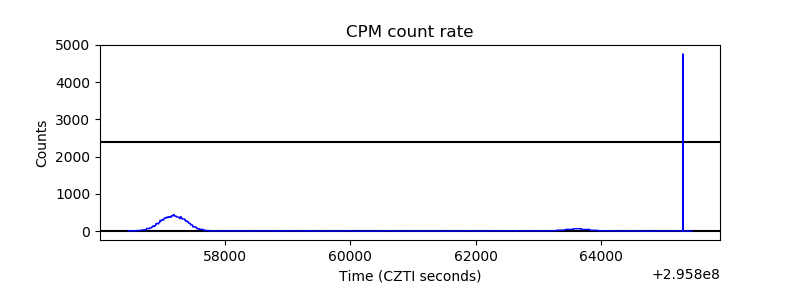 |
| CZT Counter | 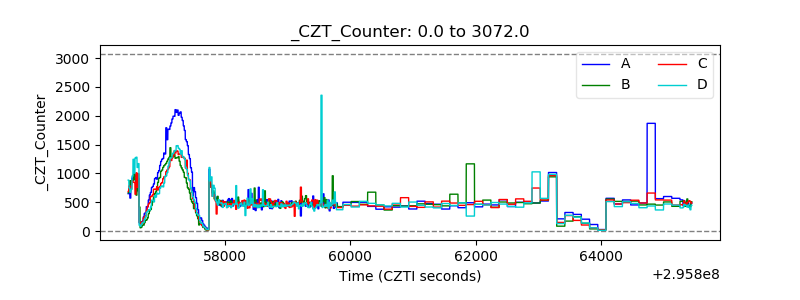 |
| +2.5 Volts monitor |  |
| +5 Volts monitor |  |
| _ROLL_ROT | 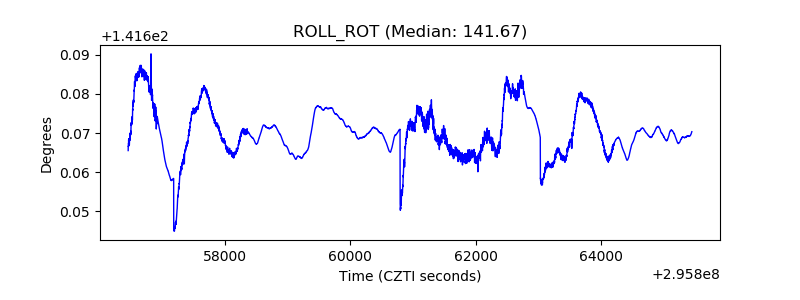 |
| _Roll_DEC | 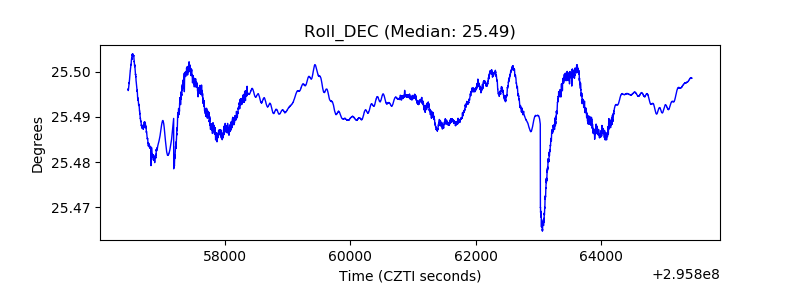 |
| _Roll_RA | 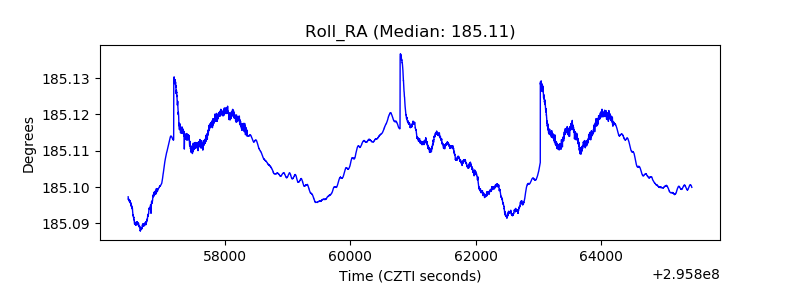 |
| Veto Counter | 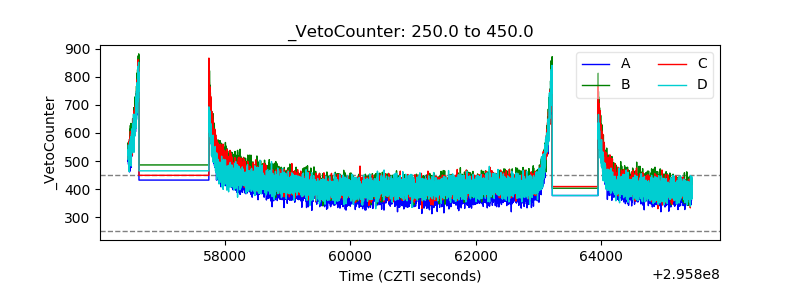 |