| Param | Original file | Final file |
|---|---|---|
| Filename | modeM0/AS1T03_005T01_9000002928_19660cztM0_level2.evt | modeM0/AS1T03_005T01_9000002928_19660cztM0_level2_quad_clean.evt |
| Size (bytes) | 516,597,120 | 87,647,040 |
| Size | 492.7 MB | 83.6 MB |
| Events in quadrant A | 3,781,920 | 539,165 |
| Events in quadrant B | 3,818,041 | 545,980 |
| Events in quadrant C | 3,749,679 | 516,294 |
| Events in quadrant D | 3,764,585 | 509,653 |
| Mode SS | |||
|---|---|---|---|
| Quadrant | BADHDUFLAG | Total packets | Discarded packets |
| A | 0 | 162 | 0 |
| B | 0 | 162 | 0 |
| C | 0 | 162 | 0 |
| D | 0 | 162 | 0 |
| Mode M9 | |||
|---|---|---|---|
| Quadrant | BADHDUFLAG | Total packets | Discarded packets |
| A | 0 | 8 | 0 |
| B | 0 | 9 | 0 |
| C | 0 | 9 | 0 |
| D | 0 | 9 | 0 |
| Mode M0 | |||
|---|---|---|---|
| Quadrant | BADHDUFLAG | Total packets | Discarded packets |
| A | 0 | 16336 | 3 |
| B | 0 | 16336 | 3 |
| C | 0 | 16195 | 3 |
| D | 0 | 16589 | 3 |
| Quadrant | Total seconds | Saturated seconds | Saturation percentage |
|---|---|---|---|
| A | 7810 | 256 | 3.277849% |
| B | 7810 | 299 | 3.828425% |
| C | 7810 | 288 | 3.687580% |
| D | 7810 | 208 | 2.663252% |
Noise dominated data is calculated using 1-second bins in cleaned event files. If a bin has >2000 counts, and if more than 50% of those come from <1% of pixels, then it is considered to be noise-dominated and hence unusable.
| Quadrant | # 1 sec bins | Bins with >0 counts | Bins with >2000 counts | High rate bins dominated by noise | Noise dominated (total time) | Noise dominated (detector-on time) | Marked lightcurve |
|---|---|---|---|---|---|---|---|
| A | 7975 | 7810 | 3 | 3 | 0.04% | 0.04% | 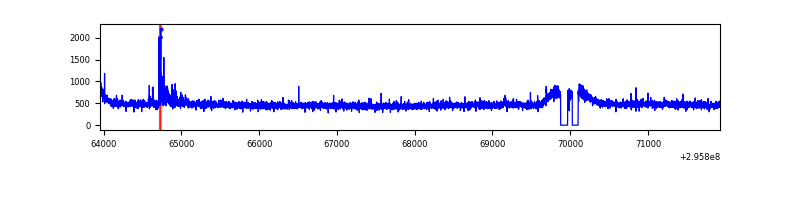 |
| B | 7975 | 7810 | 10 | 10 | 0.13% | 0.13% | 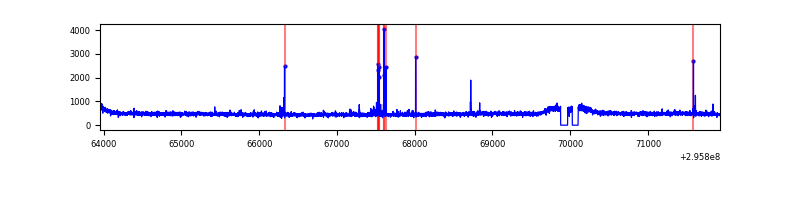 |
| C | 7975 | 7811 | 0 | 0 | 0.00% | 0.00% | 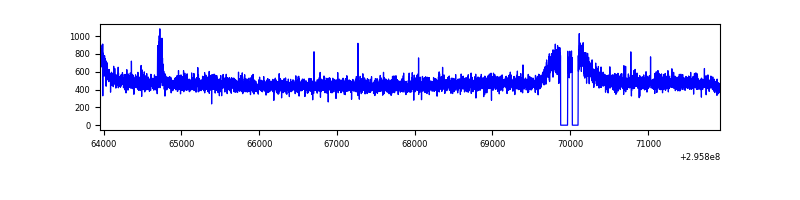 |
| D | 7975 | 7811 | 7 | 7 | 0.09% | 0.09% | 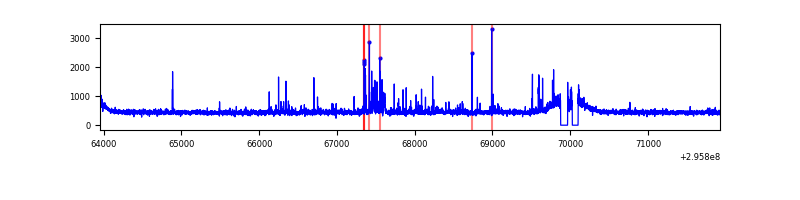 |
Top three noisy pixels from each quadrant. If the there are fewer than three noisy pixels in the level2.evt file, extra rows are filled as -1
| Pixel properties | Quadrant properties | ||||||
|---|---|---|---|---|---|---|---|
| Quadrant | DetID | PixID | Counts | Sigma | Mean | Median | Sigma |
| A | 13 | 252 | 61438 | 311.64 | 958 | 938 | 194.1 |
| A | 11 | 29 | 20989 | 103.28 | 958 | 938 | 194.1 |
| A | 9 | 143 | 11400 | 53.89 | 958 | 938 | 194.1 |
| B | 7 | 220 | 41929 | 222.83 | 952 | 926 | 184.0 |
| B | 12 | 111 | 22932 | 119.59 | 952 | 926 | 184.0 |
| B | 0 | 198 | 21143 | 109.87 | 952 | 926 | 184.0 |
| C | 14 | 238 | 143363 | 665.26 | 914 | 919 | 214.1 |
| C | 3 | 233 | 33685 | 153.03 | 914 | 919 | 214.1 |
| C | 9 | 221 | 9631 | 40.69 | 914 | 919 | 214.1 |
| D | 1 | 52 | 154765 | 676.99 | 929 | 899 | 227.3 |
| D | 13 | 104 | 47406 | 204.62 | 929 | 899 | 227.3 |
| D | 2 | 234 | 28941 | 123.38 | 929 | 899 | 227.3 |
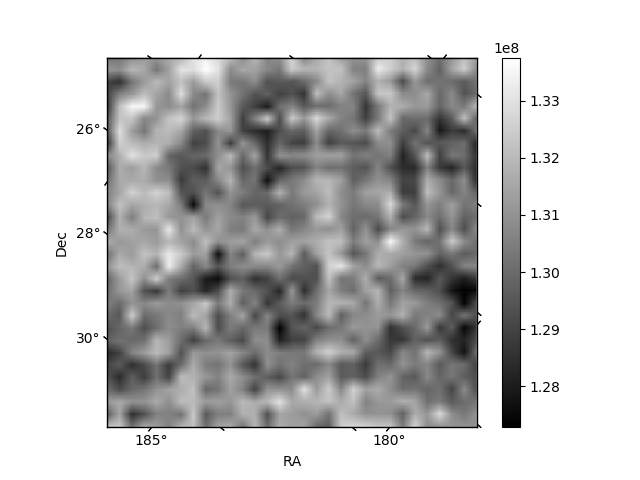
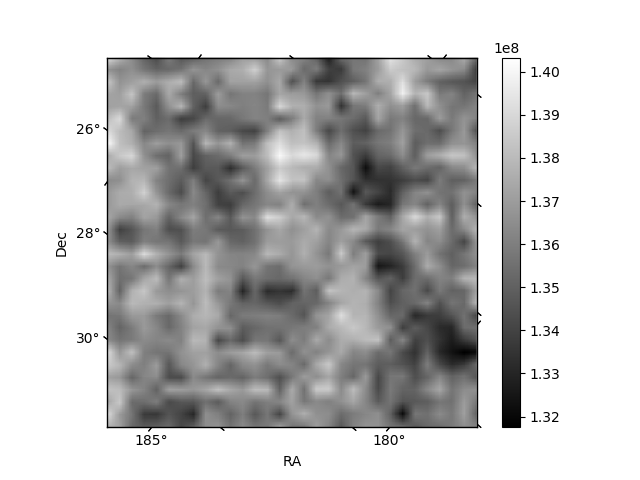
Histogram calculated using DETX and DETY for each event in the final _common_clean file
| Quadrant A |  |
 |
Quadrant B |
|---|---|---|---|
| Quadrant D |  |
 |
Quadrant C |
| Plot type | Count rate plots | Images |
|---|---|---|
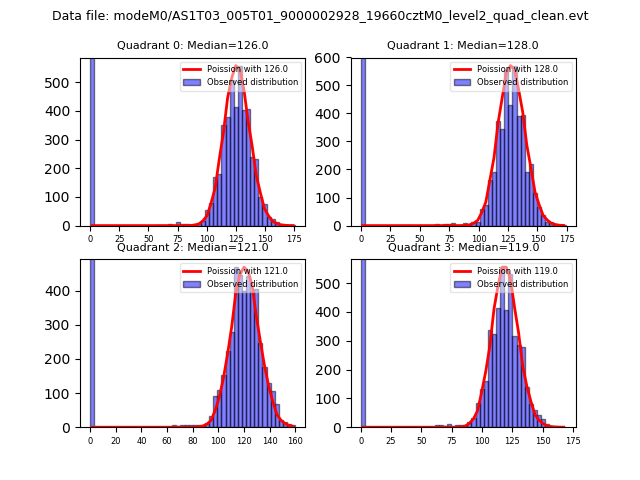
| Comparison with Poisson distribution Blue bars denote a histogram of data divided into 1 sec bins. Red curve is a Poisson curve with rate = median count rate of data. |
 |
 |
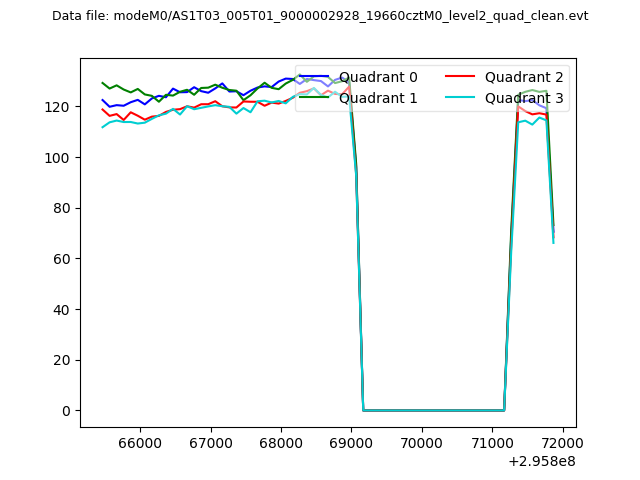
| Quadrant-wise count rates Data is divided into 100 sec bins |
 |
|
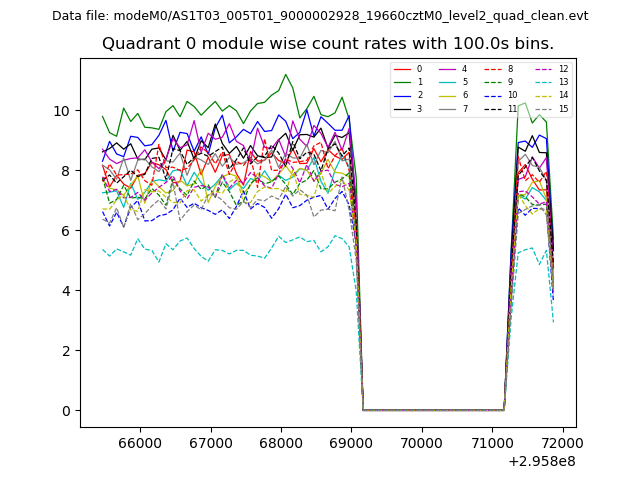
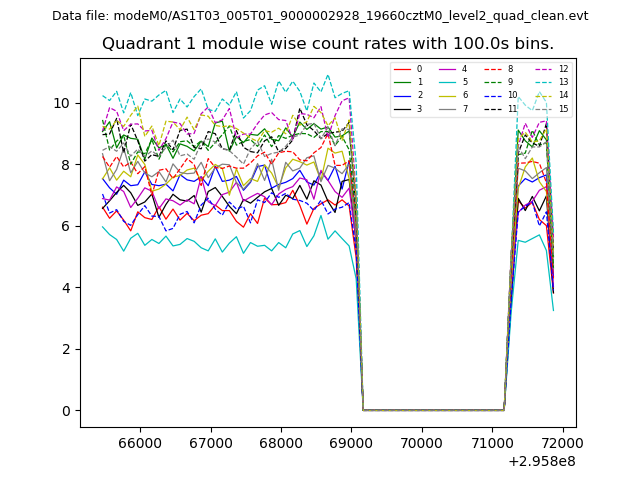
| Module-wise count rates for Quadrant A Data is divided into 100 sec bins |
 |
 |
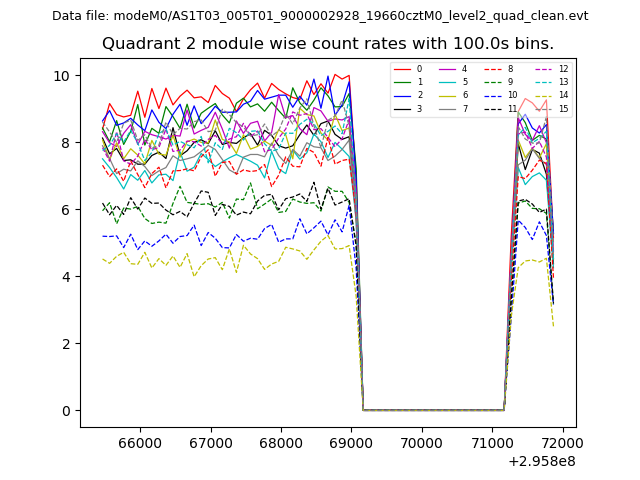
| Module-wise count rates for Quadrant B Data is divided into 100 sec bins |
 |
 |
| Module-wise count rates for Quadrant C Data is divided into 100 sec bins |
 |
 |
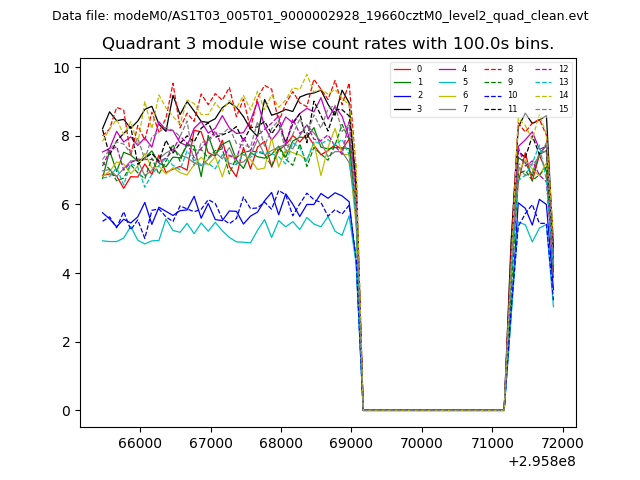
| Module-wise count rates for Quadrant D Data is divided into 100 sec bins |
 |
 |
| Parameter | Plot |
|---|---|
| CZT HV Monitor | 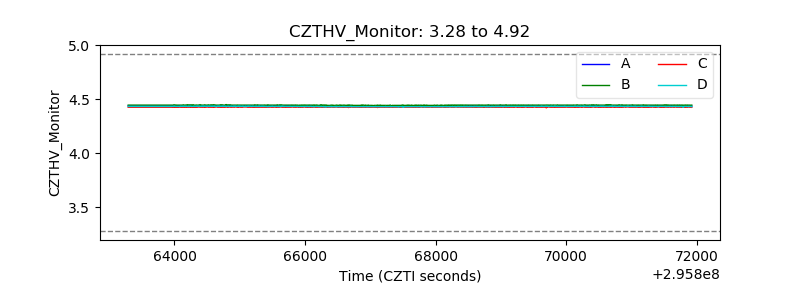 |
| D_VDD | 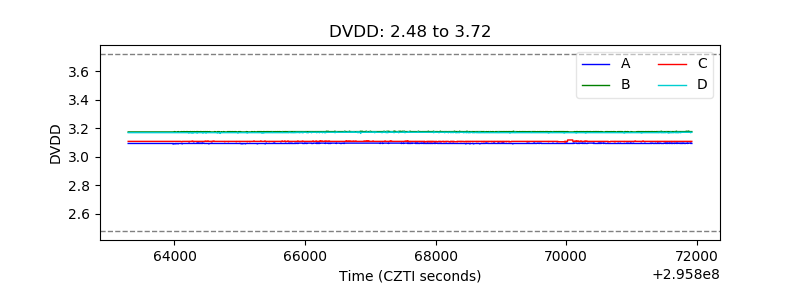 |
| Temperature 1 | 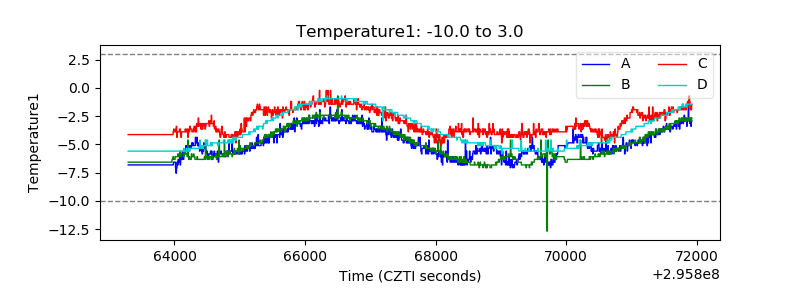 |
| Veto HV Monitor | 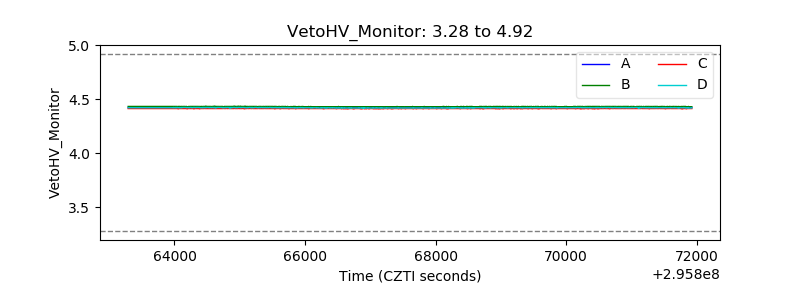 |
| Veto LLD | 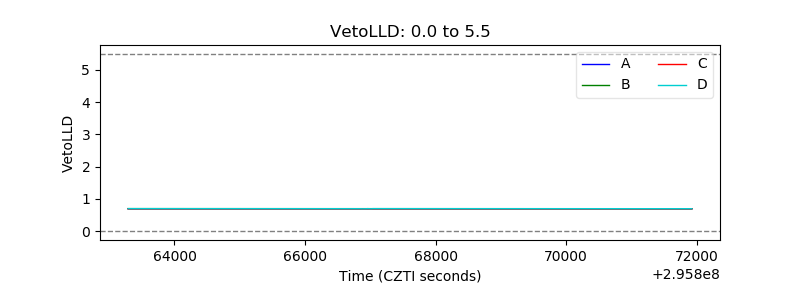 |
| Alpha Counter | 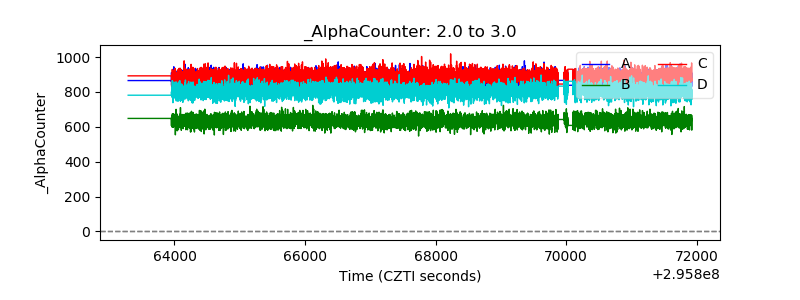 |
| _CPM_Rate | 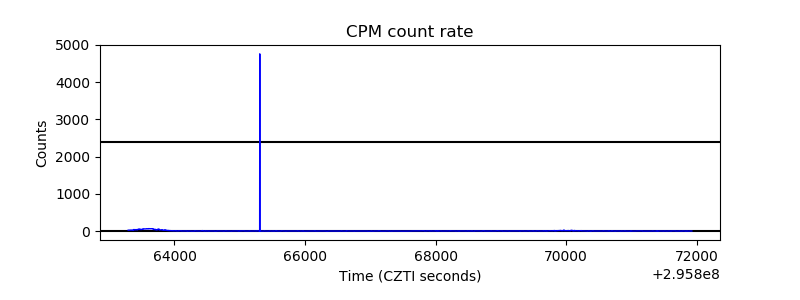 |
| CZT Counter | 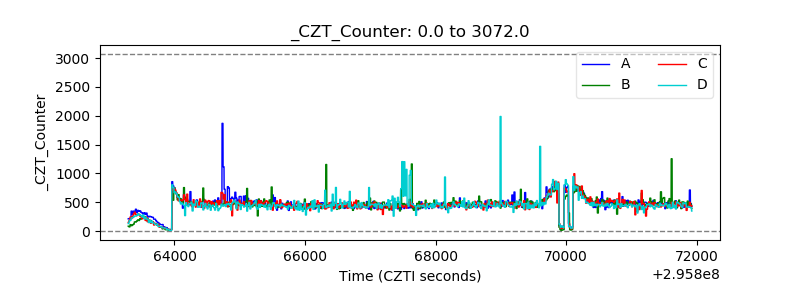 |
| +2.5 Volts monitor |  |
| +5 Volts monitor | 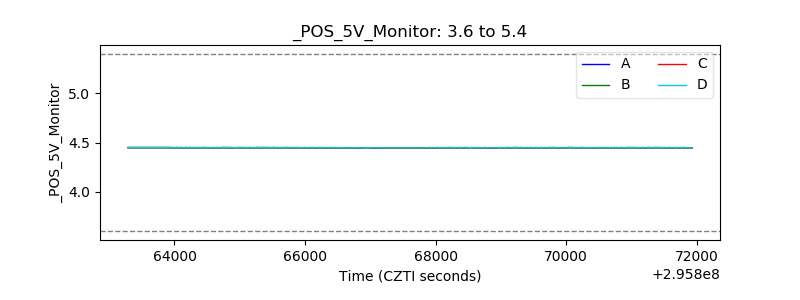 |
| _ROLL_ROT | 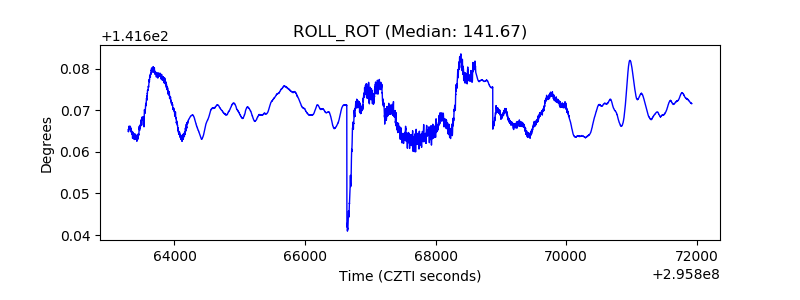 |
| _Roll_DEC | 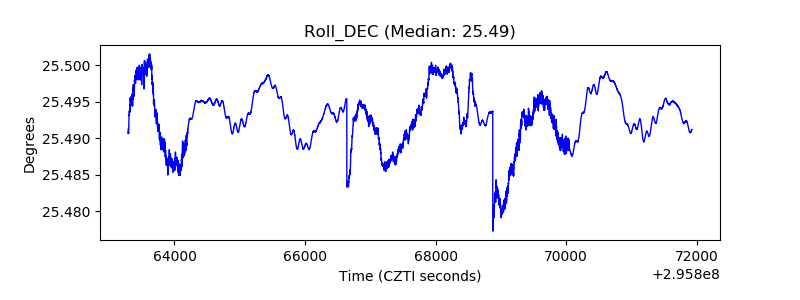 |
| _Roll_RA | 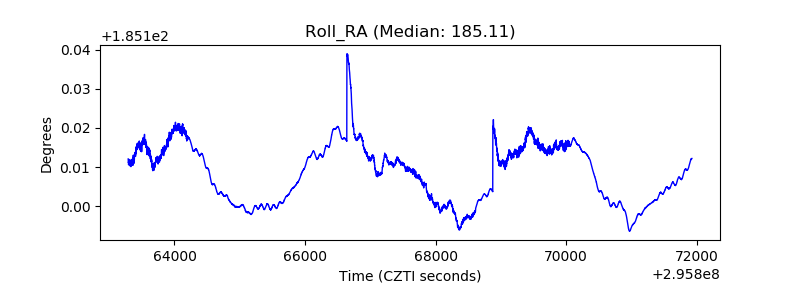 |
| Veto Counter | 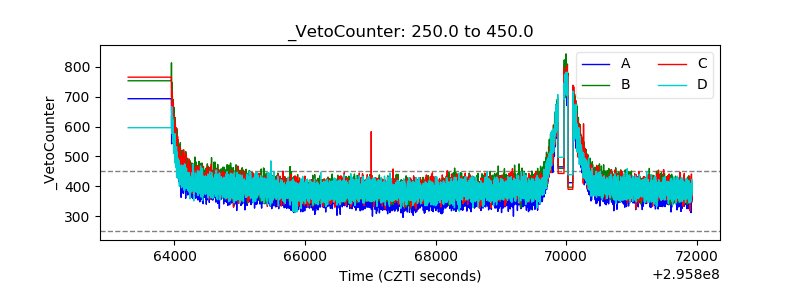 |