| Param | Original file | Final file |
|---|---|---|
| Filename | modeM0/AS1T03_005T01_9000002928_19662cztM0_level2.evt | modeM0/AS1T03_005T01_9000002928_19662cztM0_level2_quad_clean.evt |
| Size (bytes) | 833,512,320 | 167,699,520 |
| Size | 794.9 MB | 159.9 MB |
| Events in quadrant A | 6,016,543 | 1,070,078 |
| Events in quadrant B | 6,221,221 | 1,084,983 |
| Events in quadrant C | 6,045,869 | 1,030,505 |
| Events in quadrant D | 6,097,143 | 1,014,573 |
| Mode SS | |||
|---|---|---|---|
| Quadrant | BADHDUFLAG | Total packets | Discarded packets |
| A | 0 | 256 | 0 |
| B | 0 | 256 | 0 |
| C | 0 | 256 | 0 |
| D | 0 | 256 | 0 |
| Mode M9 | |||
|---|---|---|---|
| Quadrant | BADHDUFLAG | Total packets | Discarded packets |
| A | 0 | 4 | 0 |
| B | 0 | 4 | 0 |
| C | 0 | 4 | 0 |
| D | 0 | 4 | 0 |
| Mode M0 | |||
|---|---|---|---|
| Quadrant | BADHDUFLAG | Total packets | Discarded packets |
| A | 0 | 26406 | 2 |
| B | 0 | 26805 | 2 |
| C | 0 | 26253 | 2 |
| D | 0 | 26981 | 2 |
| Quadrant | Total seconds | Saturated seconds | Saturation percentage |
|---|---|---|---|
| A | 12720 | 293 | 2.303459% |
| B | 12719 | 325 | 2.555232% |
| C | 12720 | 326 | 2.562893% |
| D | 12720 | 246 | 1.933962% |
Noise dominated data is calculated using 1-second bins in cleaned event files. If a bin has >2000 counts, and if more than 50% of those come from <1% of pixels, then it is considered to be noise-dominated and hence unusable.
| Quadrant | # 1 sec bins | Bins with >0 counts | Bins with >2000 counts | High rate bins dominated by noise | Noise dominated (total time) | Noise dominated (detector-on time) | Marked lightcurve |
|---|---|---|---|---|---|---|---|
| A | 13075 | 12720 | 3 | 3 | 0.02% | 0.02% | 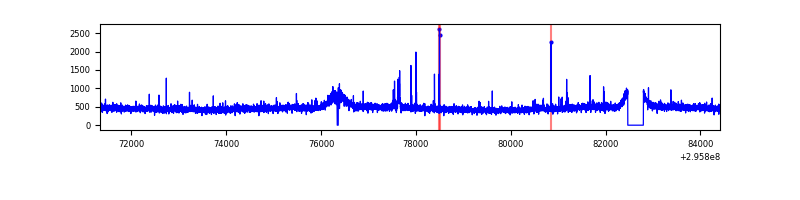 |
| B | 13074 | 12721 | 24 | 24 | 0.18% | 0.19% | 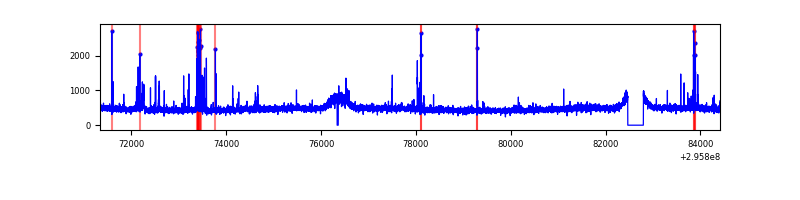 |
| C | 13075 | 12721 | 0 | 0 | 0.00% | 0.00% | 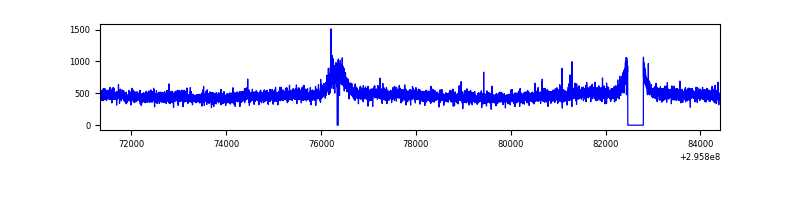 |
| D | 13075 | 12720 | 62 | 62 | 0.47% | 0.49% | 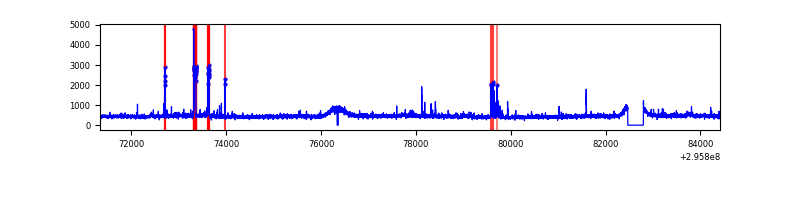 |
Top three noisy pixels from each quadrant. If the there are fewer than three noisy pixels in the level2.evt file, extra rows are filled as -1
| Pixel properties | Quadrant properties | ||||||
|---|---|---|---|---|---|---|---|
| Quadrant | DetID | PixID | Counts | Sigma | Mean | Median | Sigma |
| A | 13 | 252 | 56947 | 179.86 | 1532 | 1501 | 308.3 |
| A | 11 | 29 | 37224 | 115.88 | 1532 | 1501 | 308.3 |
| A | 9 | 143 | 29125 | 89.61 | 1532 | 1501 | 308.3 |
| B | 7 | 220 | 118394 | 398.79 | 1521 | 1478 | 293.2 |
| B | 10 | 247 | 41222 | 135.56 | 1521 | 1478 | 293.2 |
| B | 12 | 111 | 36299 | 118.77 | 1521 | 1478 | 293.2 |
| C | 14 | 238 | 226354 | 651.11 | 1466 | 1474 | 345.4 |
| C | 3 | 233 | 41651 | 116.33 | 1466 | 1474 | 345.4 |
| C | 9 | 221 | 40376 | 112.64 | 1466 | 1474 | 345.4 |
| D | 1 | 52 | 184983 | 508.89 | 1487 | 1445 | 360.7 |
| D | 1 | 20 | 128306 | 351.74 | 1487 | 1445 | 360.7 |
| D | 2 | 16 | 102417 | 279.96 | 1487 | 1445 | 360.7 |
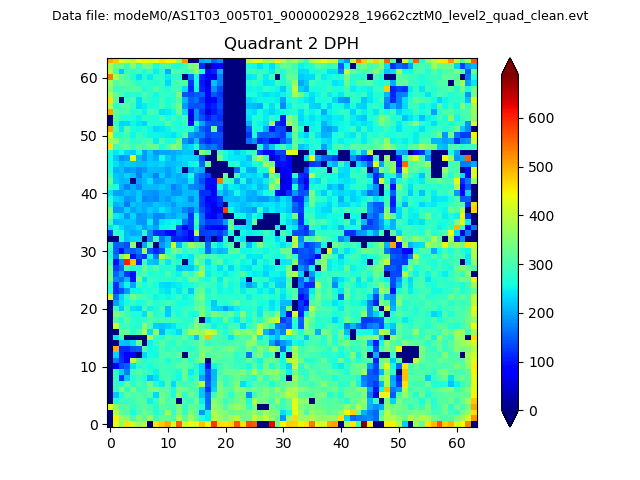
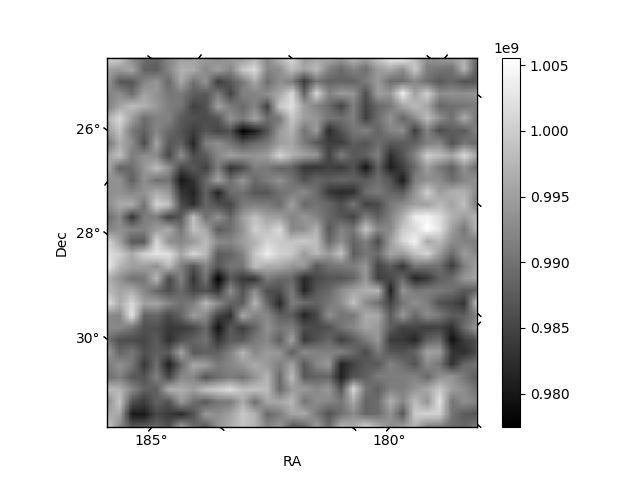
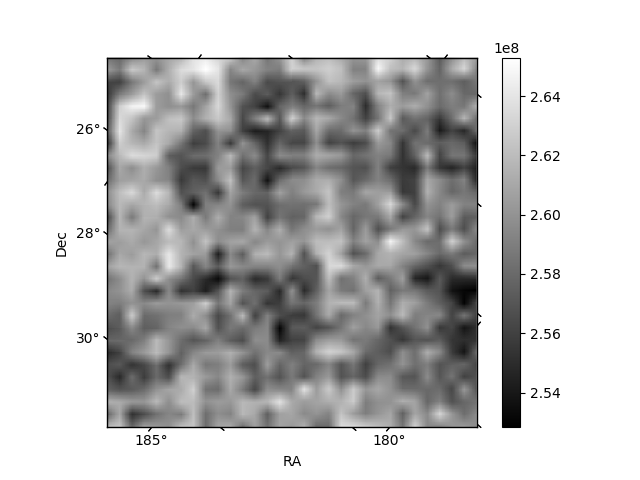
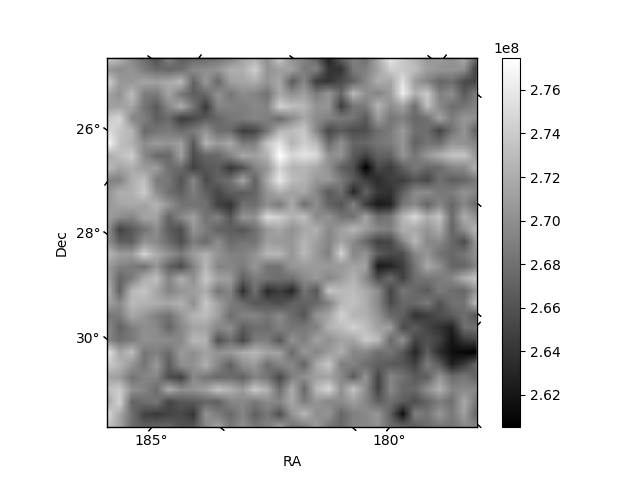
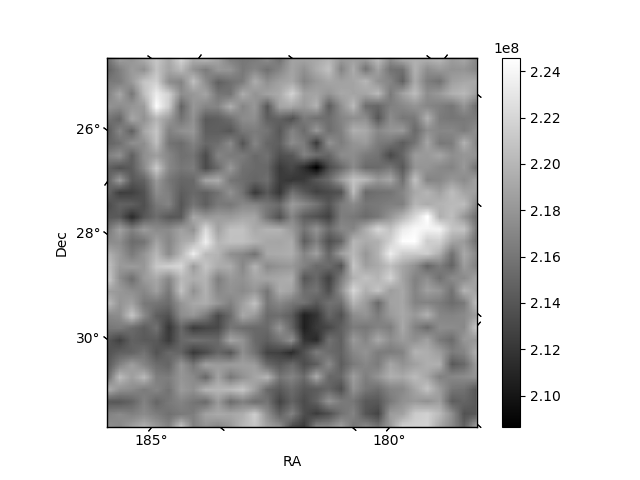
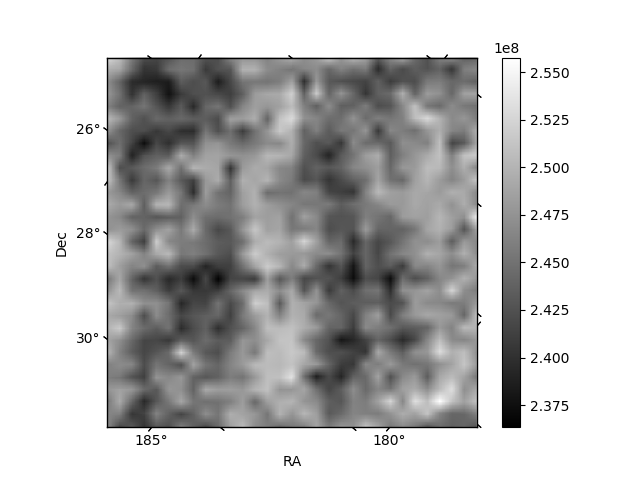
Histogram calculated using DETX and DETY for each event in the final _common_clean file
| Quadrant A | 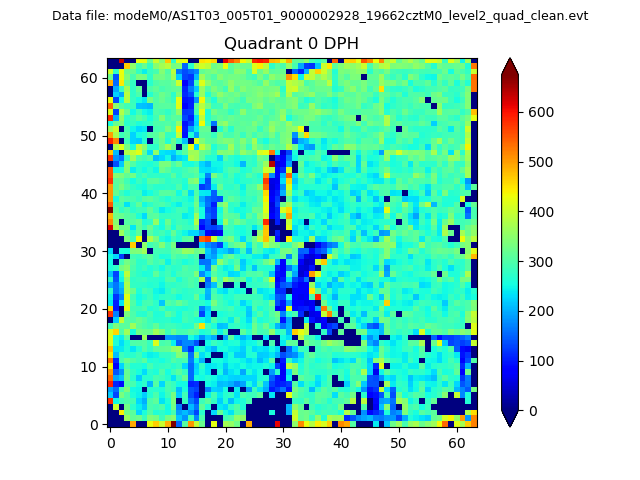 |
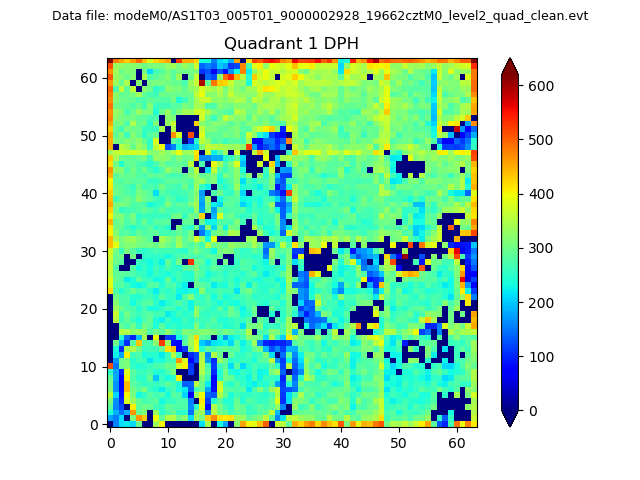 |
Quadrant B |
|---|---|---|---|
| Quadrant D | 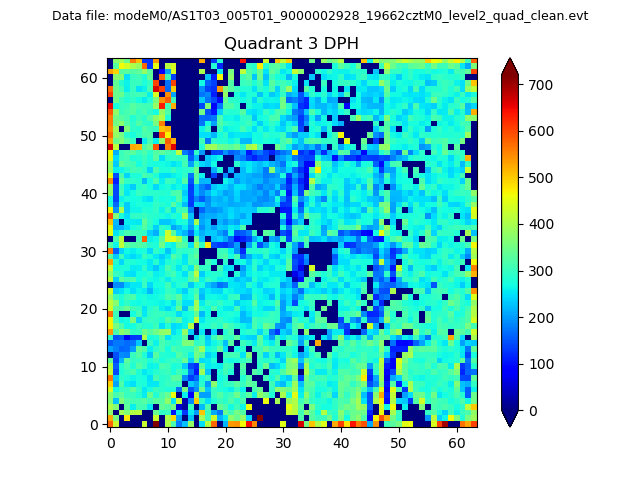 |
 |
Quadrant C |
| Plot type | Count rate plots | Images |
|---|---|---|
| Comparison with Poisson distribution Blue bars denote a histogram of data divided into 1 sec bins. Red curve is a Poisson curve with rate = median count rate of data. |
 |
 |
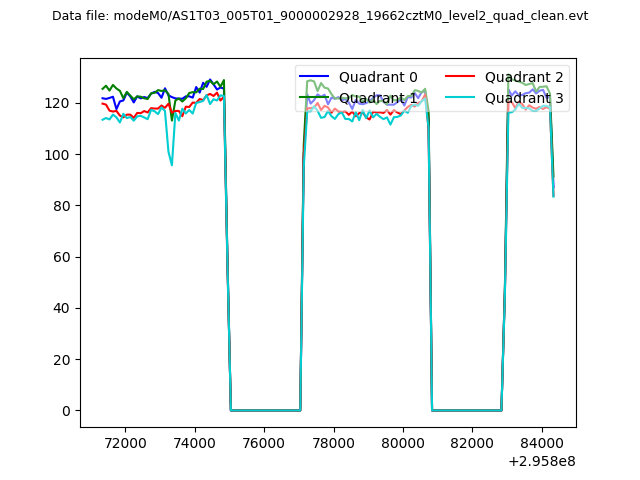
| Quadrant-wise count rates Data is divided into 100 sec bins |
 |
|
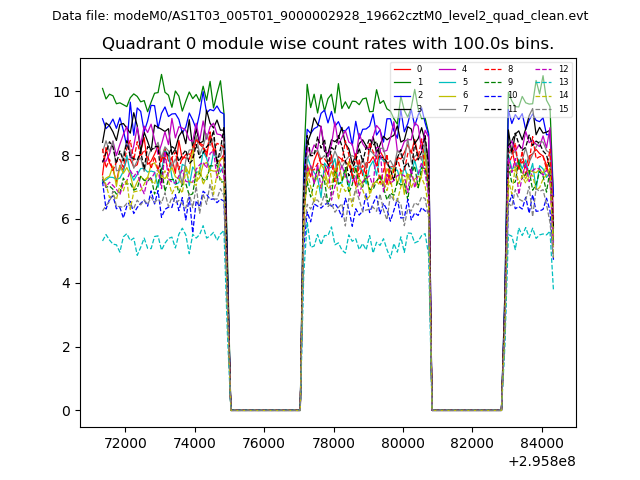
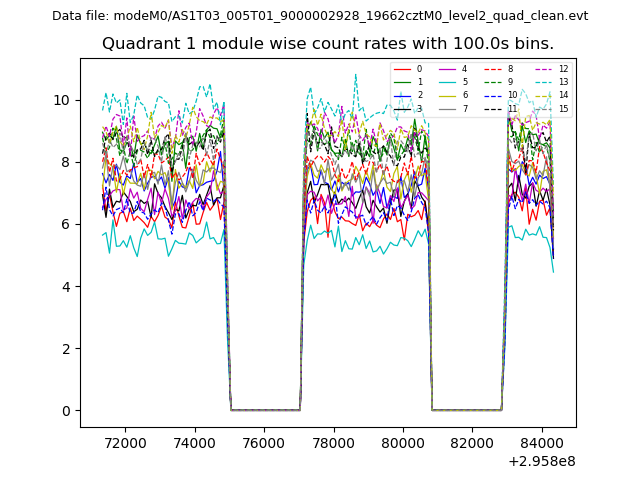
| Module-wise count rates for Quadrant A Data is divided into 100 sec bins |
 |
 |
| Module-wise count rates for Quadrant B Data is divided into 100 sec bins |
 |
 |
| Module-wise count rates for Quadrant C Data is divided into 100 sec bins |
 |
 |
| Module-wise count rates for Quadrant D Data is divided into 100 sec bins |
 |
 |
| Parameter | Plot |
|---|---|
| CZT HV Monitor |  |
| D_VDD | 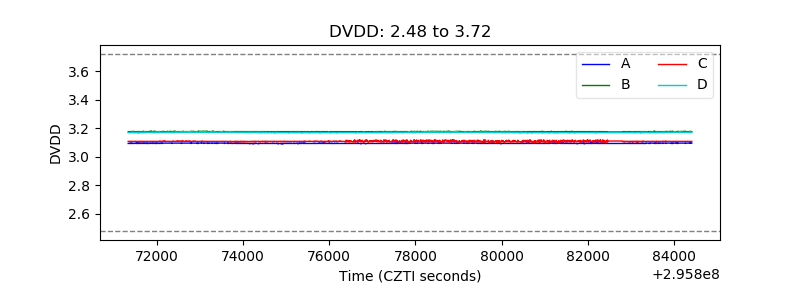 |
| Temperature 1 | 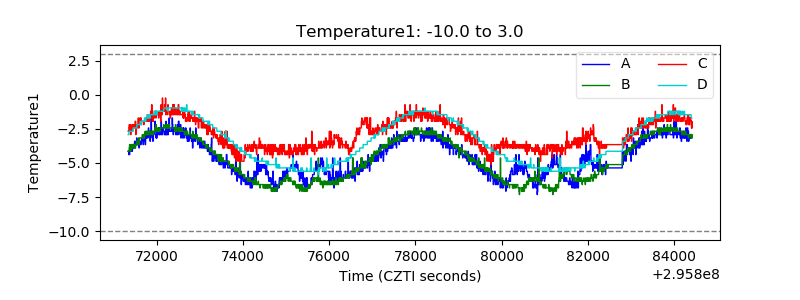 |
| Veto HV Monitor | 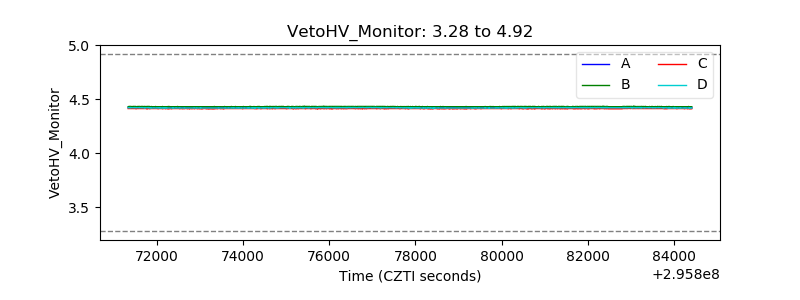 |
| Veto LLD | 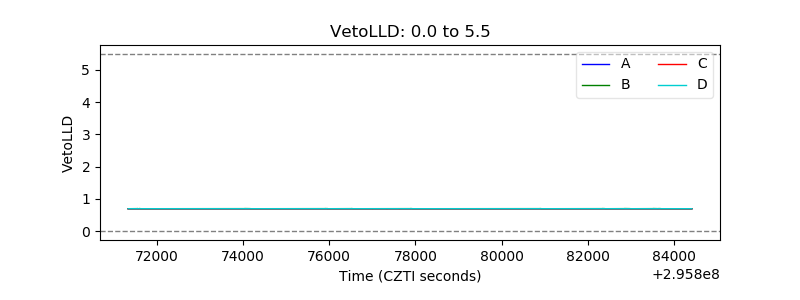 |
| Alpha Counter | 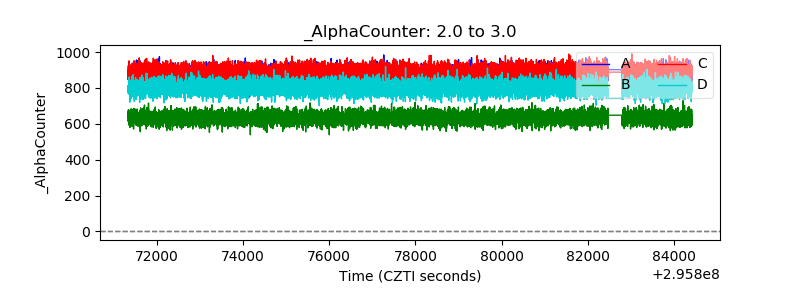 |
| _CPM_Rate | 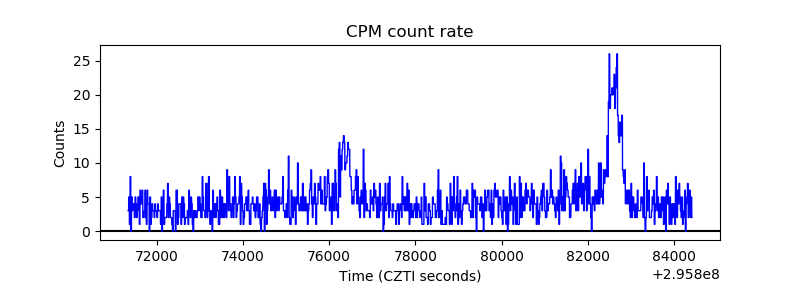 |
| CZT Counter | 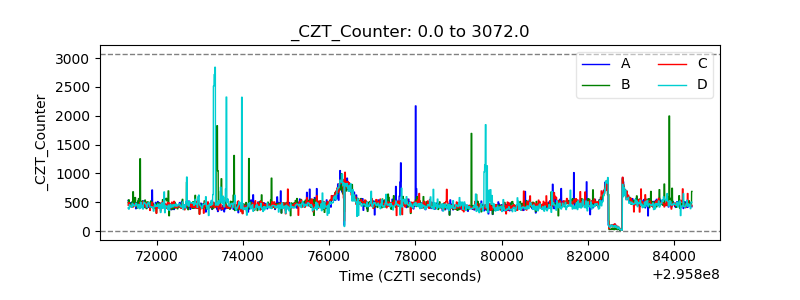 |
| +2.5 Volts monitor |  |
| +5 Volts monitor |  |
| _ROLL_ROT |  |
| _Roll_DEC | 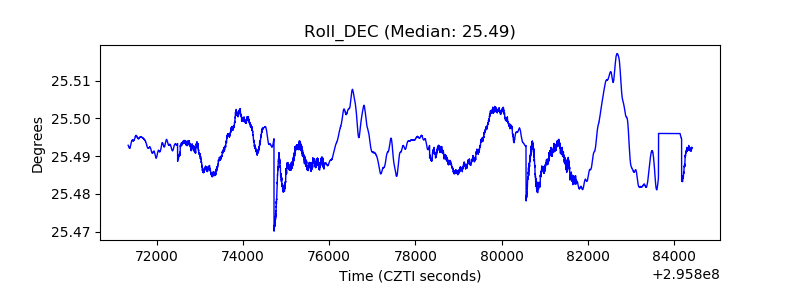 |
| _Roll_RA | 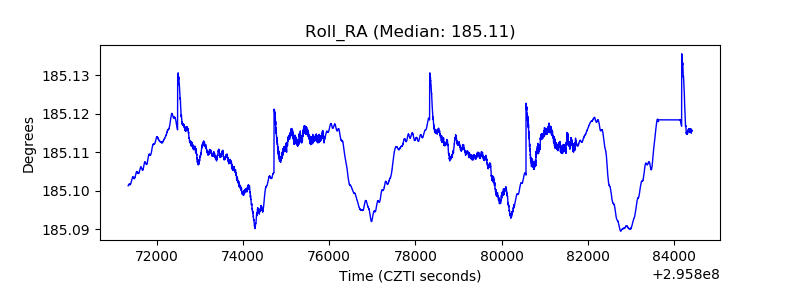 |
| Veto Counter |  |