| Param | Original file | Final file |
|---|---|---|
| Filename | modeM0/AS1T03_005T01_9000002928_19664cztM0_level2.evt | modeM0/AS1T03_005T01_9000002928_19664cztM0_level2_quad_clean.evt |
| Size (bytes) | 824,590,080 | 165,150,720 |
| Size | 786.4 MB | 157.5 MB |
| Events in quadrant A | 5,897,510 | 1,048,090 |
| Events in quadrant B | 6,220,975 | 1,057,191 |
| Events in quadrant C | 6,006,082 | 1,010,782 |
| Events in quadrant D | 5,982,880 | 1,003,379 |
| Mode SS | |||
|---|---|---|---|
| Quadrant | BADHDUFLAG | Total packets | Discarded packets |
| A | 0 | 262 | 0 |
| B | 0 | 260 | 0 |
| C | 0 | 260 | 0 |
| D | 0 | 260 | 0 |
| Mode M9 | |||
|---|---|---|---|
| Quadrant | BADHDUFLAG | Total packets | Discarded packets |
| A | 0 | 12 | 0 |
| B | 0 | 12 | 0 |
| C | 0 | 12 | 0 |
| D | 0 | 12 | 0 |
| Mode M0 | |||
|---|---|---|---|
| Quadrant | BADHDUFLAG | Total packets | Discarded packets |
| A | 0 | 26137 | 3 |
| B | 0 | 26853 | 4 |
| C | 0 | 26124 | 3 |
| D | 0 | 26711 | 3 |
| Quadrant | Total seconds | Saturated seconds | Saturation percentage |
|---|---|---|---|
| A | 12765 | 123 | 0.963572% |
| B | 12765 | 173 | 1.355268% |
| C | 12765 | 171 | 1.339600% |
| D | 12765 | 79 | 0.618880% |
Noise dominated data is calculated using 1-second bins in cleaned event files. If a bin has >2000 counts, and if more than 50% of those come from <1% of pixels, then it is considered to be noise-dominated and hence unusable.
| Quadrant | # 1 sec bins | Bins with >0 counts | Bins with >2000 counts | High rate bins dominated by noise | Noise dominated (total time) | Noise dominated (detector-on time) | Marked lightcurve |
|---|---|---|---|---|---|---|---|
| A | 14005 | 12765 | 0 | 0 | 0.00% | 0.00% | 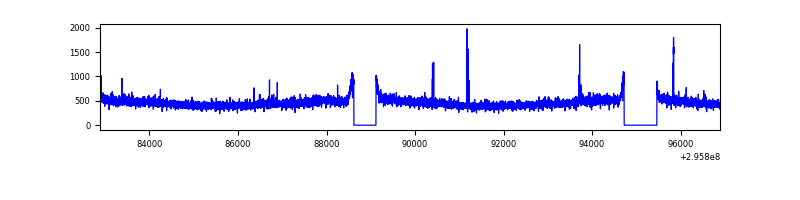 |
| B | 14005 | 12765 | 40 | 40 | 0.29% | 0.31% | 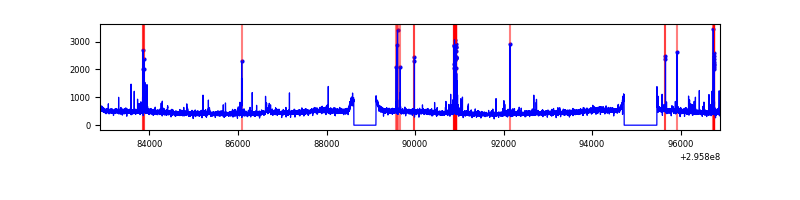 |
| C | 14005 | 12765 | 0 | 0 | 0.00% | 0.00% | 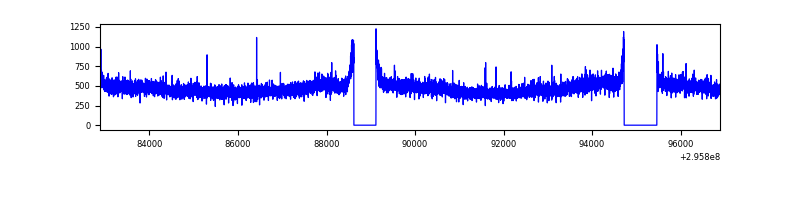 |
| D | 14005 | 12766 | 3 | 3 | 0.02% | 0.02% | 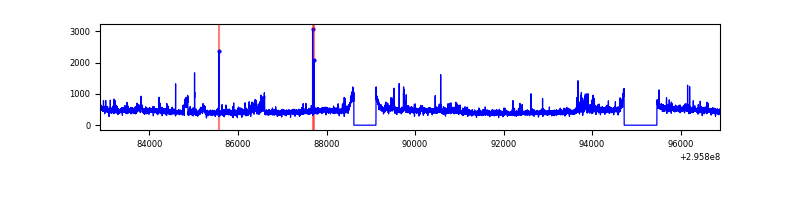 |
Top three noisy pixels from each quadrant. If the there are fewer than three noisy pixels in the level2.evt file, extra rows are filled as -1
| Pixel properties | Quadrant properties | ||||||
|---|---|---|---|---|---|---|---|
| Quadrant | DetID | PixID | Counts | Sigma | Mean | Median | Sigma |
| A | 11 | 29 | 33591 | 105.29 | 1510 | 1477 | 305.0 |
| A | 9 | 143 | 18282 | 55.1 | 1510 | 1477 | 305.0 |
| A | 4 | 2 | 18255 | 55.01 | 1510 | 1477 | 305.0 |
| B | 7 | 220 | 172884 | 591.66 | 1505 | 1462 | 289.7 |
| B | 0 | 198 | 51715 | 173.45 | 1505 | 1462 | 289.7 |
| B | 12 | 111 | 35188 | 116.4 | 1505 | 1462 | 289.7 |
| C | 14 | 238 | 225942 | 656.97 | 1453 | 1459 | 341.7 |
| C | 3 | 233 | 76491 | 219.59 | 1453 | 1459 | 341.7 |
| C | 9 | 221 | 18868 | 50.95 | 1453 | 1459 | 341.7 |
| D | 2 | 16 | 143426 | 395.2 | 1478 | 1438 | 359.3 |
| D | 1 | 20 | 105153 | 288.67 | 1478 | 1438 | 359.3 |
| D | 1 | 52 | 97218 | 266.59 | 1478 | 1438 | 359.3 |
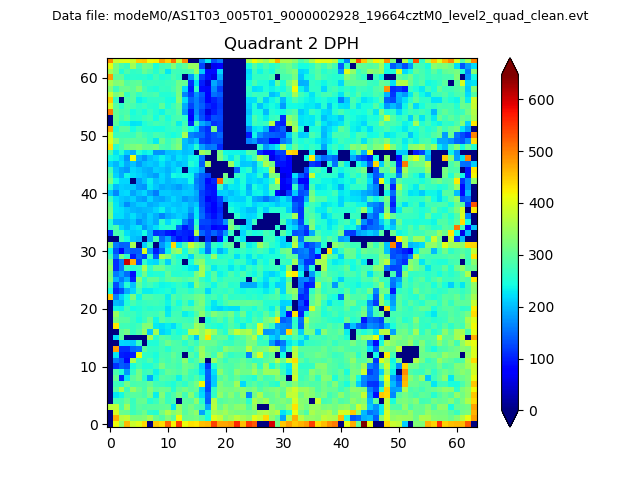
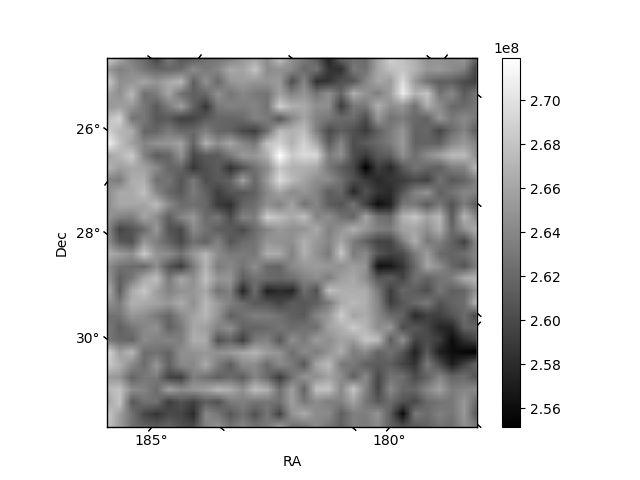
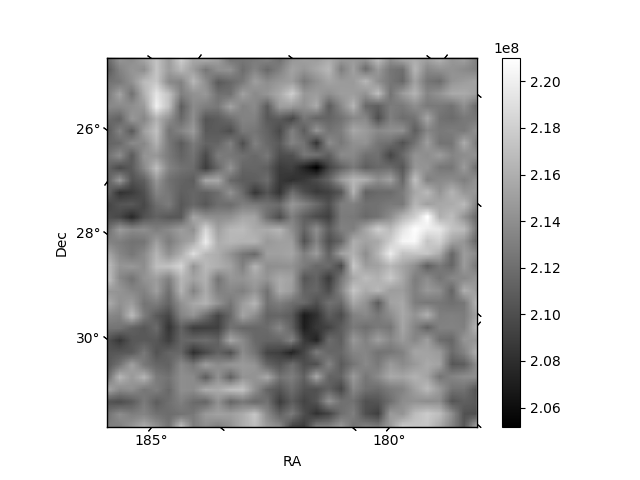
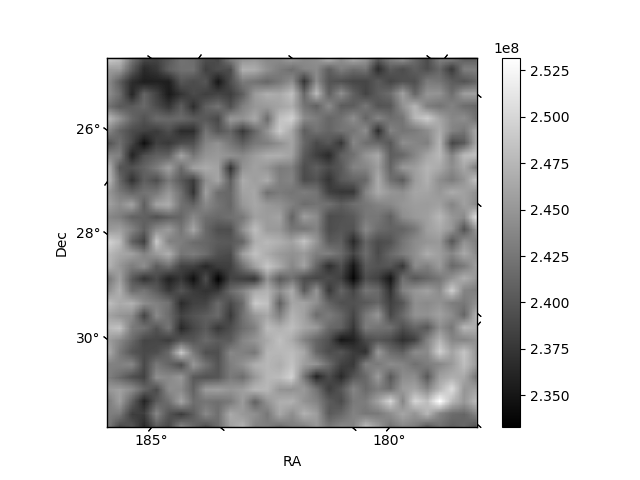
Histogram calculated using DETX and DETY for each event in the final _common_clean file
| Quadrant A | 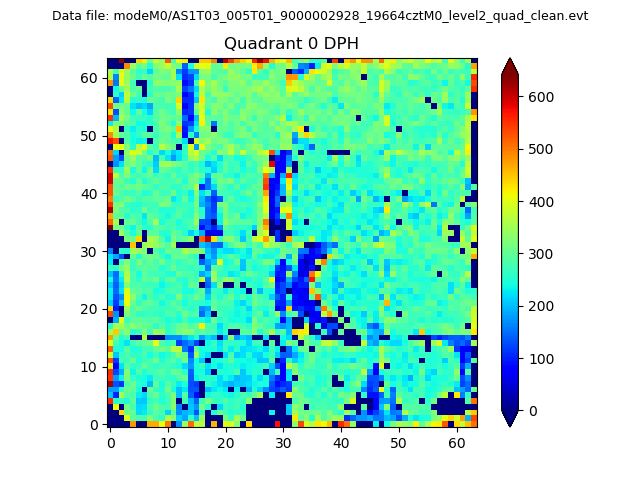 |
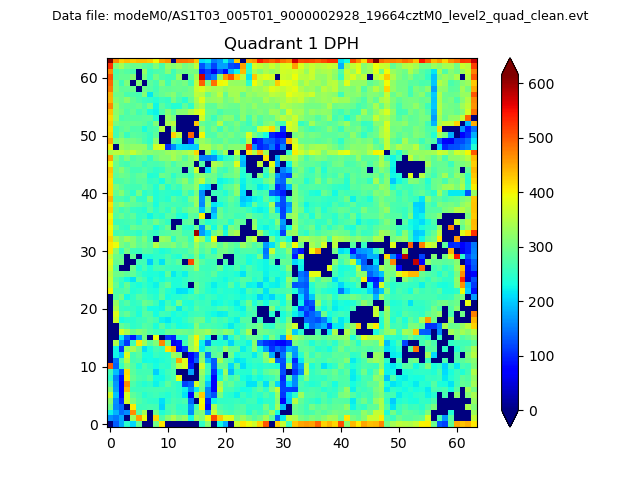 |
Quadrant B |
|---|---|---|---|
| Quadrant D | 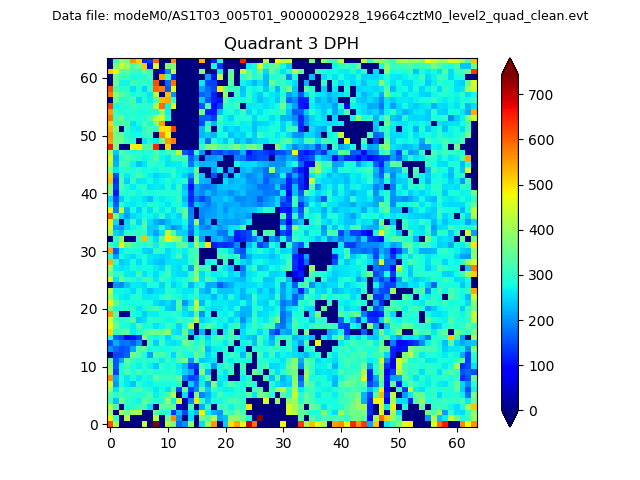 |
 |
Quadrant C |
| Plot type | Count rate plots | Images |
|---|---|---|
| Comparison with Poisson distribution Blue bars denote a histogram of data divided into 1 sec bins. Red curve is a Poisson curve with rate = median count rate of data. |
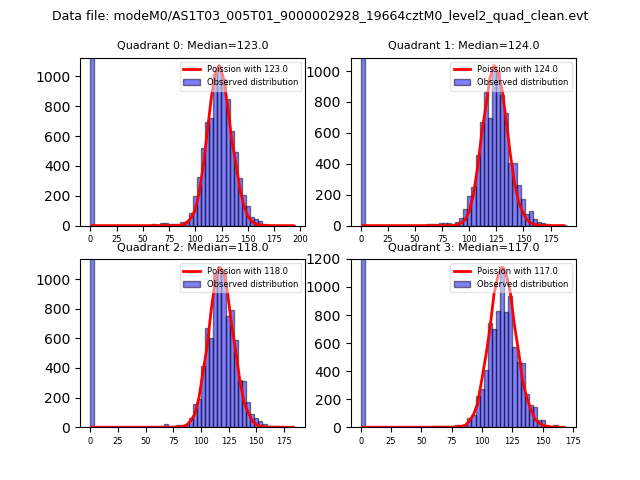 |
 |
| Quadrant-wise count rates Data is divided into 100 sec bins |
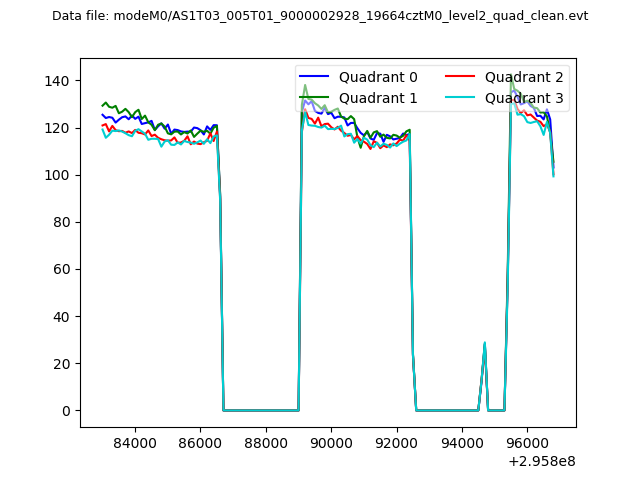 |
|
| Module-wise count rates for Quadrant A Data is divided into 100 sec bins |
 |
 |
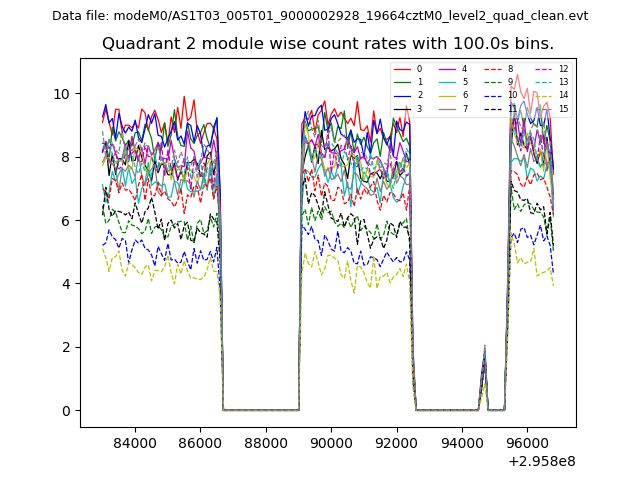
| Module-wise count rates for Quadrant B Data is divided into 100 sec bins |
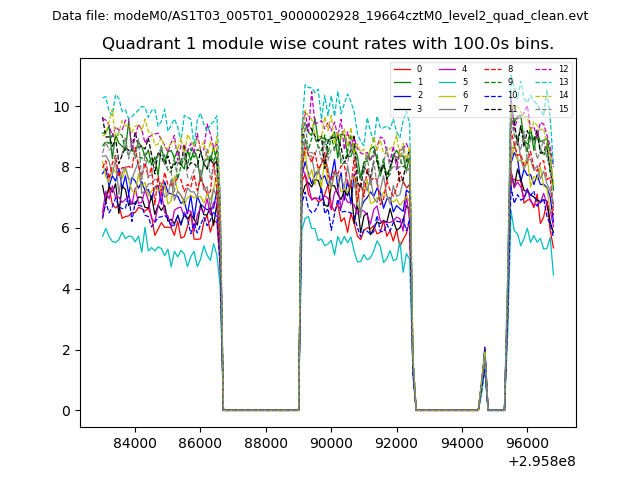 |
 |
| Module-wise count rates for Quadrant C Data is divided into 100 sec bins |
 |
 |
| Module-wise count rates for Quadrant D Data is divided into 100 sec bins |
 |
 |
| Parameter | Plot |
|---|---|
| CZT HV Monitor |  |
| D_VDD | 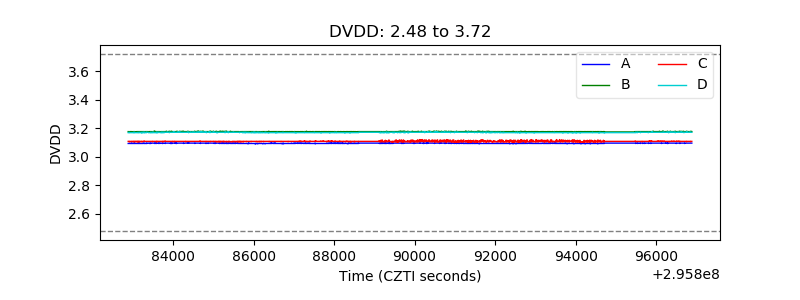 |
| Temperature 1 | 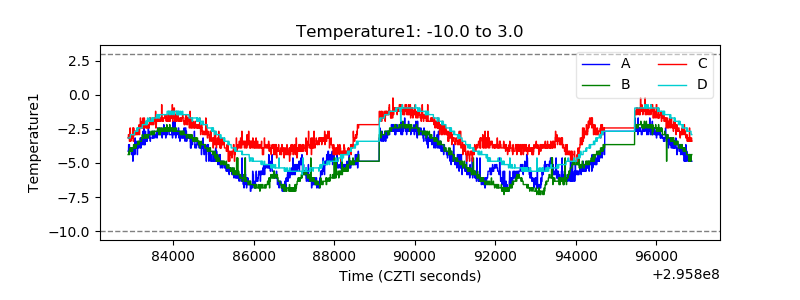 |
| Veto HV Monitor | 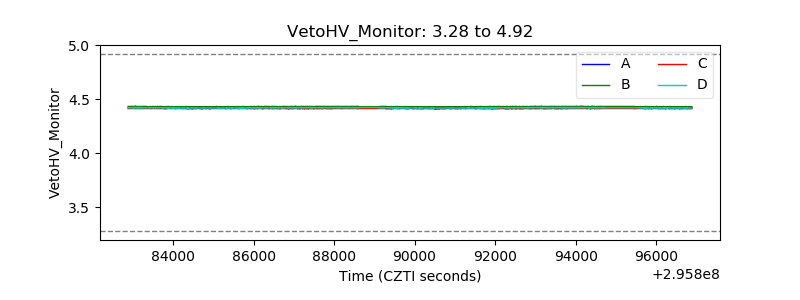 |
| Veto LLD | 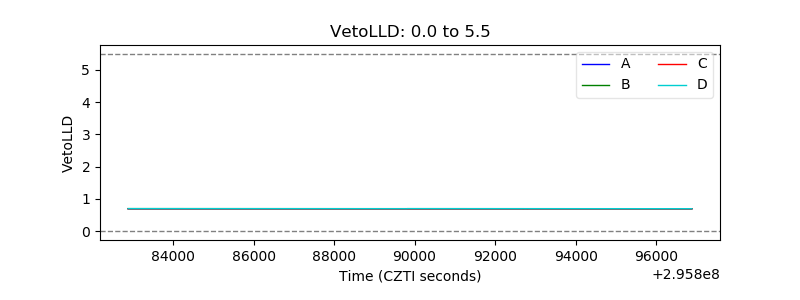 |
| Alpha Counter | 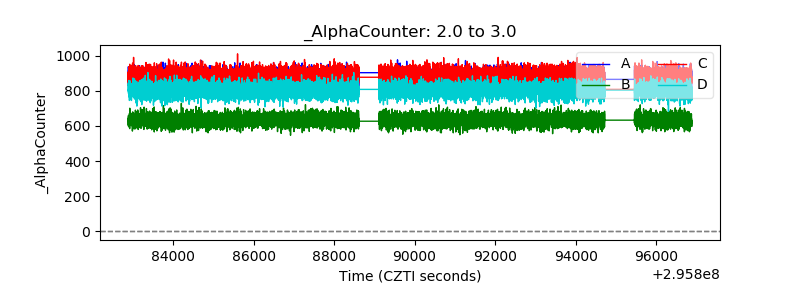 |
| _CPM_Rate | 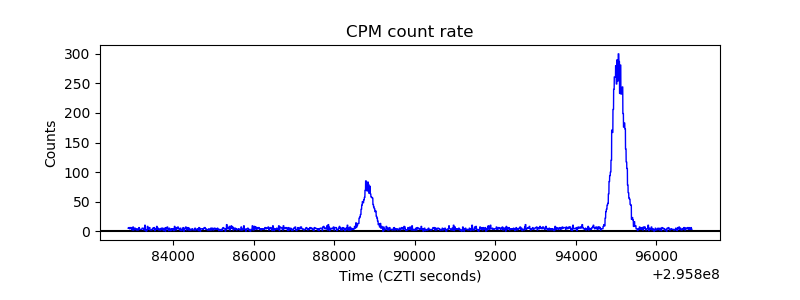 |
| CZT Counter |  |
| +2.5 Volts monitor |  |
| +5 Volts monitor | 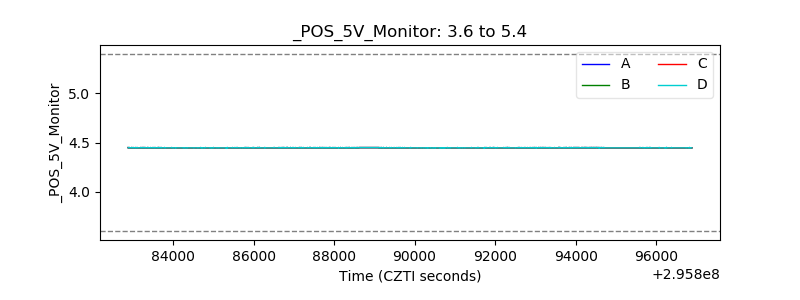 |
| _ROLL_ROT |  |
| _Roll_DEC |  |
| _Roll_RA |  |
| Veto Counter |  |