| Param | Original file | Final file |
|---|---|---|
| Filename | modeM0/AS1T03_005T01_9000002928_19668cztM0_level2.evt | modeM0/AS1T03_005T01_9000002928_19668cztM0_level2_quad_clean.evt |
| Size (bytes) | 504,449,280 | 92,862,720 |
| Size | 481.1 MB | 88.6 MB |
| Events in quadrant A | 3,093,867 | 604,434 |
| Events in quadrant B | 3,170,309 | 620,444 |
| Events in quadrant C | 3,141,131 | 584,399 |
| Events in quadrant D | 5,435,905 | 554,532 |
| Mode SS | |||
|---|---|---|---|
| Quadrant | BADHDUFLAG | Total packets | Discarded packets |
| A | 0 | 132 | 0 |
| B | 0 | 132 | 0 |
| C | 0 | 132 | 0 |
| D | 0 | 132 | 0 |
| Mode M9 | |||
|---|---|---|---|
| Quadrant | BADHDUFLAG | Total packets | Discarded packets |
| A | 0 | 21 | 0 |
| B | 0 | 22 | 0 |
| C | 0 | 22 | 0 |
| D | 0 | 22 | 0 |
| Mode M0 | |||
|---|---|---|---|
| Quadrant | BADHDUFLAG | Total packets | Discarded packets |
| A | 0 | 13352 | 2 |
| B | 0 | 13563 | 2 |
| C | 0 | 13420 | 2 |
| D | 0 | 20473 | 2 |
| Quadrant | Total seconds | Saturated seconds | Saturation percentage |
|---|---|---|---|
| A | 6429 | 32 | 0.497745% |
| B | 6429 | 29 | 0.451081% |
| C | 6429 | 39 | 0.606626% |
| D | 6428 | 362 | 5.631612% |
Noise dominated data is calculated using 1-second bins in cleaned event files. If a bin has >2000 counts, and if more than 50% of those come from <1% of pixels, then it is considered to be noise-dominated and hence unusable.
| Quadrant | # 1 sec bins | Bins with >0 counts | Bins with >2000 counts | High rate bins dominated by noise | Noise dominated (total time) | Noise dominated (detector-on time) | Marked lightcurve |
|---|---|---|---|---|---|---|---|
| A | 7624 | 6430 | 9 | 9 | 0.12% | 0.14% | 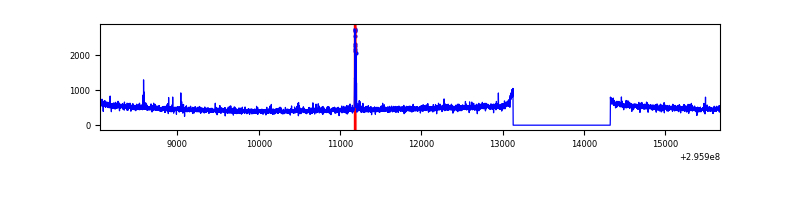 |
| B | 7624 | 6430 | 9 | 9 | 0.12% | 0.14% | 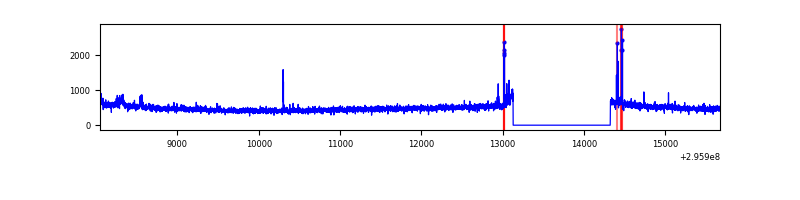 |
| C | 7624 | 6429 | 0 | 0 | 0.00% | 0.00% | 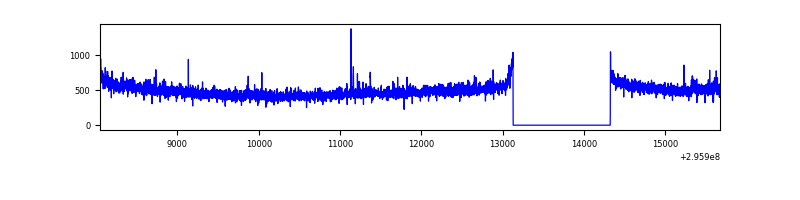 |
| D | 7623 | 6429 | 324 | 324 | 4.25% | 5.04% | 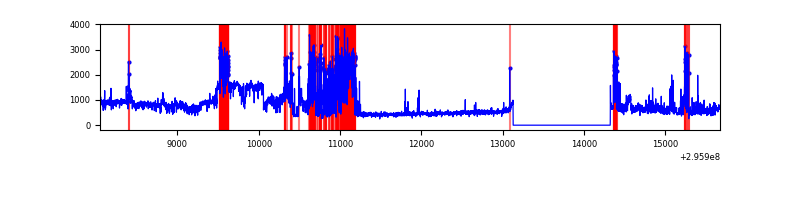 |
Top three noisy pixels from each quadrant. If the there are fewer than three noisy pixels in the level2.evt file, extra rows are filled as -1
| Pixel properties | Quadrant properties | ||||||
|---|---|---|---|---|---|---|---|
| Quadrant | DetID | PixID | Counts | Sigma | Mean | Median | Sigma |
| A | 13 | 252 | 39544 | 245.67 | 786 | 772 | 157.8 |
| A | 11 | 29 | 19284 | 117.3 | 786 | 772 | 157.8 |
| A | 4 | 2 | 8411 | 48.4 | 786 | 772 | 157.8 |
| B | 7 | 220 | 35122 | 230.26 | 788 | 768 | 149.2 |
| B | 4 | 216 | 25218 | 163.87 | 788 | 768 | 149.2 |
| B | 12 | 111 | 17720 | 113.62 | 788 | 768 | 149.2 |
| C | 14 | 238 | 119827 | 675.98 | 756 | 762 | 176.1 |
| C | 3 | 233 | 64815 | 363.66 | 756 | 762 | 176.1 |
| C | 9 | 221 | 8774 | 45.49 | 756 | 762 | 176.1 |
| D | 1 | 20 | 1569868 | 8623.42 | 742 | 719 | 182.0 |
| D | 12 | 218 | 748252 | 4108.15 | 742 | 719 | 182.0 |
| D | 10 | 199 | 137606 | 752.28 | 742 | 719 | 182.0 |
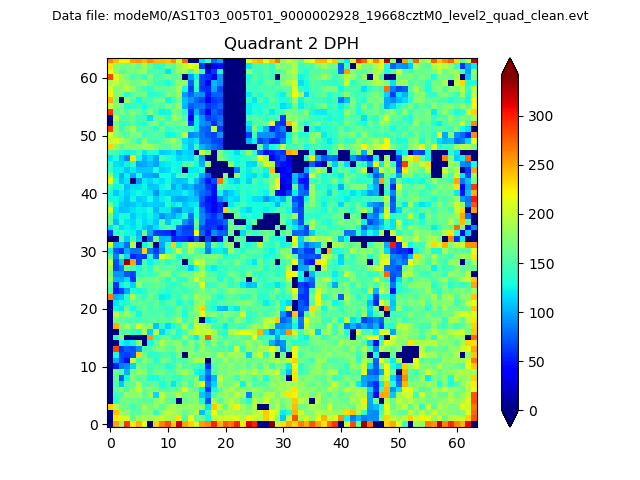
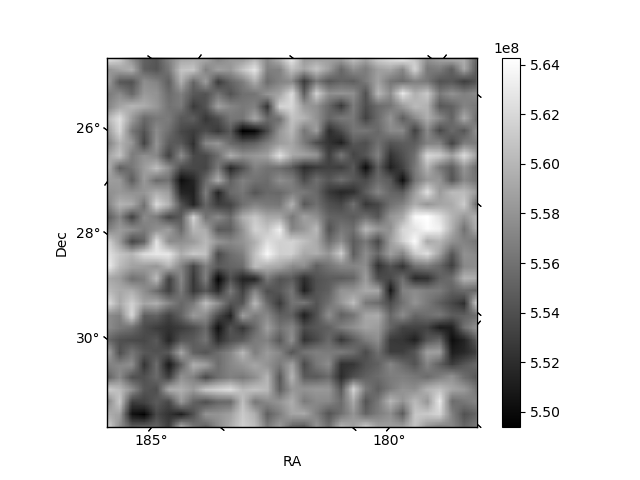
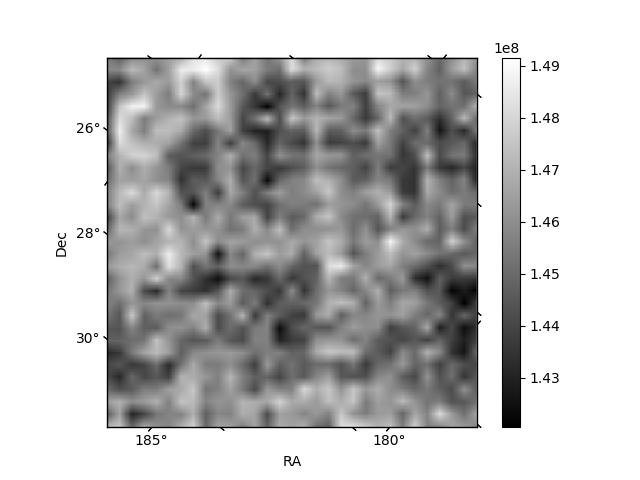
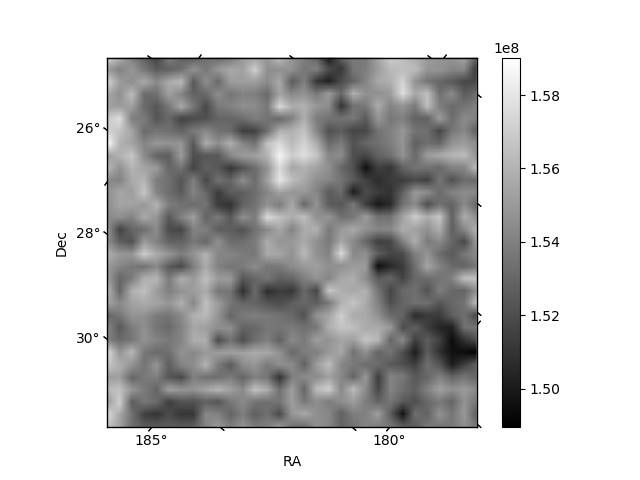
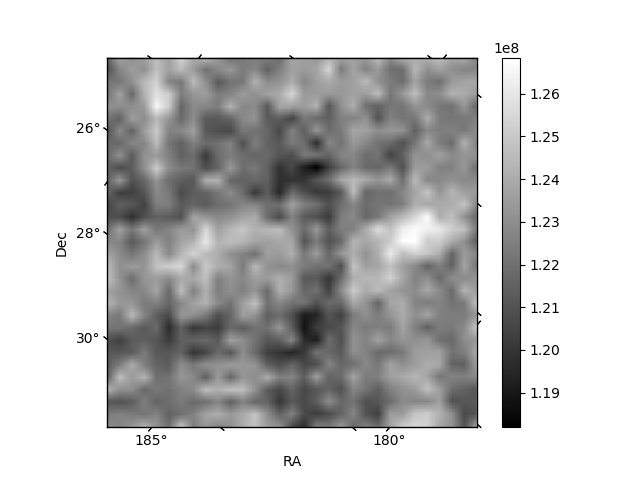
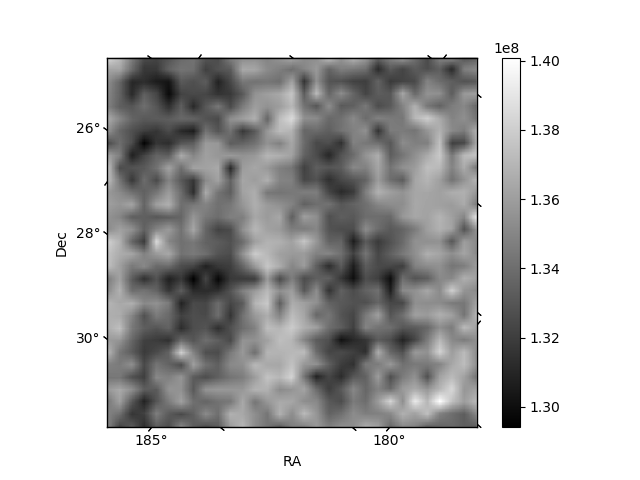
Histogram calculated using DETX and DETY for each event in the final _common_clean file
| Quadrant A | 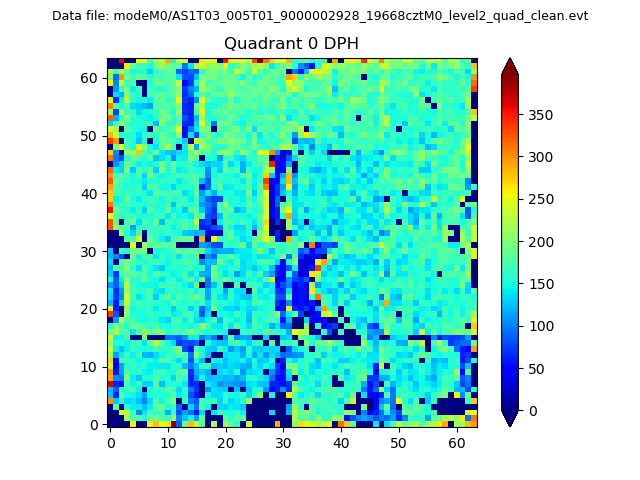 |
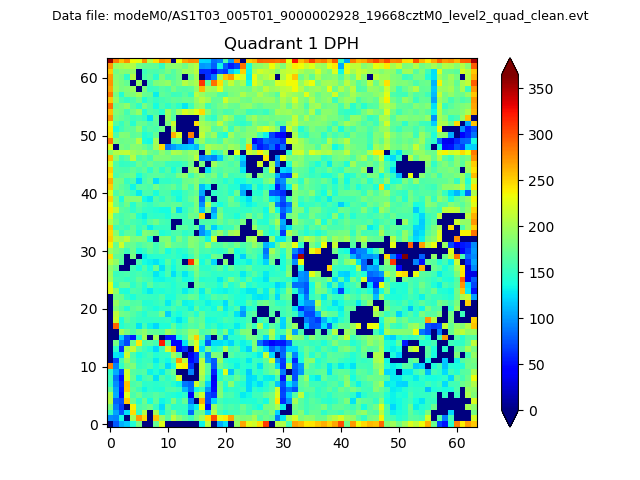 |
Quadrant B |
|---|---|---|---|
| Quadrant D | 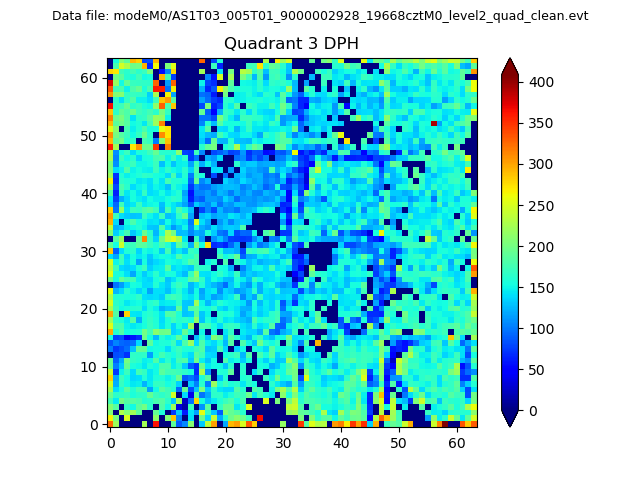 |
 |
Quadrant C |
| Plot type | Count rate plots | Images |
|---|---|---|
| Comparison with Poisson distribution Blue bars denote a histogram of data divided into 1 sec bins. Red curve is a Poisson curve with rate = median count rate of data. |
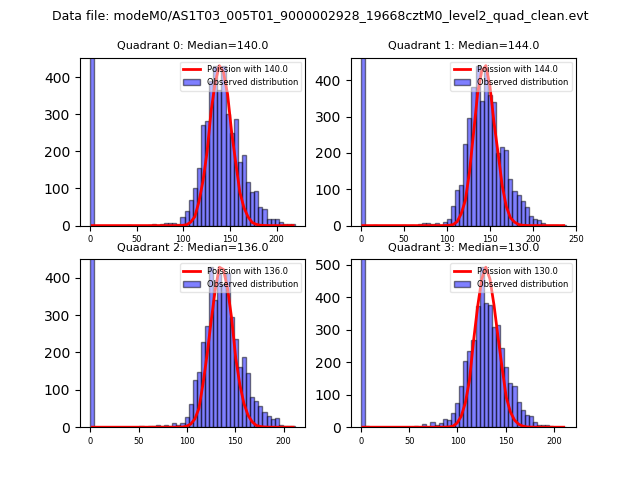 |
 |
| Quadrant-wise count rates Data is divided into 100 sec bins |
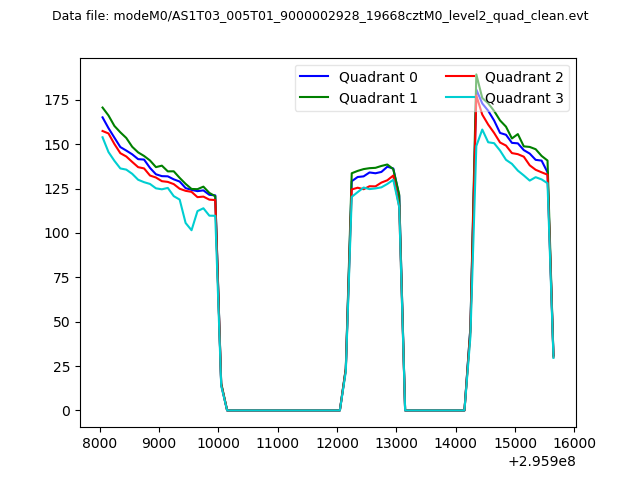 |
|
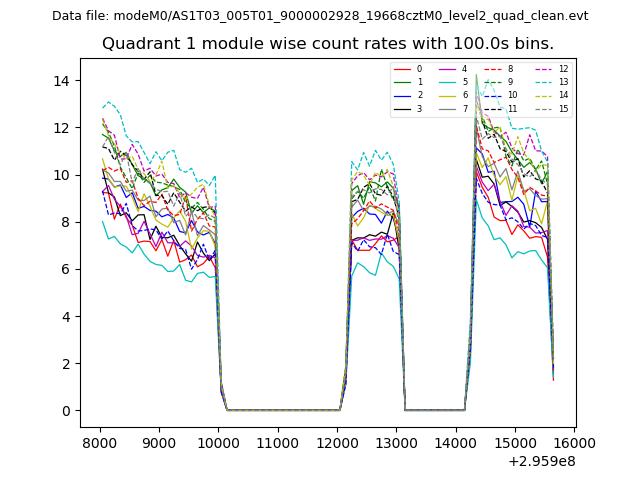
| Module-wise count rates for Quadrant A Data is divided into 100 sec bins |
 |
 |
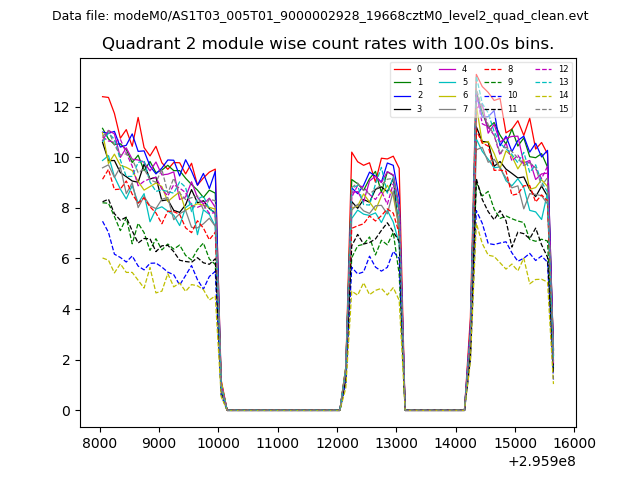
| Module-wise count rates for Quadrant B Data is divided into 100 sec bins |
 |
 |
| Module-wise count rates for Quadrant C Data is divided into 100 sec bins |
 |
 |
| Module-wise count rates for Quadrant D Data is divided into 100 sec bins |
 |
 |
| Parameter | Plot |
|---|---|
| CZT HV Monitor | 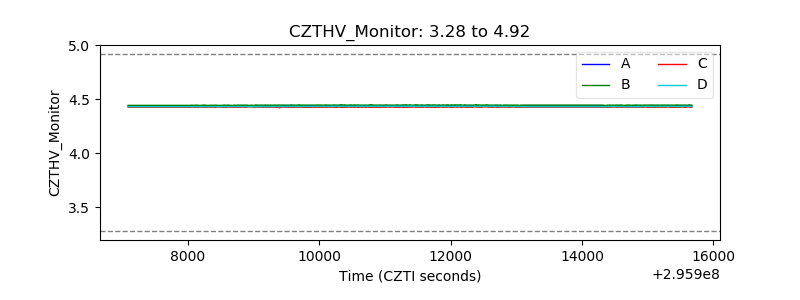 |
| D_VDD | 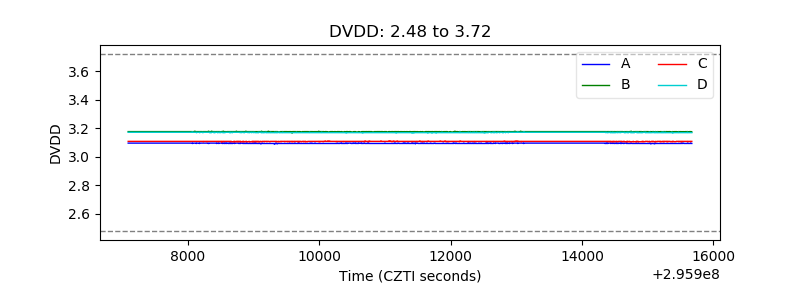 |
| Temperature 1 | 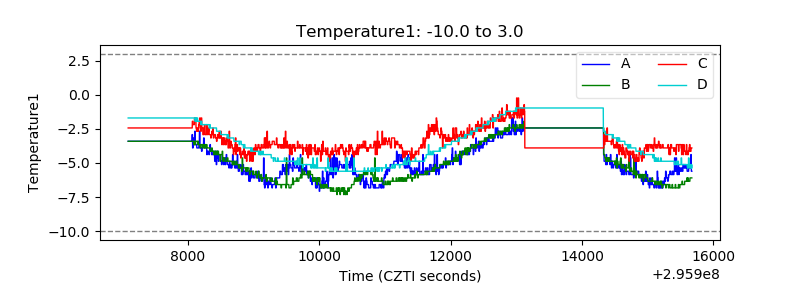 |
| Veto HV Monitor |  |
| Veto LLD | 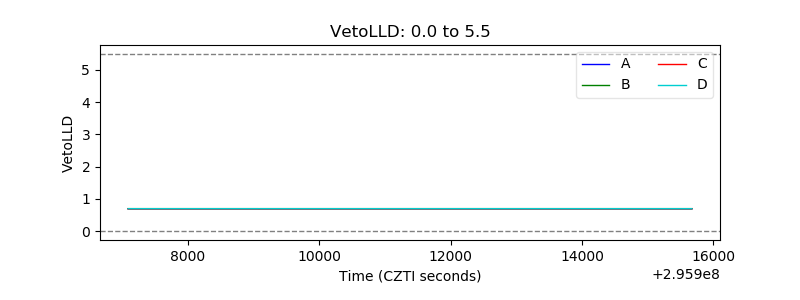 |
| Alpha Counter | 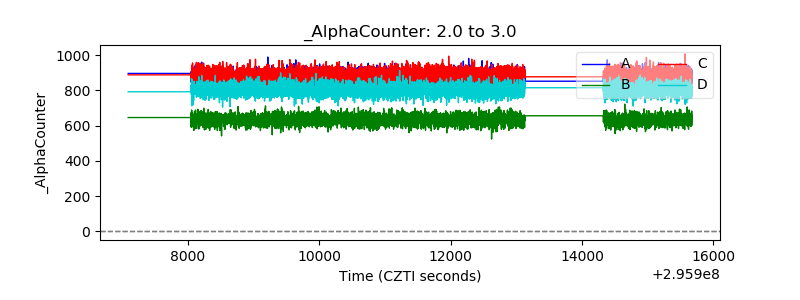 |
| _CPM_Rate | 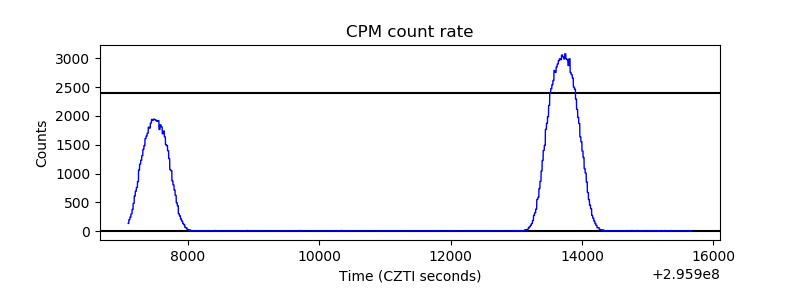 |
| CZT Counter | 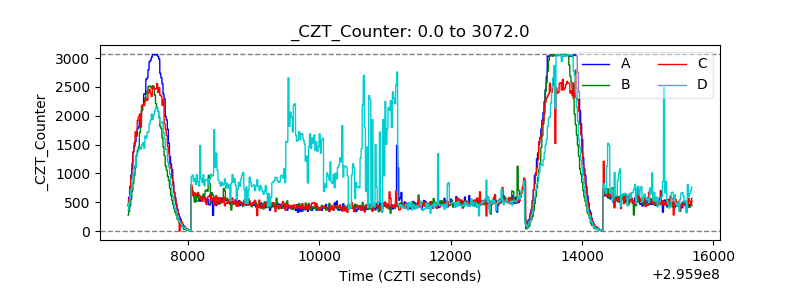 |
| +2.5 Volts monitor |  |
| +5 Volts monitor | 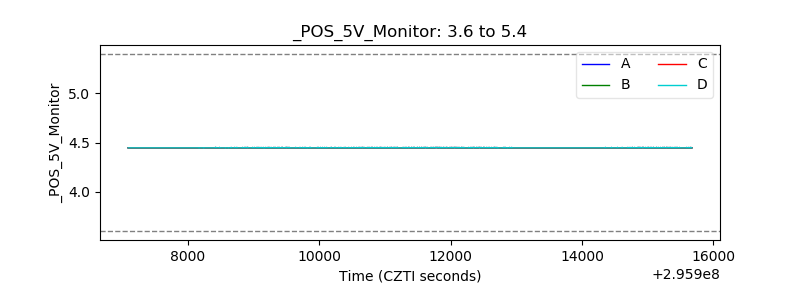 |
| _ROLL_ROT |  |
| _Roll_DEC | 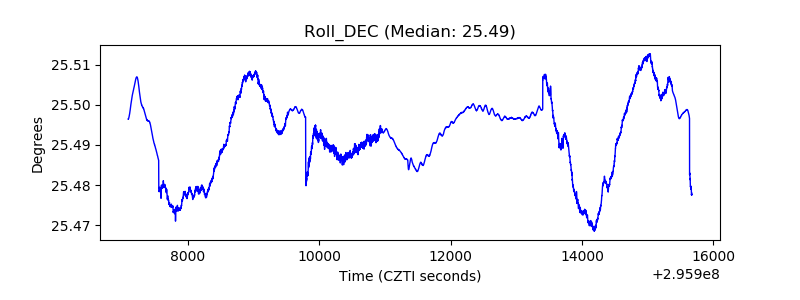 |
| _Roll_RA | 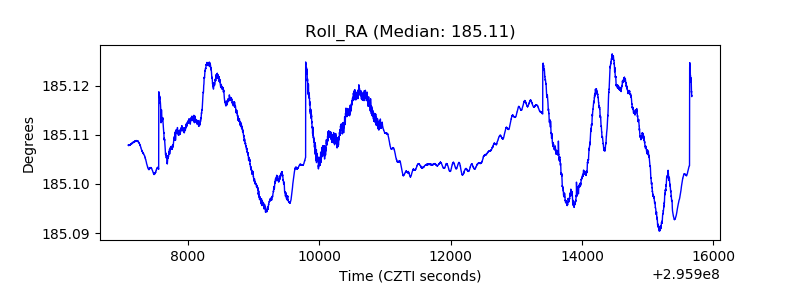 |
| Veto Counter |  |