| Param | Original file | Final file |
|---|---|---|
| Filename | modeM0/AS1A05_025T18_9000002932cztM0_level2.fits | modeM0/AS1A05_025T18_9000002932cztM0_level2_quad_clean.evt |
| Size (bytes) | 155,957,760 | 158,918,400 |
| Size | 148.7 MB | 151.6 MB |
| Events in quadrant A | 942,752 | 959,607 |
| Events in quadrant B | 902,630 | 951,846 |
| Events in quadrant C | 915,876 | 903,544 |
| Events in quadrant D | 805,400 | 841,451 |
| Mode M9 | |||
|---|---|---|---|
| Quadrant | BADHDUFLAG | Total packets | Discarded packets |
| A | 0 | 7 | 0 |
| B | 0 | 7 | 0 |
| C | 0 | 7 | 0 |
| D | 0 | 7 | 0 |
| Mode SS | |||
|---|---|---|---|
| Quadrant | BADHDUFLAG | Total packets | Discarded packets |
| A | 0 | 338 | 0 |
| B | 0 | 338 | 0 |
| C | 0 | 338 | 0 |
| D | 0 | 338 | 0 |
| Mode M0 | |||
|---|---|---|---|
| Quadrant | BADHDUFLAG | Total packets | Discarded packets |
| A | 0 | 34929 | 0 |
| B | 0 | 37185 | 0 |
| C | 0 | 37761 | 0 |
| D | 0 | 39873 | 0 |
| Quadrant | Total seconds | Saturated seconds | Saturation percentage |
|---|---|---|---|
| A | 16768 | 431 | 2.570372% |
| B | 16768 | 565 | 3.369513% |
| C | 16768 | 559 | 3.333731% |
| D | 16768 | 585 | 3.488788% |
Noise dominated data is calculated using 1-second bins in cleaned event files. If a bin has >2000 counts, and if more than 50% of those come from <1% of pixels, then it is considered to be noise-dominated and hence unusable.
| Quadrant | # 1 sec bins | Bins with >0 counts | Bins with >2000 counts | High rate bins dominated by noise | Noise dominated (total time) | Noise dominated (detector-on time) | Marked lightcurve |
|---|---|---|---|---|---|---|---|
| A | 17483 | 16764 | 0 | 0 | 0.00% | 0.00% |  |
| B | 17483 | 16764 | 0 | 0 | 0.00% | 0.00% |  |
| C | 17483 | 16766 | 0 | 0 | 0.00% | 0.00% |  |
| D | 17483 | 16764 | 0 | 0 | 0.00% | 0.00% |  |
Top three noisy pixels from each quadrant. If the there are fewer than three noisy pixels in the level2.evt file, extra rows are filled as -1
| Pixel properties | Quadrant properties | ||||||
|---|---|---|---|---|---|---|---|
| Quadrant | DetID | PixID | Counts | Sigma | Mean | Median | Sigma |
| A | 0 | 29 | 941 | 11.45 | 245 | 229 | 62.2 |
| A | 7 | 110 | 748 | 8.34 | 245 | 229 | 62.2 |
| A | 0 | 30 | 719 | 7.88 | 245 | 229 | 62.2 |
| B | 2 | 9 | 761 | 10.83 | 238 | 226 | 49.4 |
| B | 2 | 8 | 655 | 8.68 | 238 | 226 | 49.4 |
| B | 14 | 254 | 622 | 8.01 | 238 | 226 | 49.4 |
| C | 3 | 235 | 650 | 6.69 | 242 | 225 | 63.5 |
| C | 3 | 126 | 648 | 6.66 | 242 | 225 | 63.5 |
| C | 12 | 241 | 632 | 6.4 | 242 | 225 | 63.5 |
| D | 7 | 3 | 597 | 6.15 | 229 | 207 | 63.3 |
| D | 15 | 46 | 577 | 5.83 | 229 | 207 | 63.3 |
| D | 6 | 231 | 576 | 5.82 | 229 | 207 | 63.3 |
Histogram calculated using DETX and DETY for each event in the final _common_clean file
| Quadrant A | 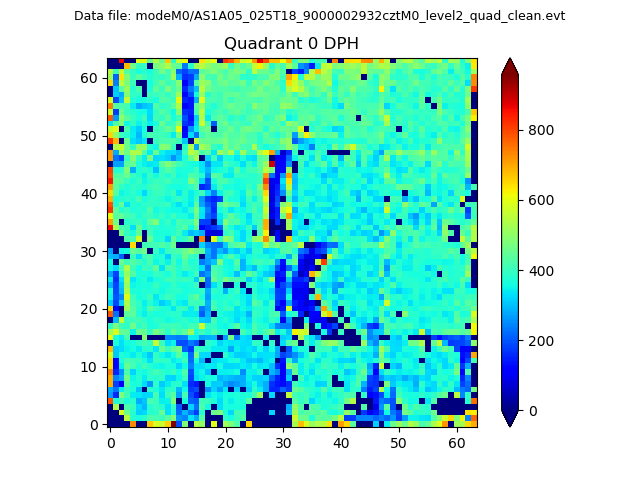 |
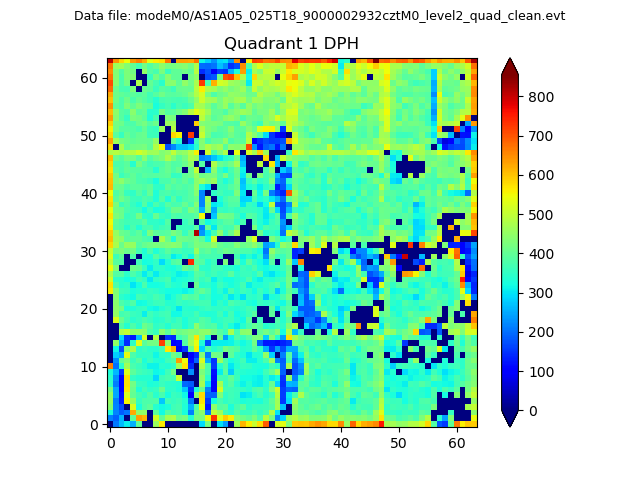 |
Quadrant B |
|---|---|---|---|
| Quadrant D |  |
 |
Quadrant C |
| Plot type | Count rate plots | Images |
|---|---|---|
| Comparison with Poisson distribution Blue bars denote a histogram of data divided into 1 sec bins. Red curve is a Poisson curve with rate = median count rate of data. |
 |
 |
| Quadrant-wise count rates Data is divided into 100 sec bins |
 |
|
| Module-wise count rates for Quadrant A Data is divided into 100 sec bins |
 |
 |
| Module-wise count rates for Quadrant B Data is divided into 100 sec bins |
 |
 |
| Module-wise count rates for Quadrant C Data is divided into 100 sec bins |
 |
 |
| Module-wise count rates for Quadrant D Data is divided into 100 sec bins |
 |
 |
| Parameter | Plot |
|---|---|
| CZT HV Monitor |  |
| D_VDD |  |
| Temperature 1 |  |
| Veto HV Monitor |  |
| Veto LLD |  |
| Alpha Counter |  |
| _CPM_Rate |  |
| CZT Counter |  |
| +2.5 Volts monitor |  |
| +5 Volts monitor |  |
| _ROLL_ROT |  |
| _Roll_DEC |  |
| _Roll_RA |  |
| Veto Counter |  |