| Param | Original file | Final file |
|---|---|---|
| Filename | modeM0/AS1A05_025T18_9000002932_19675cztM0_level2.evt | modeM0/AS1A05_025T18_9000002932_19675cztM0_level2_quad_clean.evt |
| Size (bytes) | 259,116,480 | 44,236,800 |
| Size | 247.1 MB | 42.2 MB |
| Events in quadrant A | 1,715,594 | 279,510 |
| Events in quadrant B | 1,909,030 | 285,113 |
| Events in quadrant C | 1,920,044 | 270,733 |
| Events in quadrant D | 2,074,654 | 267,254 |
| Mode SS | |||
|---|---|---|---|
| Quadrant | BADHDUFLAG | Total packets | Discarded packets |
| A | 0 | 68 | 0 |
| B | 0 | 68 | 0 |
| C | 0 | 68 | 0 |
| D | 0 | 68 | 0 |
| Mode M0 | |||
|---|---|---|---|
| Quadrant | BADHDUFLAG | Total packets | Discarded packets |
| A | 0 | 7263 | 1 |
| B | 0 | 7752 | 1 |
| C | 0 | 7673 | 1 |
| D | 0 | 8297 | 1 |
| Quadrant | Total seconds | Saturated seconds | Saturation percentage |
|---|---|---|---|
| A | 3323 | 225 | 6.770990% |
| B | 3323 | 256 | 7.703882% |
| C | 3323 | 248 | 7.463136% |
| D | 3323 | 242 | 7.282576% |
Noise dominated data is calculated using 1-second bins in cleaned event files. If a bin has >2000 counts, and if more than 50% of those come from <1% of pixels, then it is considered to be noise-dominated and hence unusable.
| Quadrant | # 1 sec bins | Bins with >0 counts | Bins with >2000 counts | High rate bins dominated by noise | Noise dominated (total time) | Noise dominated (detector-on time) | Marked lightcurve |
|---|---|---|---|---|---|---|---|
| A | 3393 | 3323 | 1 | 1 | 0.03% | 0.03% | 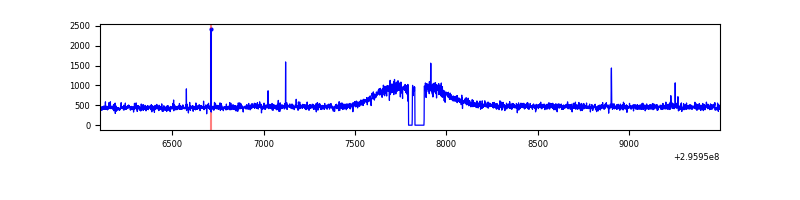 |
| B | 3393 | 3323 | 16 | 16 | 0.47% | 0.48% | 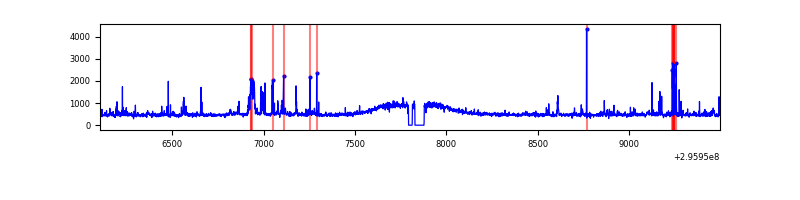 |
| C | 3393 | 3324 | 8 | 8 | 0.24% | 0.24% | 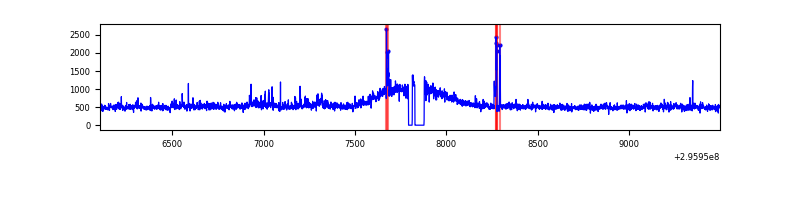 |
| D | 3393 | 3325 | 27 | 27 | 0.80% | 0.81% | 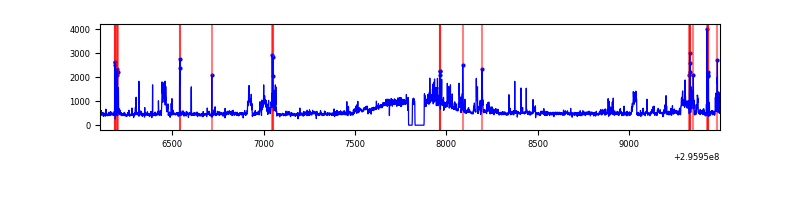 |
Top three noisy pixels from each quadrant. If the there are fewer than three noisy pixels in the level2.evt file, extra rows are filled as -1
| Pixel properties | Quadrant properties | ||||||
|---|---|---|---|---|---|---|---|
| Quadrant | DetID | PixID | Counts | Sigma | Mean | Median | Sigma |
| A | 5 | 16 | 12319 | 129.76 | 439 | 426 | 91.7 |
| A | 11 | 29 | 11553 | 121.4 | 439 | 426 | 91.7 |
| A | 0 | 226 | 3924 | 38.17 | 439 | 426 | 91.7 |
| B | 3 | 112 | 165425 | 1880.97 | 433 | 420 | 87.7 |
| B | 7 | 220 | 32541 | 366.16 | 433 | 420 | 87.7 |
| B | 12 | 111 | 10485 | 114.74 | 433 | 420 | 87.7 |
| C | 3 | 233 | 135168 | 1317.93 | 423 | 424 | 102.2 |
| C | 9 | 221 | 65100 | 632.59 | 423 | 424 | 102.2 |
| C | 14 | 238 | 62390 | 606.09 | 423 | 424 | 102.2 |
| D | 1 | 52 | 185438 | 1732.47 | 432 | 419 | 106.8 |
| D | 12 | 218 | 177734 | 1660.33 | 432 | 419 | 106.8 |
| D | 1 | 20 | 46287 | 429.5 | 432 | 419 | 106.8 |
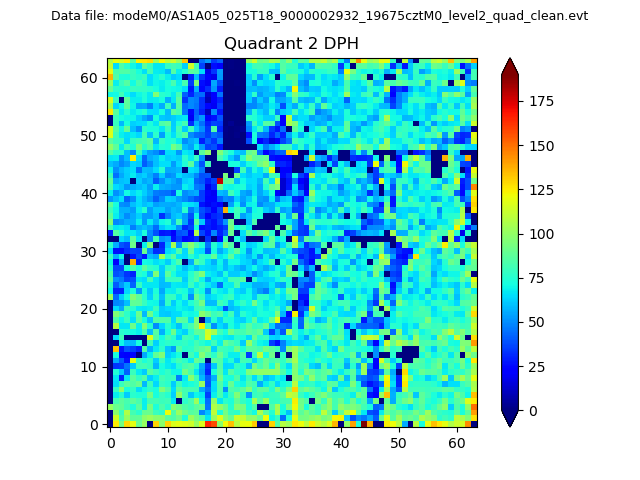
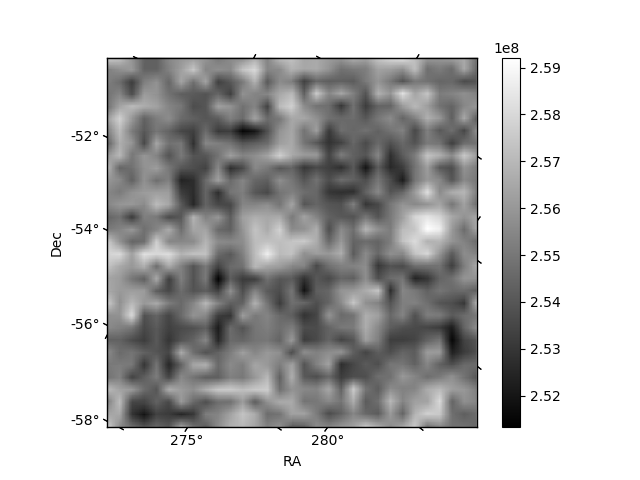
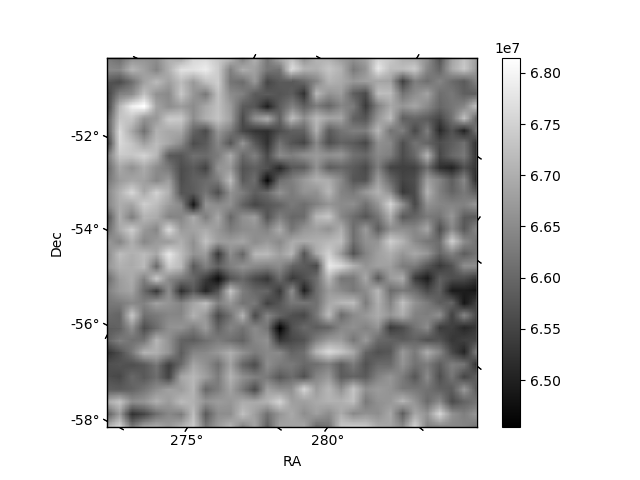
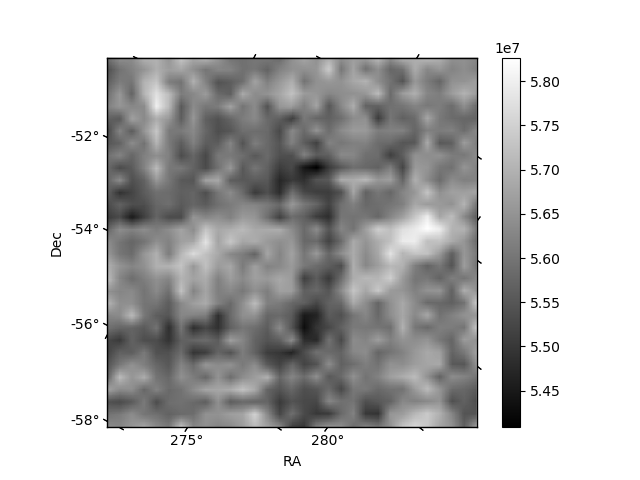
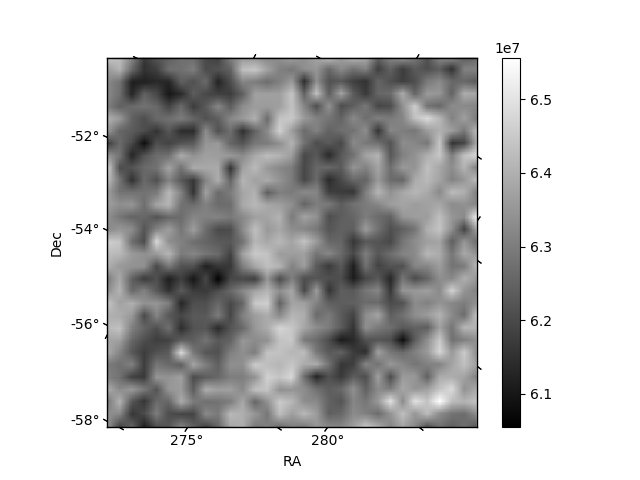
Histogram calculated using DETX and DETY for each event in the final _common_clean file
| Quadrant A | 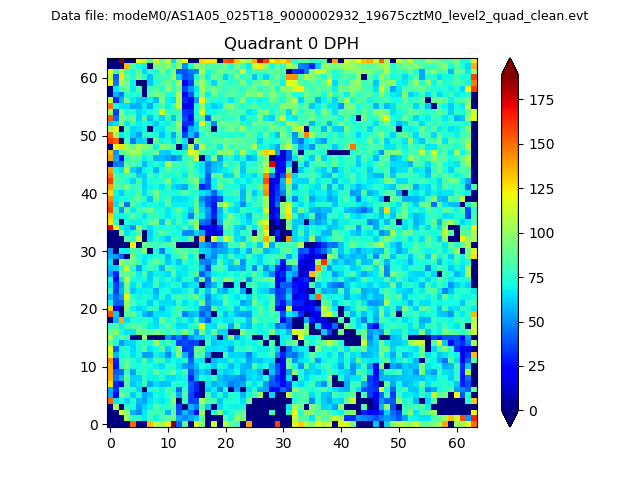 |
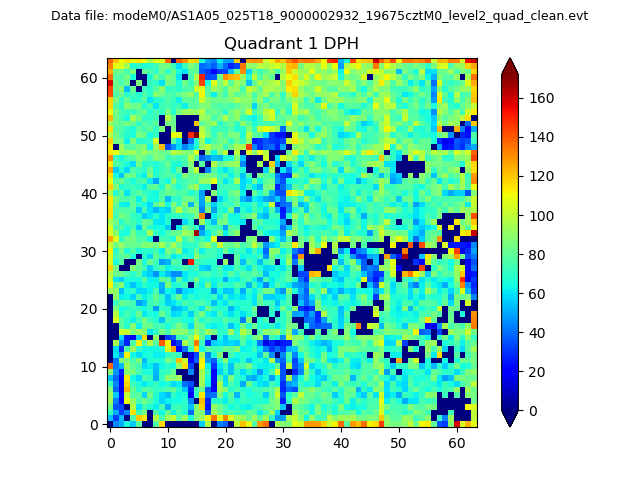 |
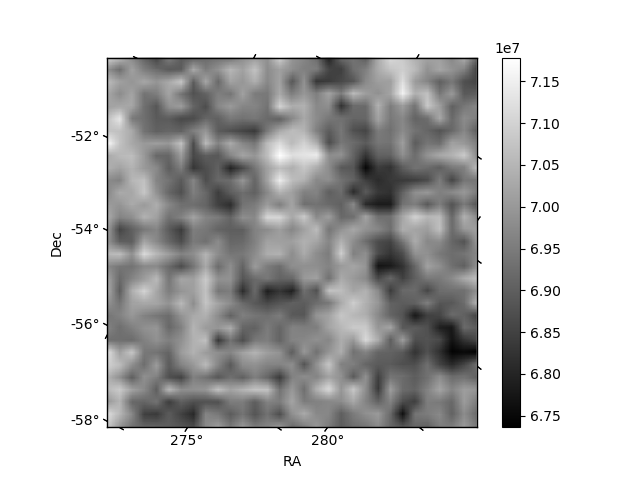
Quadrant B |
|---|---|---|---|
| Quadrant D | 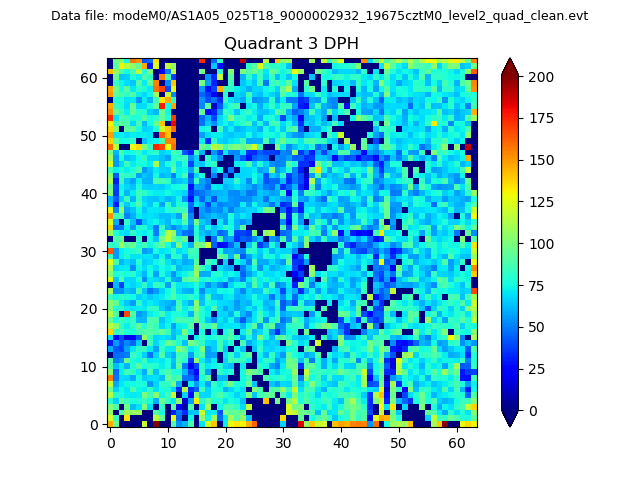 |
 |
Quadrant C |
| Plot type | Count rate plots | Images |
|---|---|---|
| Comparison with Poisson distribution Blue bars denote a histogram of data divided into 1 sec bins. Red curve is a Poisson curve with rate = median count rate of data. |
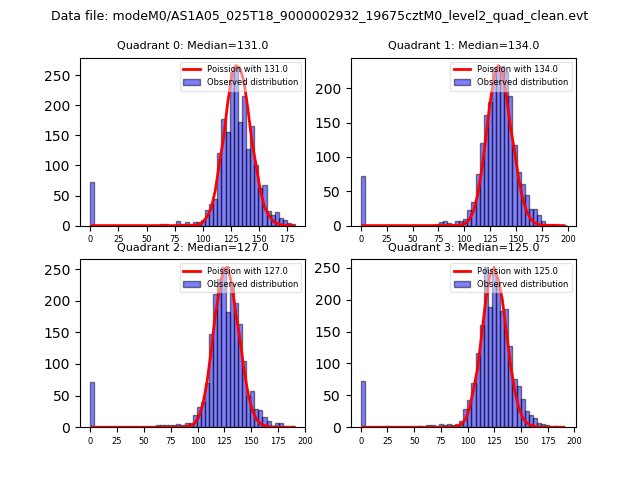 |
 |
| Quadrant-wise count rates Data is divided into 100 sec bins |
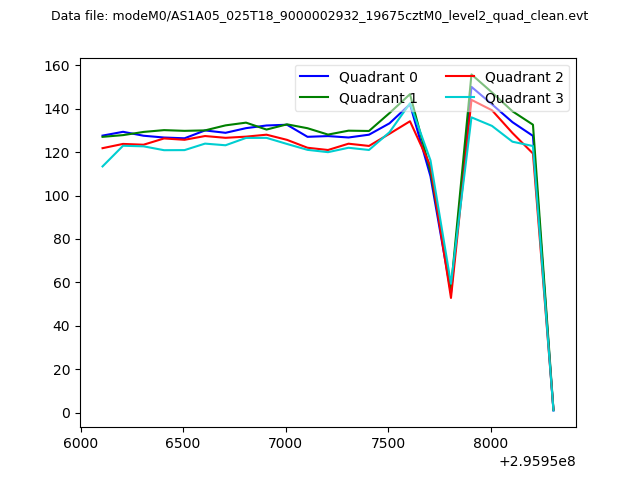 |
|
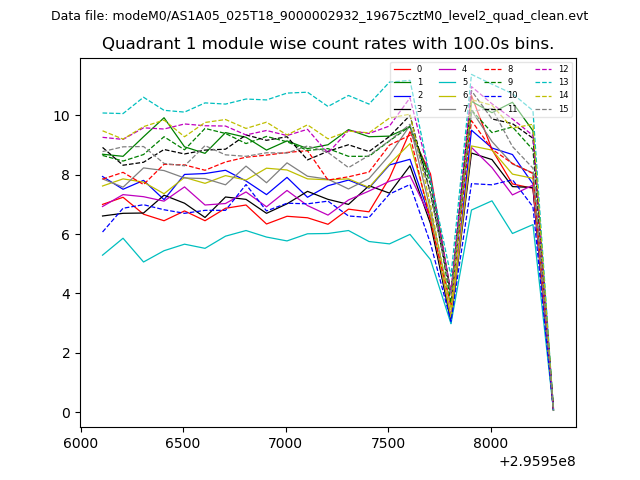
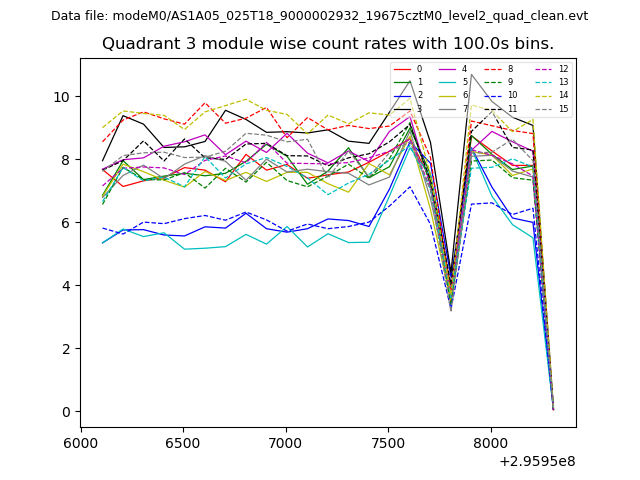
| Module-wise count rates for Quadrant A Data is divided into 100 sec bins |
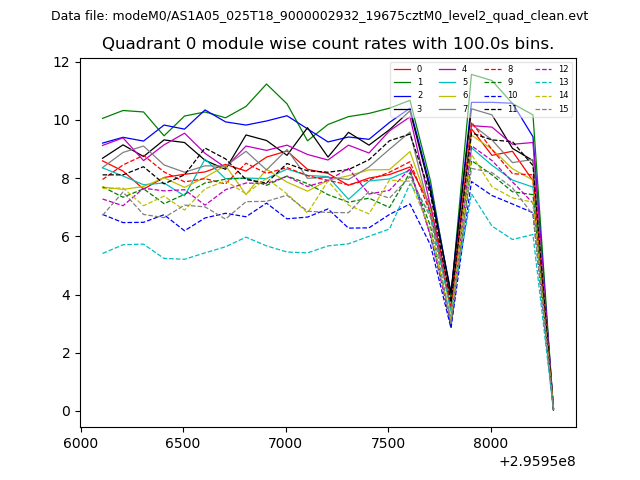 |
 |
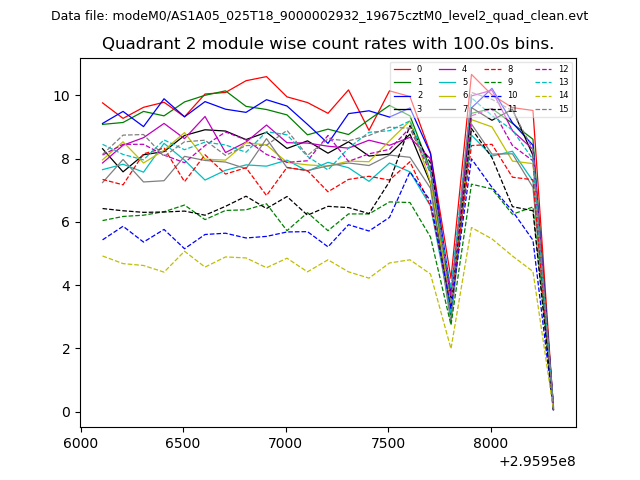
| Module-wise count rates for Quadrant B Data is divided into 100 sec bins |
 |
 |
| Module-wise count rates for Quadrant C Data is divided into 100 sec bins |
 |
 |
| Module-wise count rates for Quadrant D Data is divided into 100 sec bins |
 |
 |
| Parameter | Plot |
|---|---|
| CZT HV Monitor | 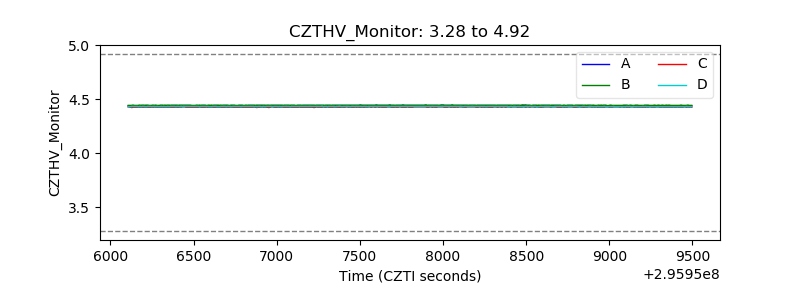 |
| D_VDD | 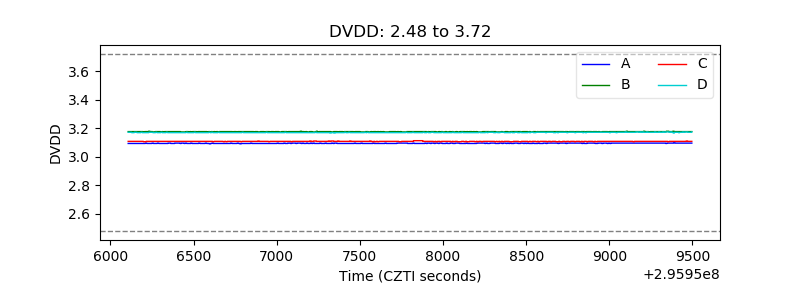 |
| Temperature 1 | 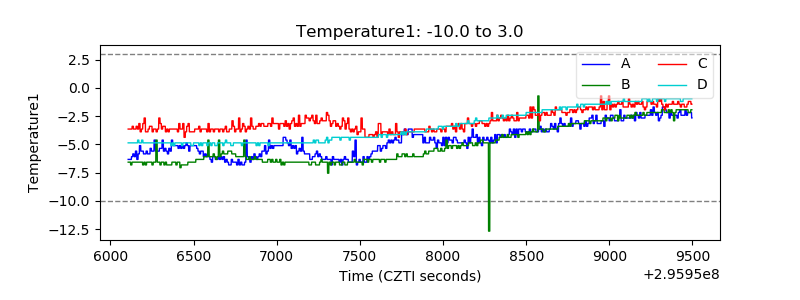 |
| Veto HV Monitor | 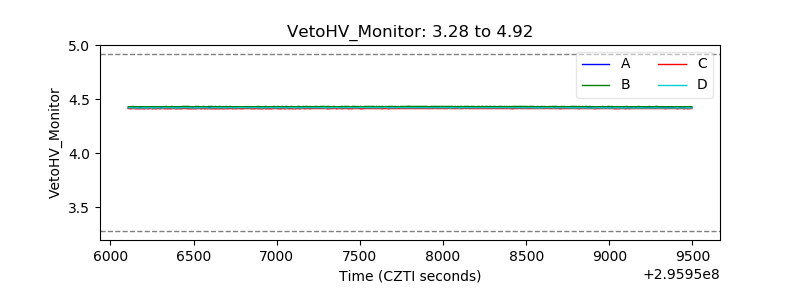 |
| Veto LLD | 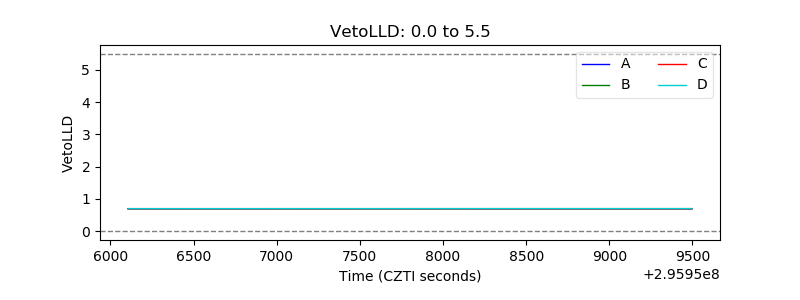 |
| Alpha Counter | 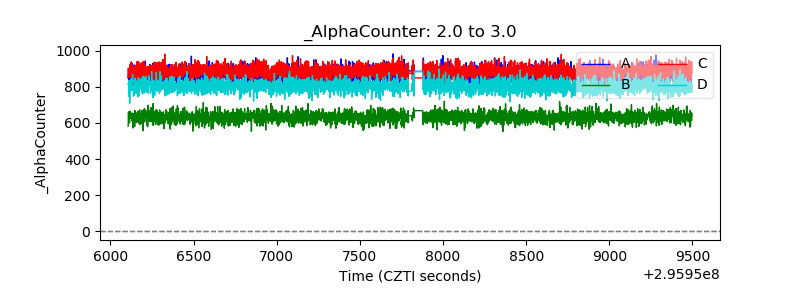 |
| _CPM_Rate | 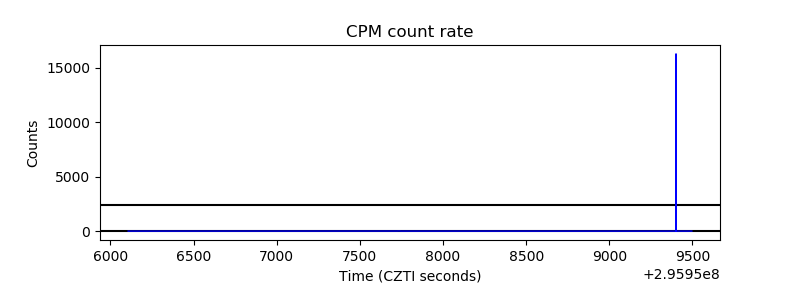 |
| CZT Counter | 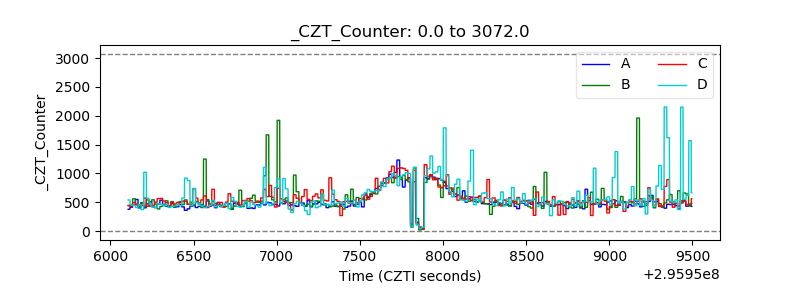 |
| +2.5 Volts monitor | 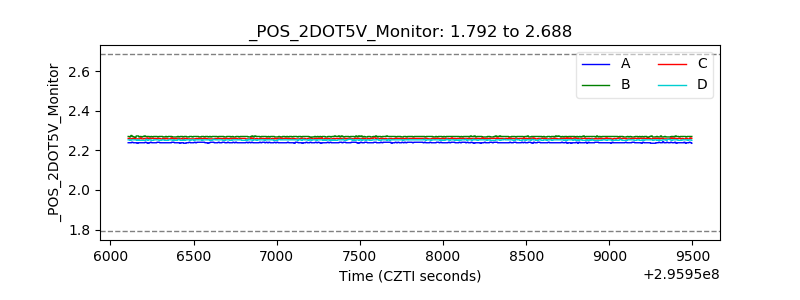 |
| +5 Volts monitor |  |
| _ROLL_ROT | 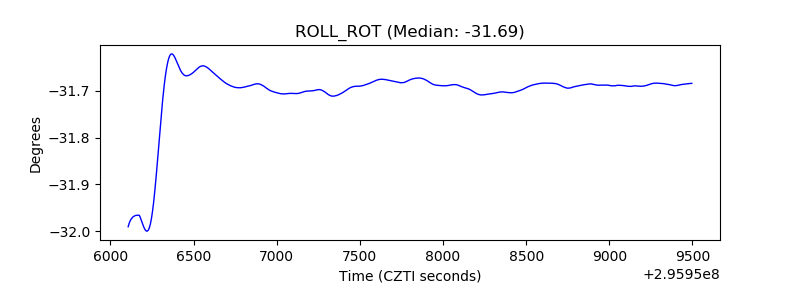 |
| _Roll_DEC | 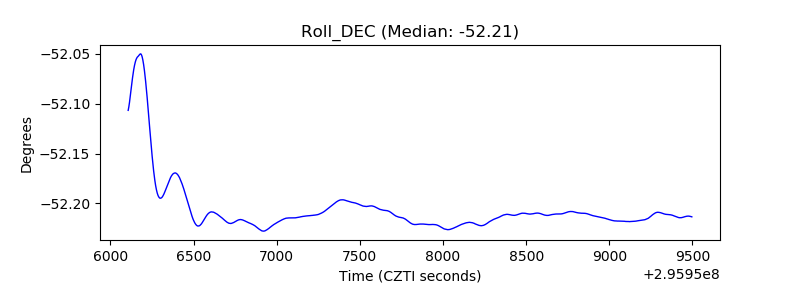 |
| _Roll_RA | 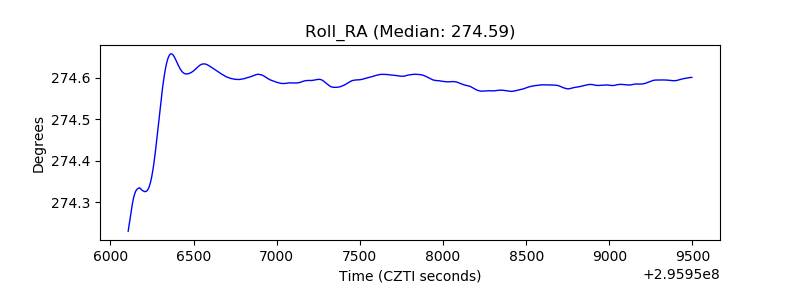 |
| Veto Counter | 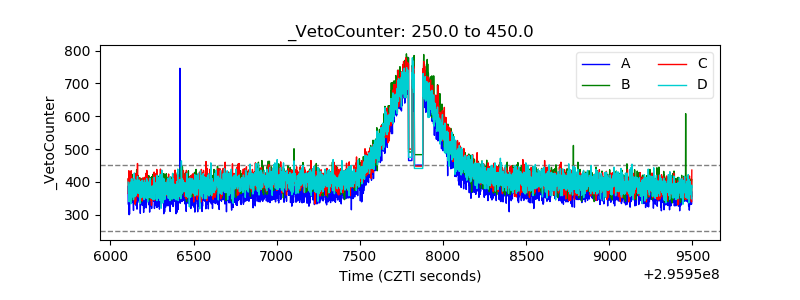 |