| Param | Original file | Final file |
|---|---|---|
| Filename | modeM0/AS1A05_025T18_9000002932_19679cztM0_level2.evt | modeM0/AS1A05_025T18_9000002932_19679cztM0_level2_quad_clean.evt |
| Size (bytes) | 1,052,138,880 | 189,322,560 |
| Size | 1003.4 MB | 180.6 MB |
| Events in quadrant A | 6,855,785 | 1,201,320 |
| Events in quadrant B | 7,678,213 | 1,208,901 |
| Events in quadrant C | 7,942,647 | 1,157,537 |
| Events in quadrant D | 8,384,503 | 1,142,749 |
| Mode M9 | |||
|---|---|---|---|
| Quadrant | BADHDUFLAG | Total packets | Discarded packets |
| A | 0 | 7 | 0 |
| B | 0 | 7 | 0 |
| C | 0 | 7 | 0 |
| D | 0 | 7 | 0 |
| Mode SS | |||
|---|---|---|---|
| Quadrant | BADHDUFLAG | Total packets | Discarded packets |
| A | 0 | 298 | 0 |
| B | 0 | 298 | 0 |
| C | 0 | 298 | 0 |
| D | 0 | 298 | 0 |
| Mode M0 | |||
|---|---|---|---|
| Quadrant | BADHDUFLAG | Total packets | Discarded packets |
| A | 0 | 30490 | 2 |
| B | 0 | 32444 | 2 |
| C | 0 | 33019 | 2 |
| D | 0 | 34879 | 2 |
| Quadrant | Total seconds | Saturated seconds | Saturation percentage |
|---|---|---|---|
| A | 14838 | 207 | 1.395067% |
| B | 14838 | 323 | 2.176843% |
| C | 14838 | 324 | 2.183583% |
| D | 14839 | 361 | 2.432778% |
Noise dominated data is calculated using 1-second bins in cleaned event files. If a bin has >2000 counts, and if more than 50% of those come from <1% of pixels, then it is considered to be noise-dominated and hence unusable.
| Quadrant | # 1 sec bins | Bins with >0 counts | Bins with >2000 counts | High rate bins dominated by noise | Noise dominated (total time) | Noise dominated (detector-on time) | Marked lightcurve |
|---|---|---|---|---|---|---|---|
| A | 15483 | 14838 | 6 | 6 | 0.04% | 0.04% | 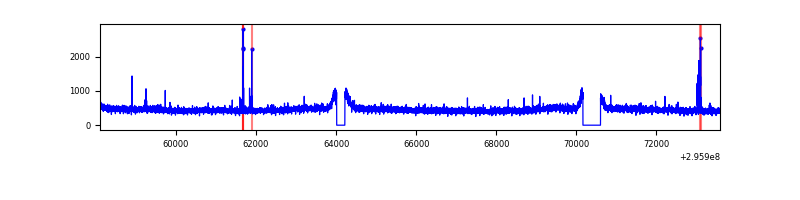 |
| B | 15483 | 14838 | 73 | 73 | 0.47% | 0.49% | 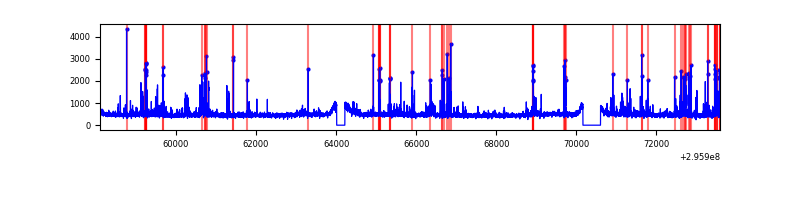 |
| C | 15483 | 14839 | 5 | 5 | 0.03% | 0.03% | 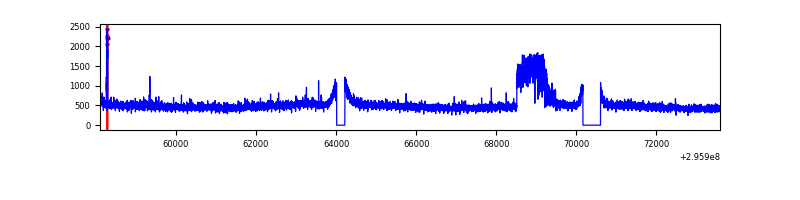 |
| D | 15484 | 14841 | 228 | 228 | 1.47% | 1.54% | 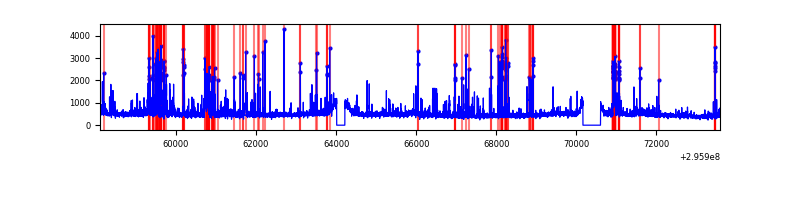 |
Top three noisy pixels from each quadrant. If the there are fewer than three noisy pixels in the level2.evt file, extra rows are filled as -1
| Pixel properties | Quadrant properties | ||||||
|---|---|---|---|---|---|---|---|
| Quadrant | DetID | PixID | Counts | Sigma | Mean | Median | Sigma |
| A | 5 | 16 | 67541 | 188.17 | 1746 | 1707 | 349.9 |
| A | 11 | 29 | 63485 | 176.58 | 1746 | 1707 | 349.9 |
| A | 0 | 226 | 15327 | 38.93 | 1746 | 1707 | 349.9 |
| B | 3 | 112 | 504871 | 1509.82 | 1736 | 1688 | 333.3 |
| B | 7 | 220 | 105700 | 312.09 | 1736 | 1688 | 333.3 |
| B | 0 | 197 | 93285 | 274.84 | 1736 | 1688 | 333.3 |
| C | 8 | 208 | 890840 | 2281.05 | 1678 | 1689 | 389.8 |
| C | 14 | 238 | 258348 | 658.44 | 1678 | 1689 | 389.8 |
| C | 3 | 233 | 167412 | 425.15 | 1678 | 1689 | 389.8 |
| D | 1 | 52 | 1160041 | 2823.67 | 1693 | 1646 | 410.2 |
| D | 12 | 218 | 461912 | 1121.93 | 1693 | 1646 | 410.2 |
| D | 1 | 20 | 147447 | 355.4 | 1693 | 1646 | 410.2 |
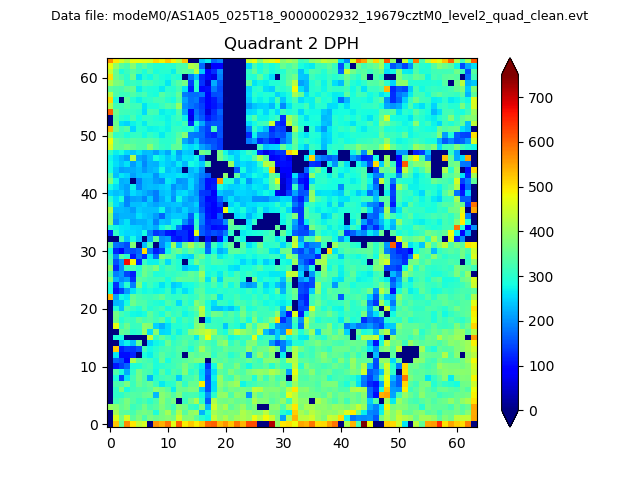
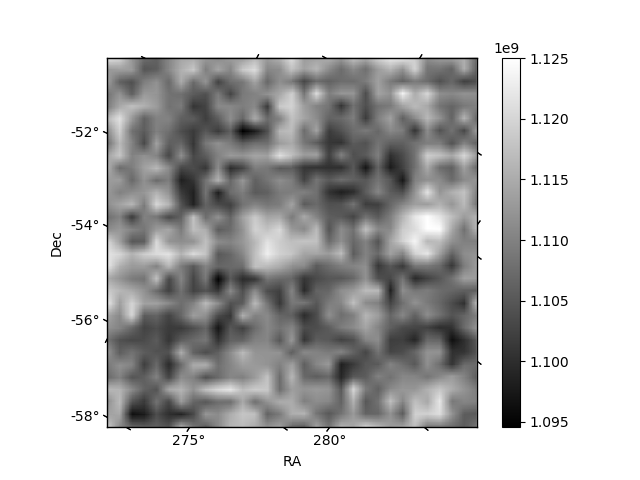
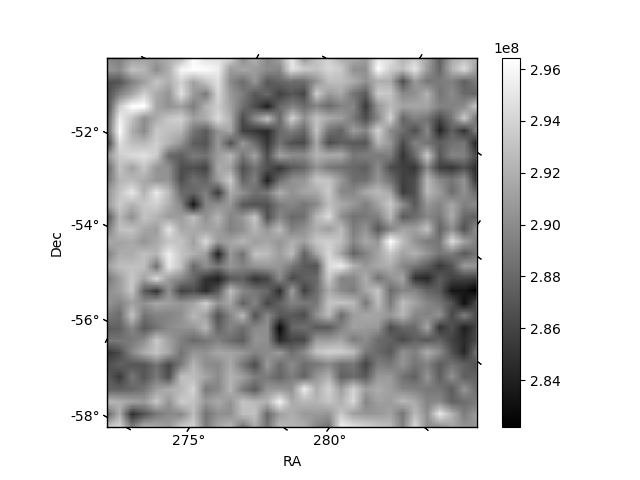
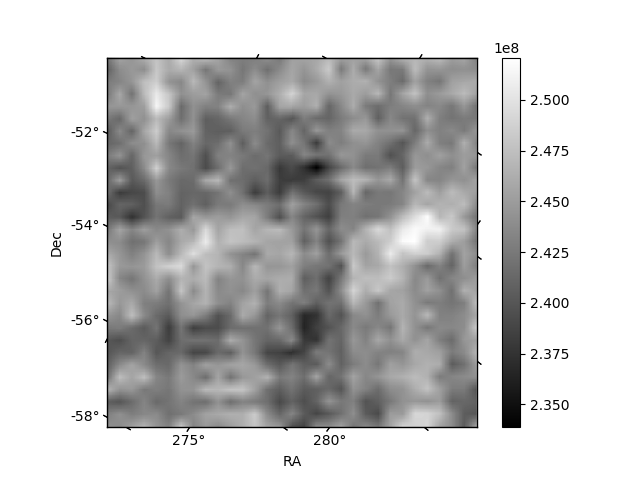
Histogram calculated using DETX and DETY for each event in the final _common_clean file
| Quadrant A | 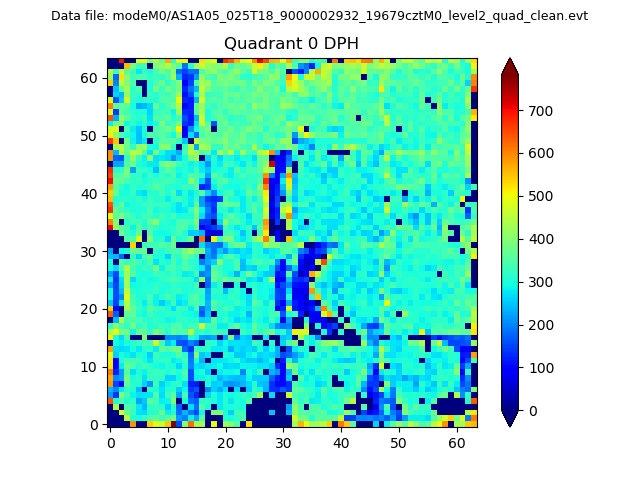 |
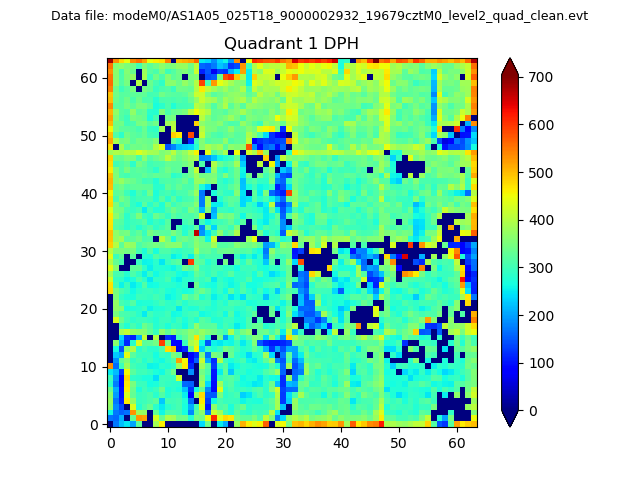 |
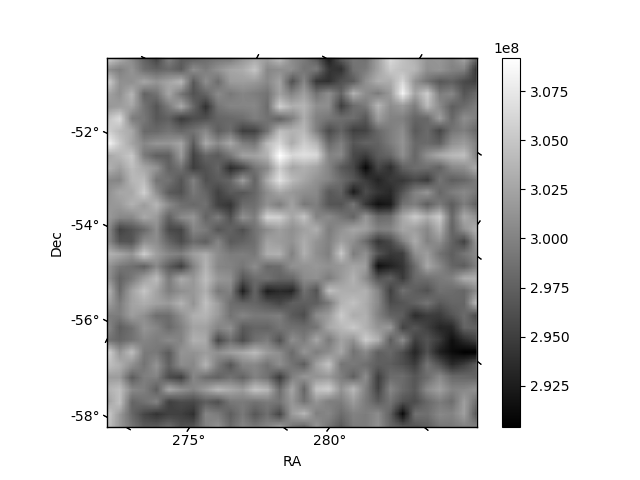
Quadrant B |
|---|---|---|---|
| Quadrant D | 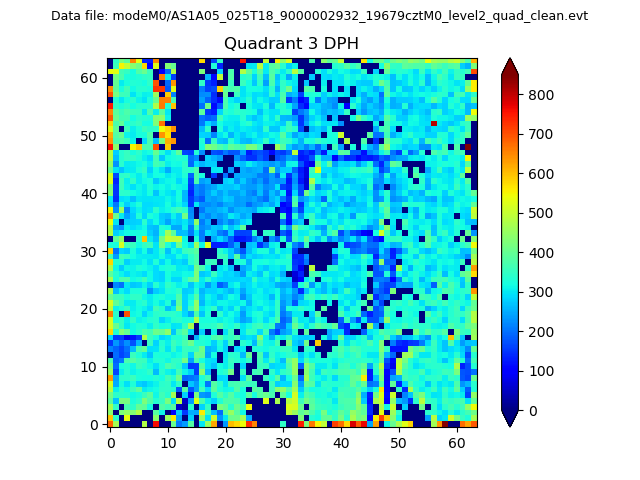 |
 |
Quadrant C |
| Plot type | Count rate plots | Images |
|---|---|---|
| Comparison with Poisson distribution Blue bars denote a histogram of data divided into 1 sec bins. Red curve is a Poisson curve with rate = median count rate of data. |
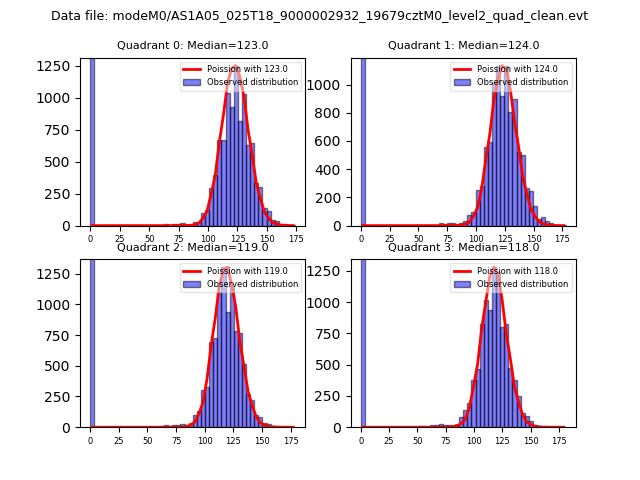 |
 |
| Quadrant-wise count rates Data is divided into 100 sec bins |
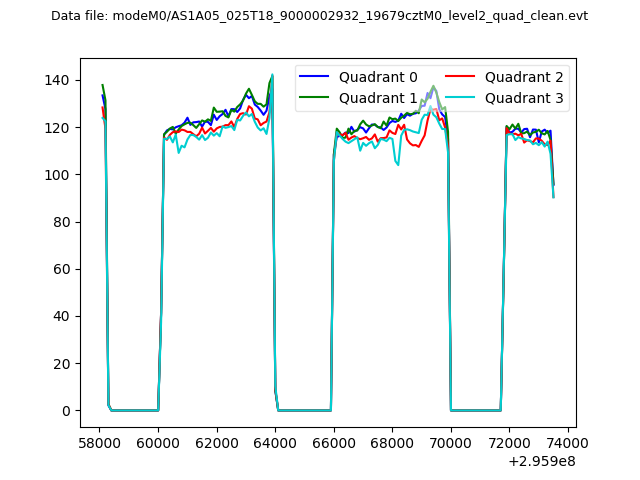 |
|
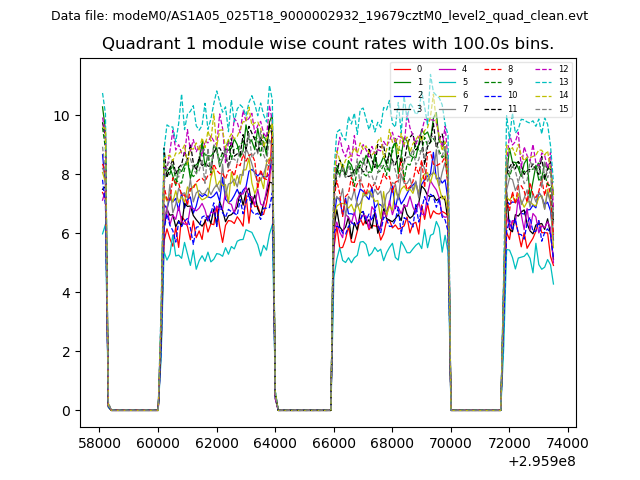
| Module-wise count rates for Quadrant A Data is divided into 100 sec bins |
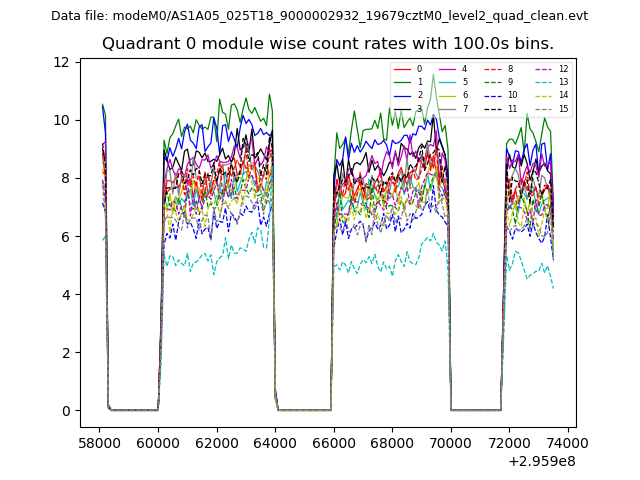 |
 |
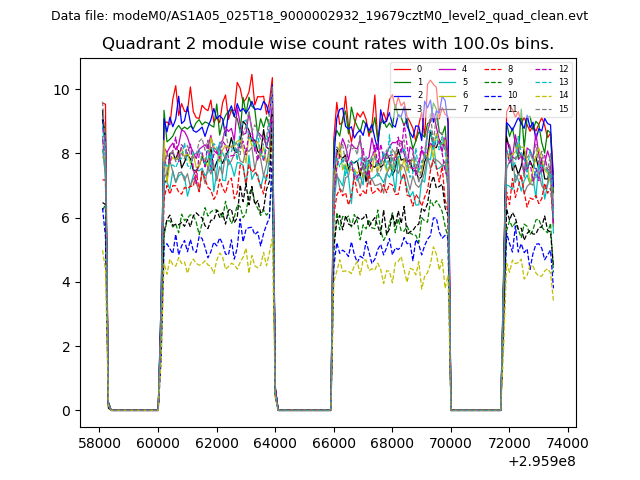
| Module-wise count rates for Quadrant B Data is divided into 100 sec bins |
 |
 |
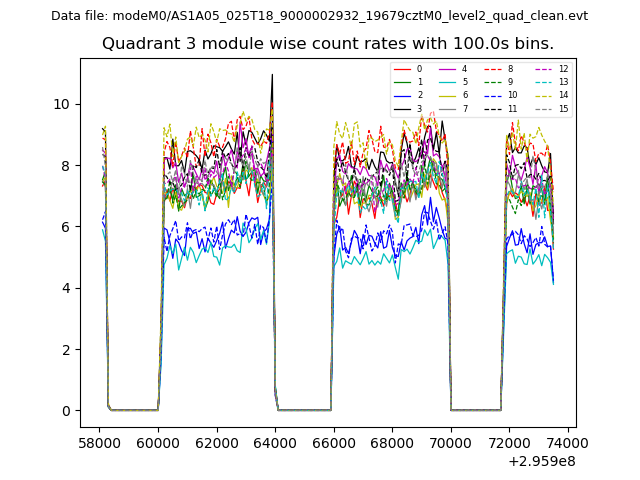
| Module-wise count rates for Quadrant C Data is divided into 100 sec bins |
 |
 |
| Module-wise count rates for Quadrant D Data is divided into 100 sec bins |
 |
 |
| Parameter | Plot |
|---|---|
| CZT HV Monitor | 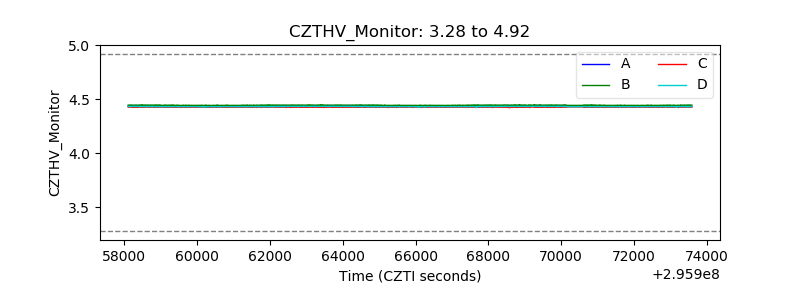 |
| D_VDD |  |
| Temperature 1 |  |
| Veto HV Monitor | 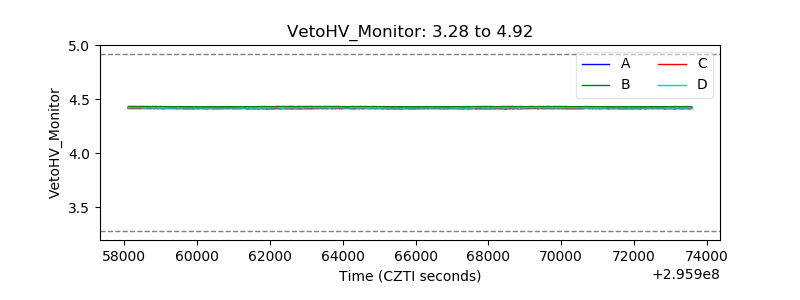 |
| Veto LLD |  |
| Alpha Counter | 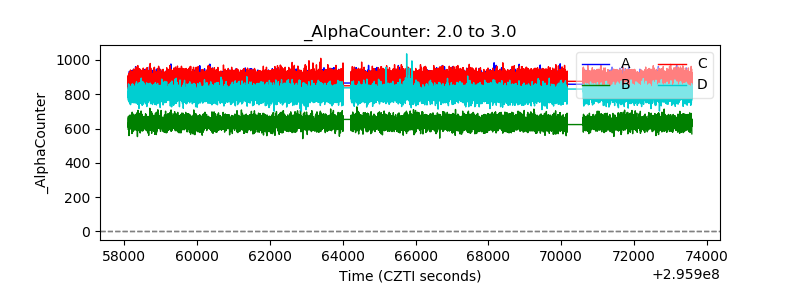 |
| _CPM_Rate | 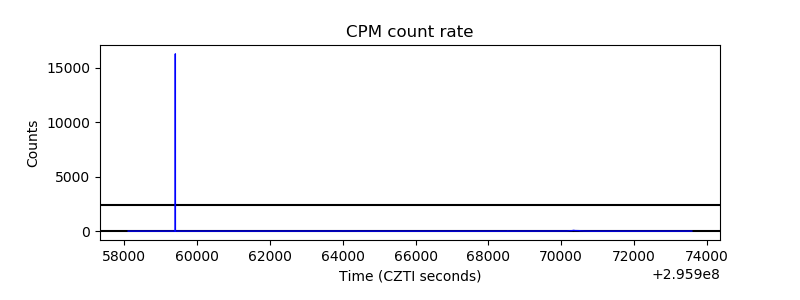 |
| CZT Counter | 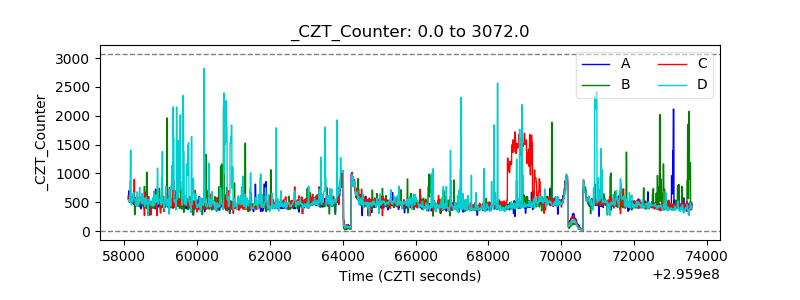 |
| +2.5 Volts monitor |  |
| +5 Volts monitor |  |
| _ROLL_ROT | 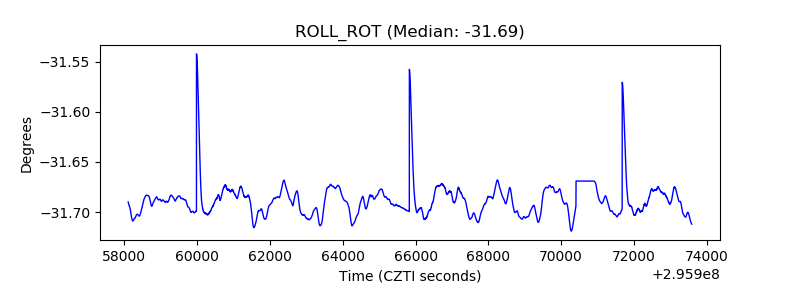 |
| _Roll_DEC | 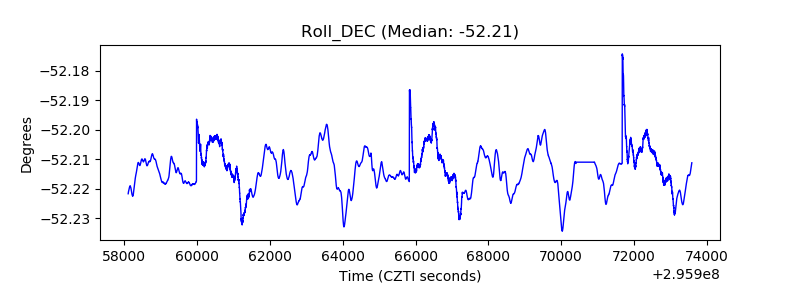 |
| _Roll_RA | 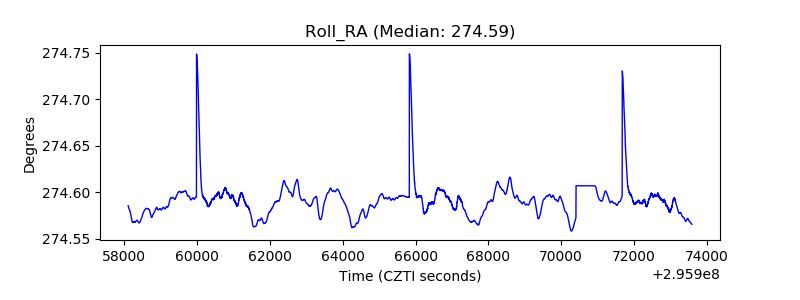 |
| Veto Counter | 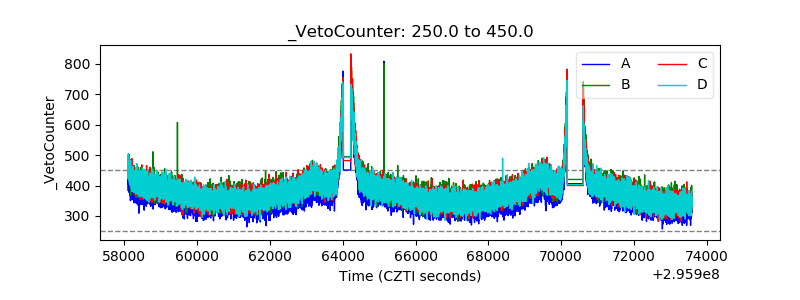 |