| Param | Original file | Final file |
|---|---|---|
| Filename | modeM0/AS1A05_212T08_9000002934cztM0_level2.fits | modeM0/AS1A05_212T08_9000002934cztM0_level2_quad_clean.evt |
| Size (bytes) | 87,891,840 | 93,283,200 |
| Size | 83.8 MB | 89.0 MB |
| Events in quadrant A | 532,456 | 575,096 |
| Events in quadrant B | 501,980 | 567,223 |
| Events in quadrant C | 522,002 | 535,408 |
| Events in quadrant D | 458,768 | 500,273 |
| Mode M0 | |||
|---|---|---|---|
| Quadrant | BADHDUFLAG | Total packets | Discarded packets |
| A | 0 | 19454 | 0 |
| B | 0 | 23065 | 0 |
| C | 0 | 19427 | 0 |
| D | 0 | 21496 | 0 |
| Mode M9 | |||
|---|---|---|---|
| Quadrant | BADHDUFLAG | Total packets | Discarded packets |
| A | 0 | 14 | 0 |
| B | 0 | 14 | 0 |
| C | 0 | 14 | 0 |
| D | 0 | 14 | 0 |
| Mode SS | |||
|---|---|---|---|
| Quadrant | BADHDUFLAG | Total packets | Discarded packets |
| A | 0 | 192 | 0 |
| B | 0 | 192 | 0 |
| C | 0 | 192 | 0 |
| D | 0 | 192 | 0 |
| Quadrant | Total seconds | Saturated seconds | Saturation percentage |
|---|---|---|---|
| A | 9316 | 124 | 1.331043% |
| B | 9316 | 460 | 4.937742% |
| C | 9316 | 166 | 1.781881% |
| D | 9316 | 196 | 2.103907% |
Noise dominated data is calculated using 1-second bins in cleaned event files. If a bin has >2000 counts, and if more than 50% of those come from <1% of pixels, then it is considered to be noise-dominated and hence unusable.
| Quadrant | # 1 sec bins | Bins with >0 counts | Bins with >2000 counts | High rate bins dominated by noise | Noise dominated (total time) | Noise dominated (detector-on time) | Marked lightcurve |
|---|---|---|---|---|---|---|---|
| A | 10756 | 9314 | 0 | 0 | 0.00% | 0.00% |  |
| B | 10756 | 9311 | 0 | 0 | 0.00% | 0.00% |  |
| C | 10756 | 9314 | 0 | 0 | 0.00% | 0.00% |  |
| D | 10756 | 9314 | 0 | 0 | 0.00% | 0.00% |  |
Top three noisy pixels from each quadrant. If the there are fewer than three noisy pixels in the level2.evt file, extra rows are filled as -1
| Pixel properties | Quadrant properties | ||||||
|---|---|---|---|---|---|---|---|
| Quadrant | DetID | PixID | Counts | Sigma | Mean | Median | Sigma |
| A | 0 | 29 | 507 | 10.21 | 138 | 129 | 37.0 |
| A | 7 | 110 | 434 | 8.24 | 138 | 129 | 37.0 |
| A | 9 | 19 | 420 | 7.86 | 138 | 129 | 37.0 |
| B | 2 | 9 | 435 | 11.01 | 132 | 126 | 28.1 |
| B | 2 | 8 | 362 | 8.41 | 132 | 126 | 28.1 |
| B | 5 | 252 | 338 | 7.56 | 132 | 126 | 28.1 |
| C | 3 | 235 | 380 | 6.87 | 137 | 128 | 36.7 |
| C | 12 | 241 | 378 | 6.82 | 137 | 128 | 36.7 |
| C | 1 | 80 | 373 | 6.68 | 137 | 128 | 36.7 |
| D | 15 | 46 | 338 | 6.05 | 130 | 119 | 36.2 |
| D | 7 | 3 | 338 | 6.05 | 130 | 119 | 36.2 |
| D | 3 | 14 | 335 | 5.97 | 130 | 119 | 36.2 |
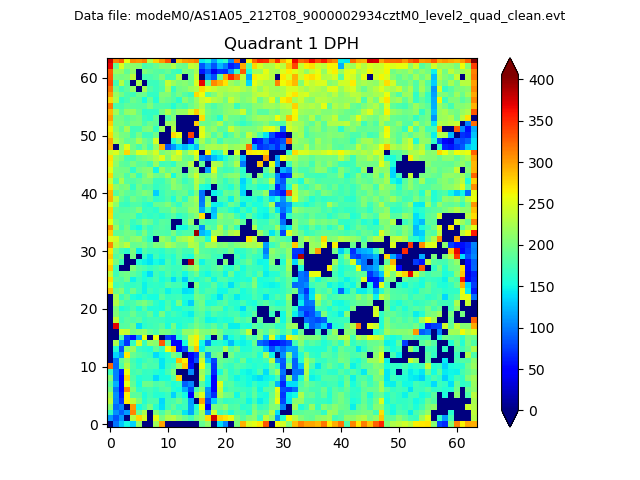
Histogram calculated using DETX and DETY for each event in the final _common_clean file
| Quadrant A |  |
 |
Quadrant B |
|---|---|---|---|
| Quadrant D | 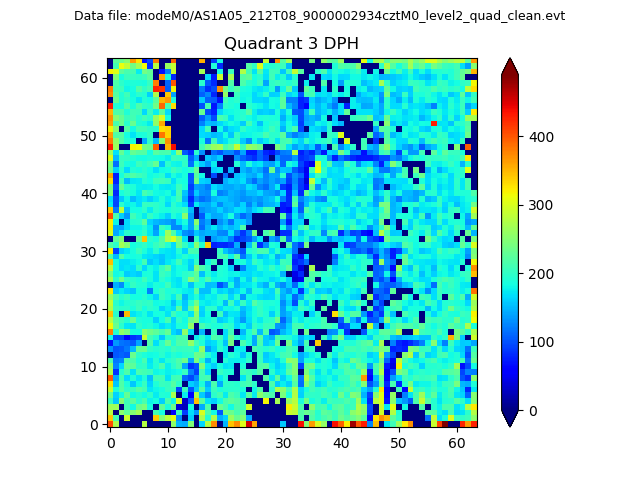 |
 |
Quadrant C |
| Plot type | Count rate plots | Images |
|---|---|---|
| Comparison with Poisson distribution Blue bars denote a histogram of data divided into 1 sec bins. Red curve is a Poisson curve with rate = median count rate of data. |
 |
 |
| Quadrant-wise count rates Data is divided into 100 sec bins |
 |
|
| Module-wise count rates for Quadrant A Data is divided into 100 sec bins |
 |
 |
| Module-wise count rates for Quadrant B Data is divided into 100 sec bins |
 |
 |
| Module-wise count rates for Quadrant C Data is divided into 100 sec bins |
 |
 |
| Module-wise count rates for Quadrant D Data is divided into 100 sec bins |
 |
 |
| Parameter | Plot |
|---|---|
| CZT HV Monitor | 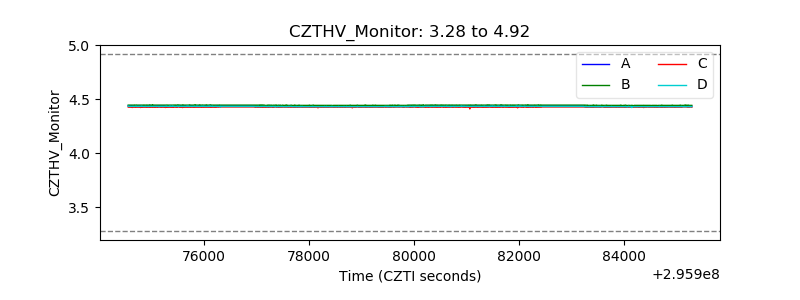 |
| D_VDD | 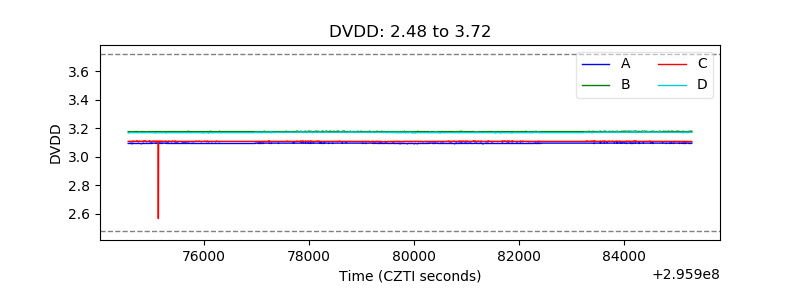 |
| Temperature 1 |  |
| Veto HV Monitor |  |
| Veto LLD | 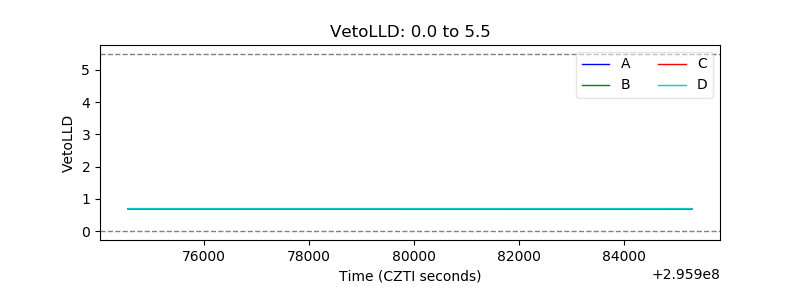 |
| Alpha Counter | 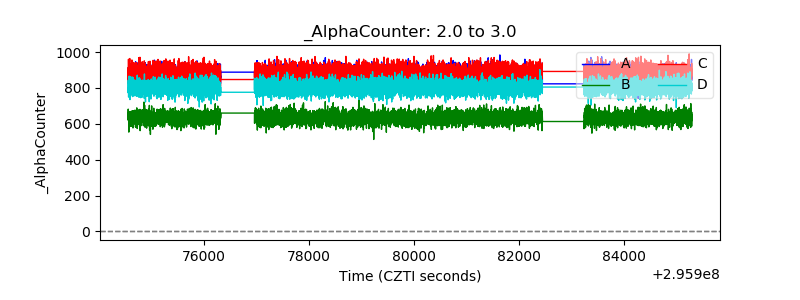 |
| _CPM_Rate |  |
| CZT Counter |  |
| +2.5 Volts monitor |  |
| +5 Volts monitor | 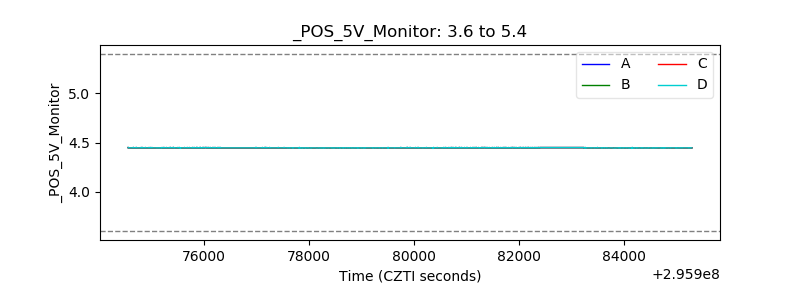 |
| _ROLL_ROT |  |
| _Roll_DEC | 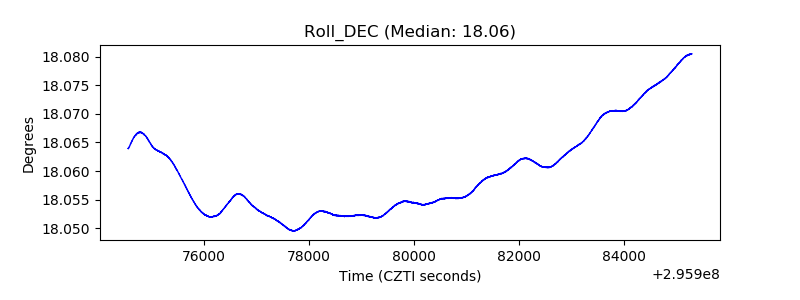 |
| _Roll_RA | 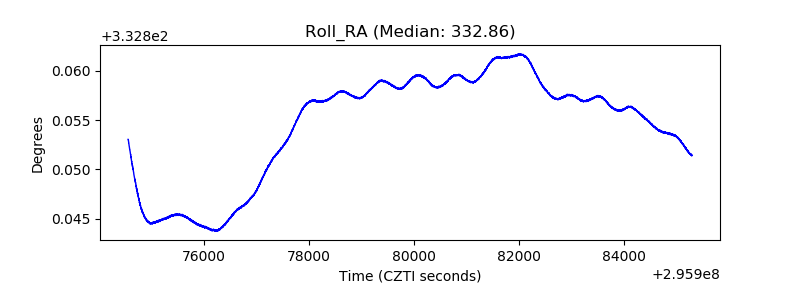 |
| Veto Counter |  |