| Param | Original file | Final file |
|---|---|---|
| Filename | modeM0/AS1A05_212T08_9000002934_19680cztM0_level2.evt | modeM0/AS1A05_212T08_9000002934_19680cztM0_level2_quad_clean.evt |
| Size (bytes) | 120,746,880 | 10,696,320 |
| Size | 115.2 MB | 10.2 MB |
| Events in quadrant A | 739,374 | 56,935 |
| Events in quadrant B | 1,333,224 | 54,059 |
| Events in quadrant C | 710,065 | 54,480 |
| Events in quadrant D | 777,676 | 54,684 |
| Mode M0 | |||
|---|---|---|---|
| Quadrant | BADHDUFLAG | Total packets | Discarded packets |
| A | 0 | 3015 | 0 |
| B | 0 | 4851 | 0 |
| C | 0 | 2866 | 0 |
| D | 0 | 3161 | 0 |
| Mode SS | |||
|---|---|---|---|
| Quadrant | BADHDUFLAG | Total packets | Discarded packets |
| A | 0 | 28 | 0 |
| B | 0 | 28 | 0 |
| C | 0 | 28 | 0 |
| D | 0 | 28 | 0 |
| Quadrant | Total seconds | Saturated seconds | Saturation percentage |
|---|---|---|---|
| A | 1378 | 19 | 1.378810% |
| B | 1378 | 234 | 16.981132% |
| C | 1379 | 9 | 0.652647% |
| D | 1379 | 25 | 1.812908% |
Noise dominated data is calculated using 1-second bins in cleaned event files. If a bin has >2000 counts, and if more than 50% of those come from <1% of pixels, then it is considered to be noise-dominated and hence unusable.
| Quadrant | # 1 sec bins | Bins with >0 counts | Bins with >2000 counts | High rate bins dominated by noise | Noise dominated (total time) | Noise dominated (detector-on time) | Marked lightcurve |
|---|---|---|---|---|---|---|---|
| A | 1378 | 1378 | 10 | 10 | 0.73% | 0.73% |  |
| B | 1378 | 1378 | 167 | 167 | 12.12% | 12.12% | 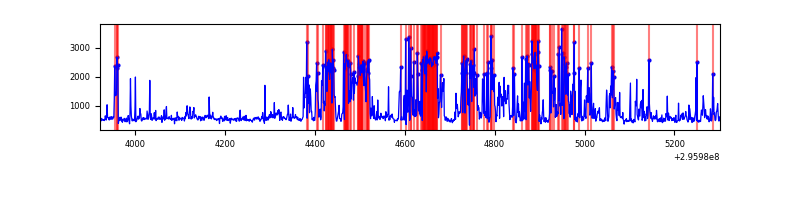 |
| C | 1379 | 1379 | 0 | 0 | 0.00% | 0.00% | 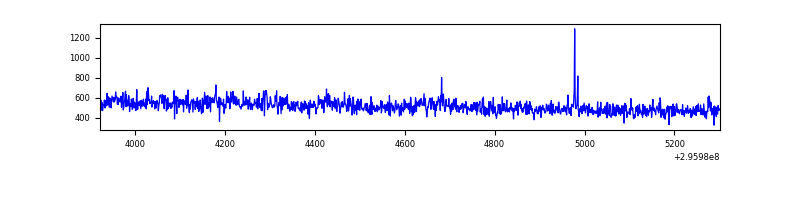 |
| D | 1379 | 1379 | 15 | 15 | 1.09% | 1.09% | 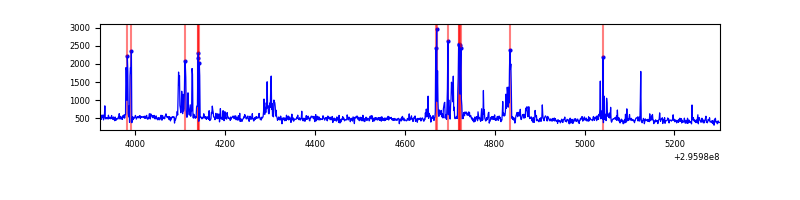 |
Top three noisy pixels from each quadrant. If the there are fewer than three noisy pixels in the level2.evt file, extra rows are filled as -1
| Pixel properties | Quadrant properties | ||||||
|---|---|---|---|---|---|---|---|
| Quadrant | DetID | PixID | Counts | Sigma | Mean | Median | Sigma |
| A | 5 | 16 | 68152 | 1870.19 | 169 | 166 | 36.4 |
| A | 11 | 29 | 11349 | 307.63 | 169 | 166 | 36.4 |
| A | 9 | 143 | 7331 | 197.1 | 169 | 166 | 36.4 |
| B | 3 | 112 | 676486 | 21026.64 | 157 | 154 | 32.2 |
| B | 4 | 216 | 13366 | 410.75 | 157 | 154 | 32.2 |
| B | 0 | 197 | 12213 | 374.91 | 157 | 154 | 32.2 |
| C | 3 | 233 | 26278 | 645.39 | 163 | 163 | 40.5 |
| C | 14 | 238 | 25698 | 631.06 | 163 | 163 | 40.5 |
| C | 8 | 208 | 14864 | 363.31 | 163 | 163 | 40.5 |
| D | 12 | 218 | 86815 | 2029.03 | 165 | 160 | 42.7 |
| D | 1 | 52 | 44587 | 1040.26 | 165 | 160 | 42.7 |
| D | 7 | 38 | 8765 | 201.49 | 165 | 160 | 42.7 |
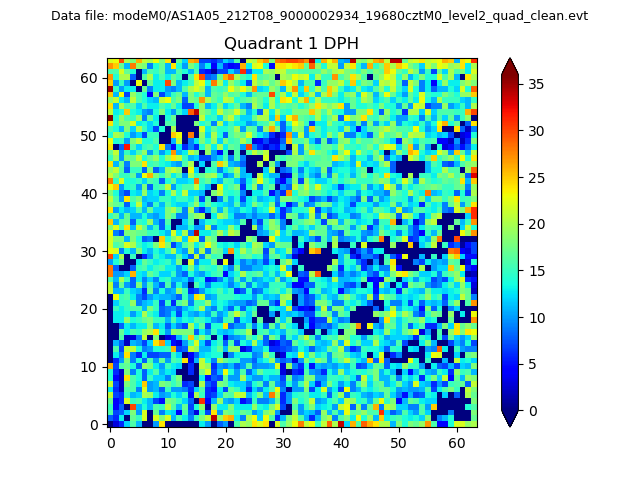
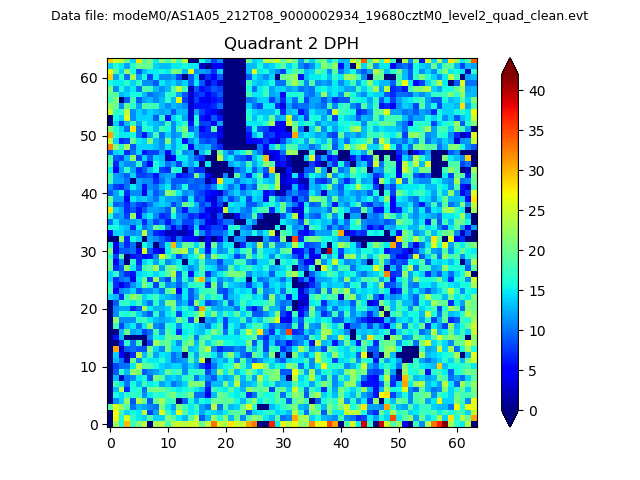
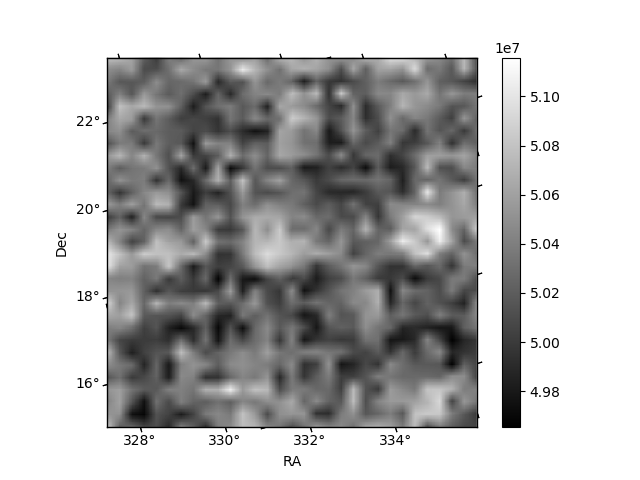
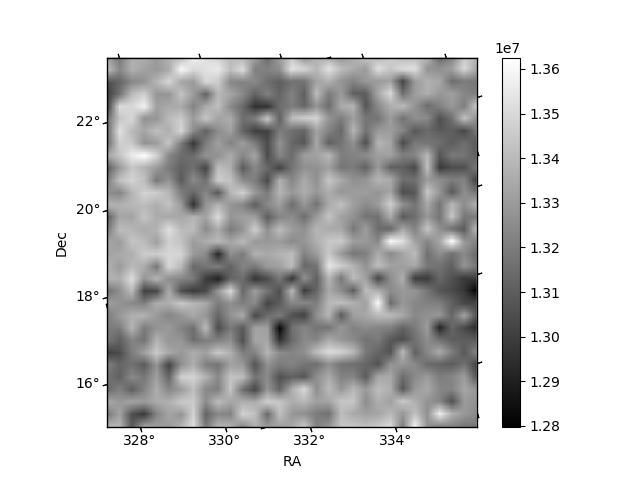
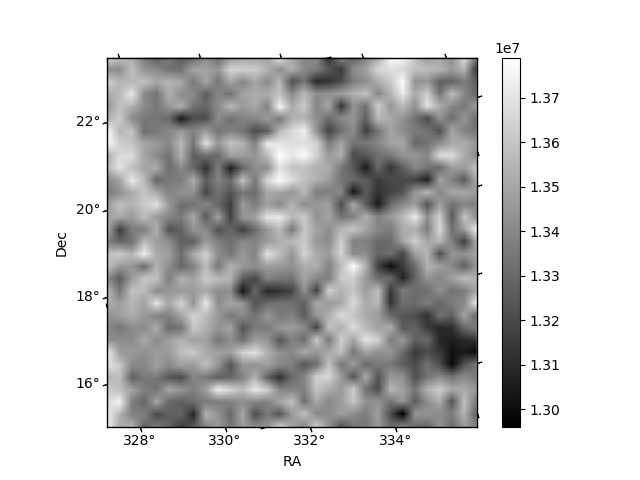
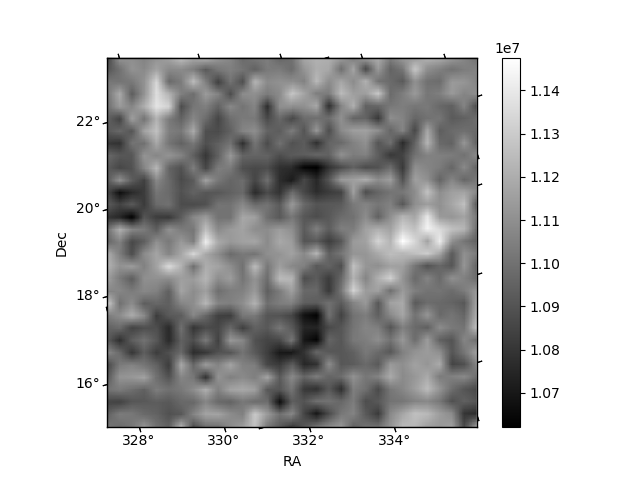
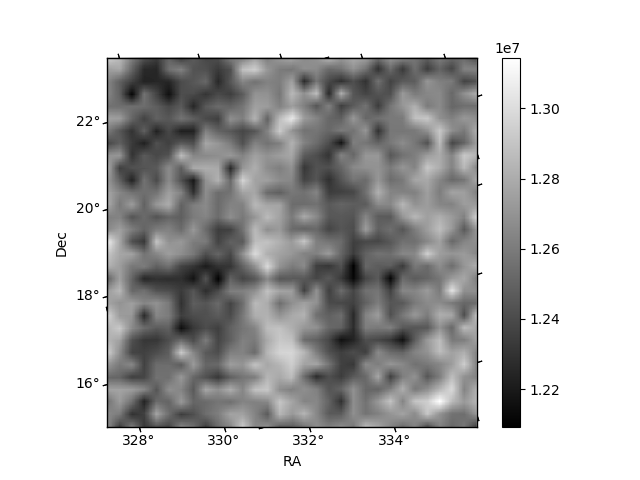
Histogram calculated using DETX and DETY for each event in the final _common_clean file
| Quadrant A | 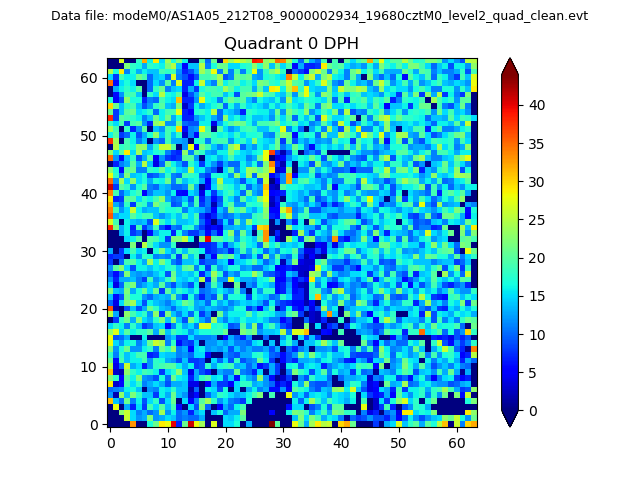 |
 |
Quadrant B |
|---|---|---|---|
| Quadrant D | 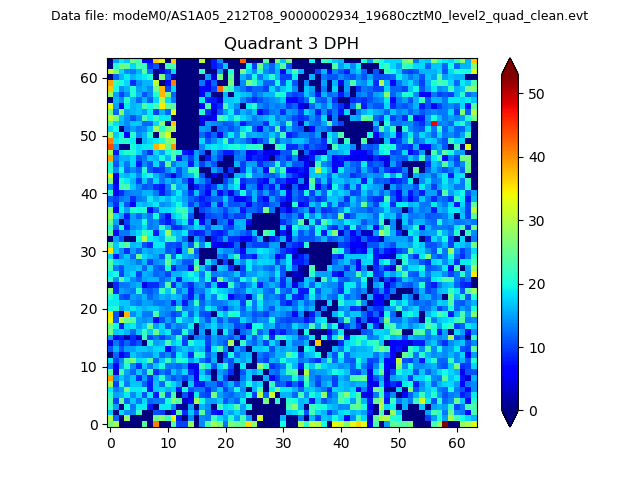 |
 |
Quadrant C |
| Plot type | Count rate plots | Images |
|---|---|---|
| Comparison with Poisson distribution Blue bars denote a histogram of data divided into 1 sec bins. Red curve is a Poisson curve with rate = median count rate of data. |
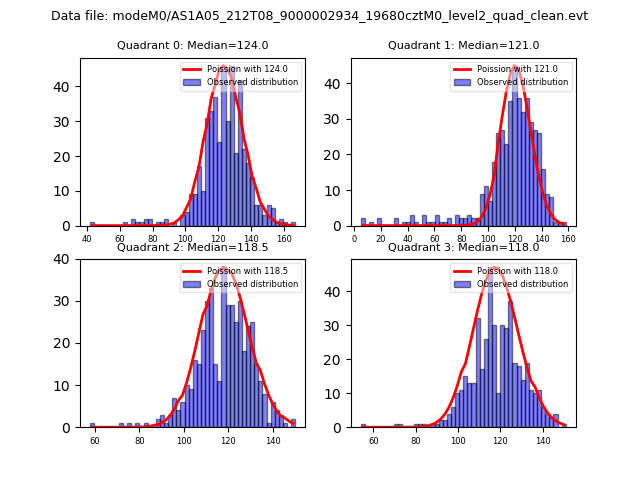 |
 |
| Quadrant-wise count rates Data is divided into 100 sec bins |
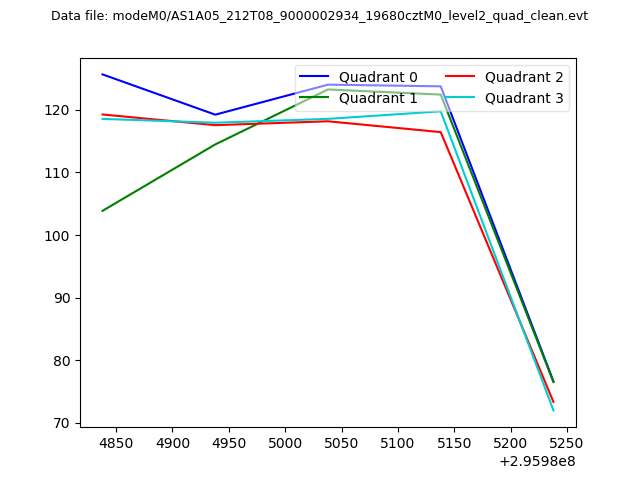 |
|
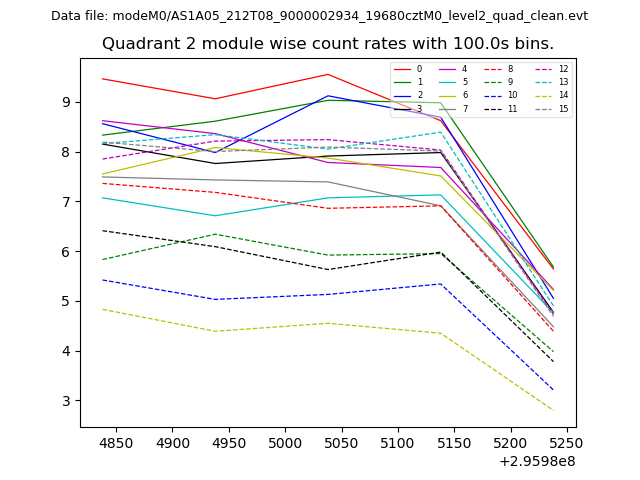
| Module-wise count rates for Quadrant A Data is divided into 100 sec bins |
 |
 |
| Module-wise count rates for Quadrant B Data is divided into 100 sec bins |
 |
 |
| Module-wise count rates for Quadrant C Data is divided into 100 sec bins |
 |
 |
| Module-wise count rates for Quadrant D Data is divided into 100 sec bins |
 |
 |
| Parameter | Plot |
|---|---|
| CZT HV Monitor |  |
| D_VDD | 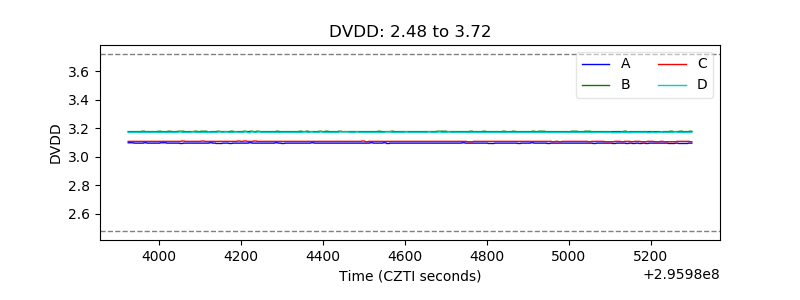 |
| Temperature 1 | 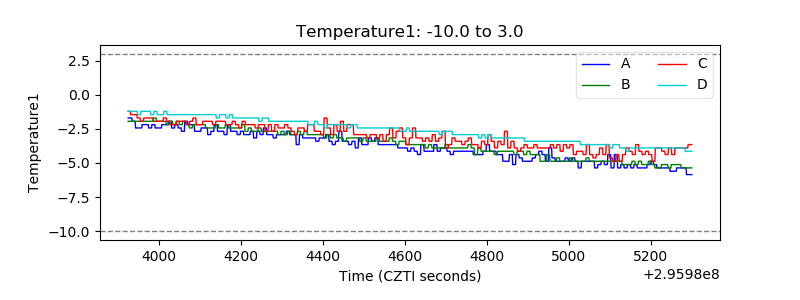 |
| Veto HV Monitor | 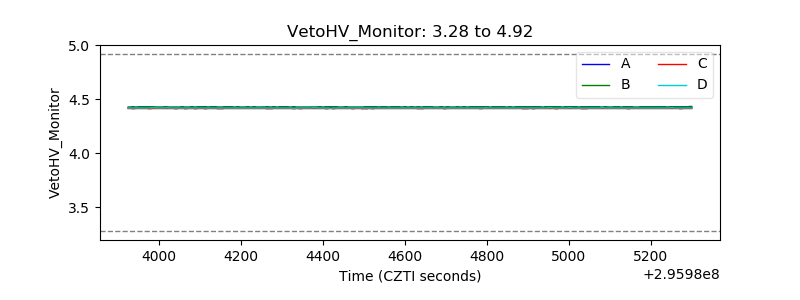 |
| Veto LLD | 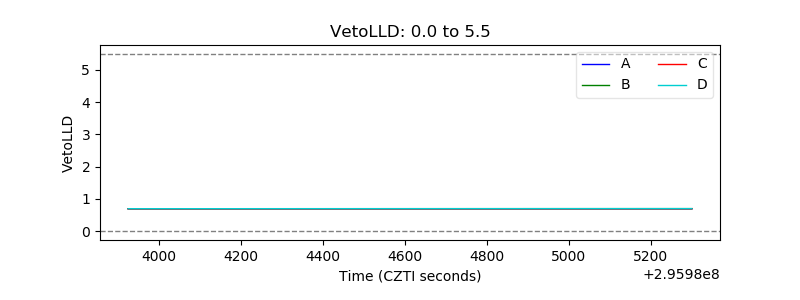 |
| Alpha Counter | 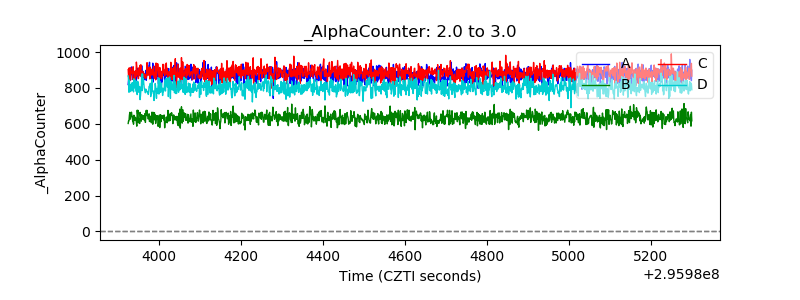 |
| _CPM_Rate | 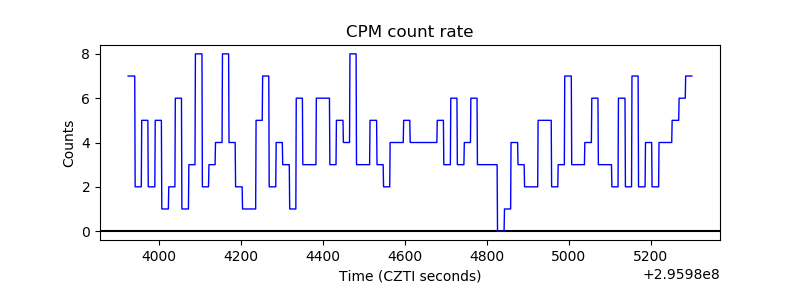 |
| CZT Counter | 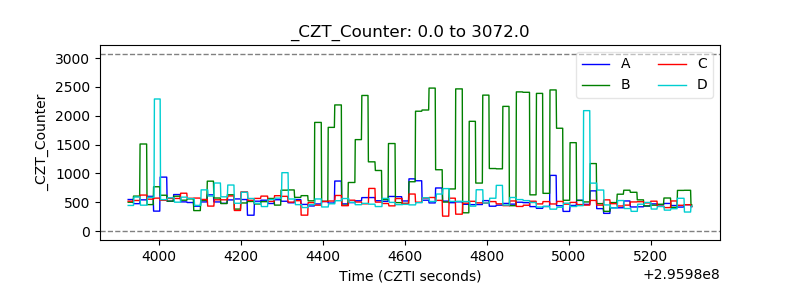 |
| +2.5 Volts monitor | 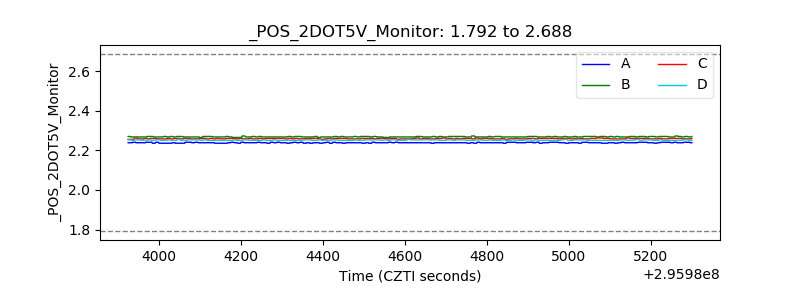 |
| +5 Volts monitor |  |
| _ROLL_ROT | 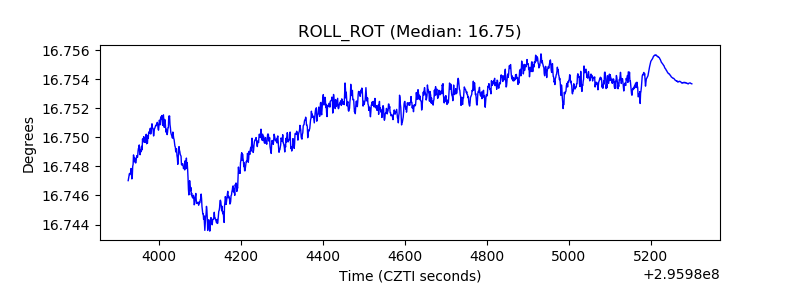 |
| _Roll_DEC | 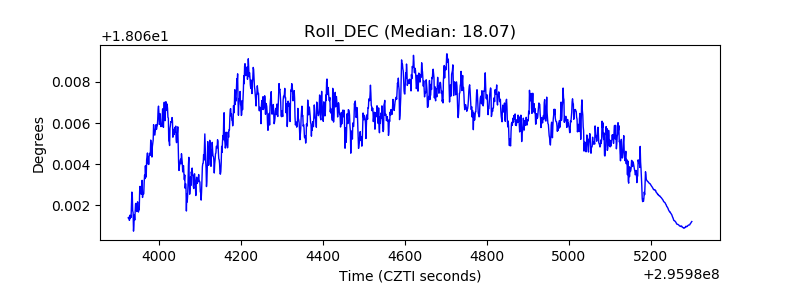 |
| _Roll_RA | 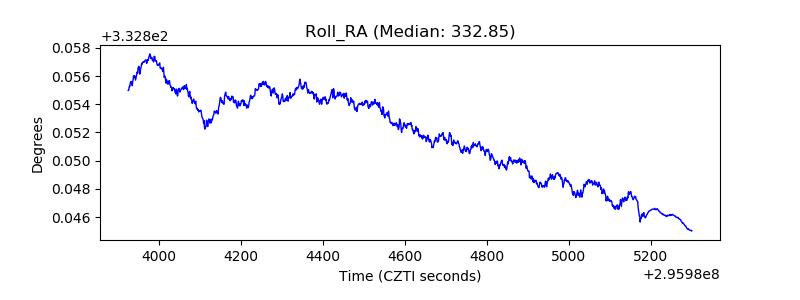 |
| Veto Counter |  |