| Param | Original file | Final file |
|---|---|---|
| Filename | modeM0/AS1A05_221T01_9000002936cztM0_level2.fits | modeM0/AS1A05_221T01_9000002936cztM0_level2_quad_clean.evt |
| Size (bytes) | 333,106,560 | 168,373,440 |
| Size | 317.7 MB | 160.6 MB |
| Events in quadrant A | 2,101,894 | 754,341 |
| Events in quadrant B | 2,008,046 | 767,105 |
| Events in quadrant C | 2,058,590 | 733,604 |
| Events in quadrant D | 1,710,572 | 632,739 |
| Mode M0 | |||
|---|---|---|---|
| Quadrant | BADHDUFLAG | Total packets | Discarded packets |
| A | 0 | 67850 | 0 |
| B | 0 | 71219 | 0 |
| C | 0 | 69553 | 0 |
| D | 0 | 87048 | 0 |
| Mode M9 | |||
|---|---|---|---|
| Quadrant | BADHDUFLAG | Total packets | Discarded packets |
| A | 0 | 73 | 0 |
| B | 0 | 73 | 0 |
| C | 0 | 73 | 0 |
| D | 0 | 73 | 0 |
| Mode SS | |||
|---|---|---|---|
| Quadrant | BADHDUFLAG | Total packets | Discarded packets |
| A | 0 | 654 | 0 |
| B | 0 | 654 | 0 |
| C | 0 | 654 | 0 |
| D | 0 | 654 | 0 |
| Quadrant | Total seconds | Saturated seconds | Saturation percentage |
|---|---|---|---|
| A | 32139 | 208 | 0.647189% |
| B | 32139 | 505 | 1.571300% |
| C | 32139 | 383 | 1.191699% |
| D | 32139 | 2503 | 7.788046% |
Noise dominated data is calculated using 1-second bins in cleaned event files. If a bin has >2000 counts, and if more than 50% of those come from <1% of pixels, then it is considered to be noise-dominated and hence unusable.
| Quadrant | # 1 sec bins | Bins with >0 counts | Bins with >2000 counts | High rate bins dominated by noise | Noise dominated (total time) | Noise dominated (detector-on time) | Marked lightcurve |
|---|---|---|---|---|---|---|---|
| A | 39464 | 32137 | 0 | 0 | 0.00% | 0.00% | 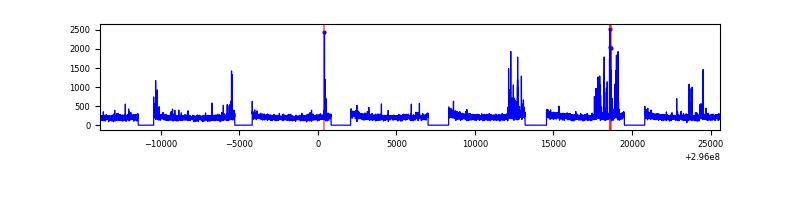 |
| B | 39464 | 32129 | 0 | 0 | 0.00% | 0.00% | 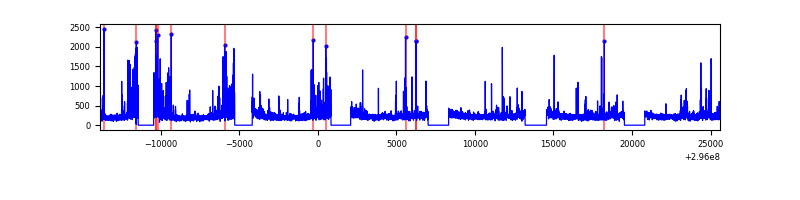 |
| C | 39464 | 32136 | 0 | 0 | 0.00% | 0.00% | 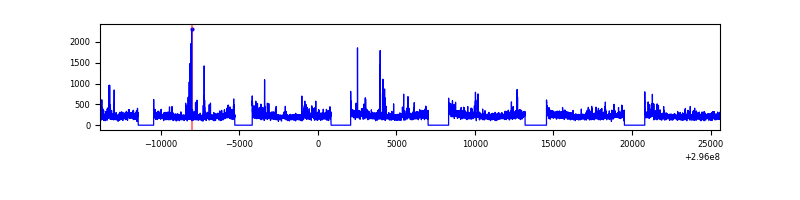 |
| D | 39464 | 31340 | 0 | 0 | 0.00% | 0.00% | 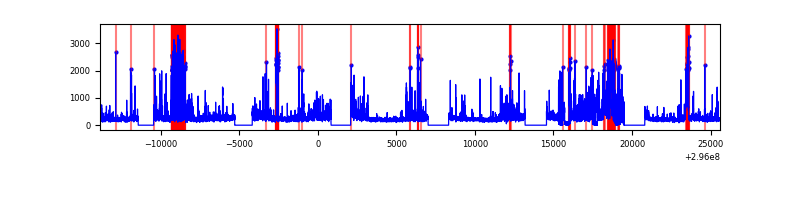 |
Top three noisy pixels from each quadrant. If the there are fewer than three noisy pixels in the level2.evt file, extra rows are filled as -1
| Pixel properties | Quadrant properties | ||||||
|---|---|---|---|---|---|---|---|
| Quadrant | DetID | PixID | Counts | Sigma | Mean | Median | Sigma |
| A | 0 | 29 | 2016 | 11.22 | 547 | 517 | 133.5 |
| A | 7 | 110 | 1711 | 8.94 | 547 | 517 | 133.5 |
| A | 9 | 19 | 1654 | 8.51 | 547 | 517 | 133.5 |
| B | 2 | 9 | 1584 | 10.37 | 530 | 508 | 103.8 |
| B | 2 | 8 | 1402 | 8.61 | 530 | 508 | 103.8 |
| B | 5 | 128 | 1314 | 7.77 | 530 | 508 | 103.8 |
| C | 1 | 81 | 1609 | 7.84 | 543 | 512 | 139.9 |
| C | 1 | 80 | 1565 | 7.53 | 543 | 512 | 139.9 |
| C | 3 | 126 | 1478 | 6.91 | 543 | 512 | 139.9 |
| D | 6 | 67 | 1255 | 6.23 | 489 | 448 | 129.4 |
| D | 10 | 189 | 1228 | 6.03 | 489 | 448 | 129.4 |
| D | 7 | 3 | 1208 | 5.87 | 489 | 448 | 129.4 |
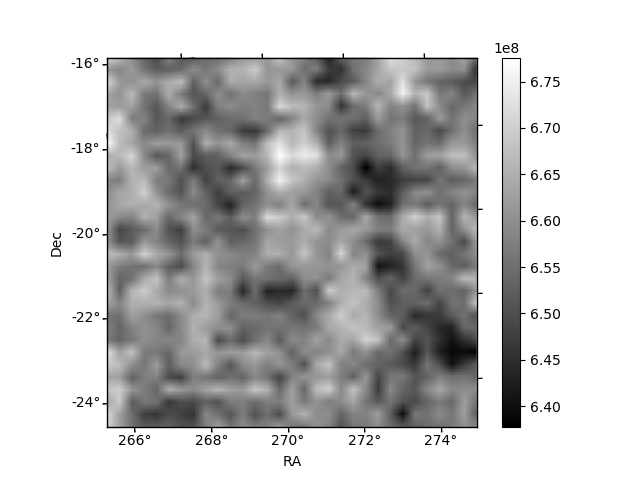
Histogram calculated using DETX and DETY for each event in the final _common_clean file
| Quadrant A | 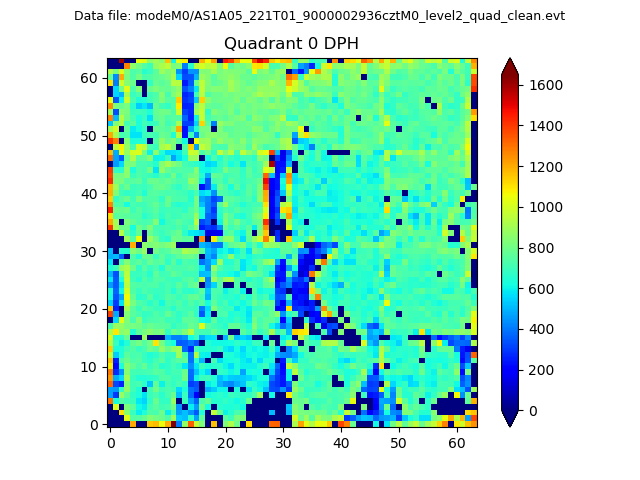 |
 |
Quadrant B |
|---|---|---|---|
| Quadrant D | 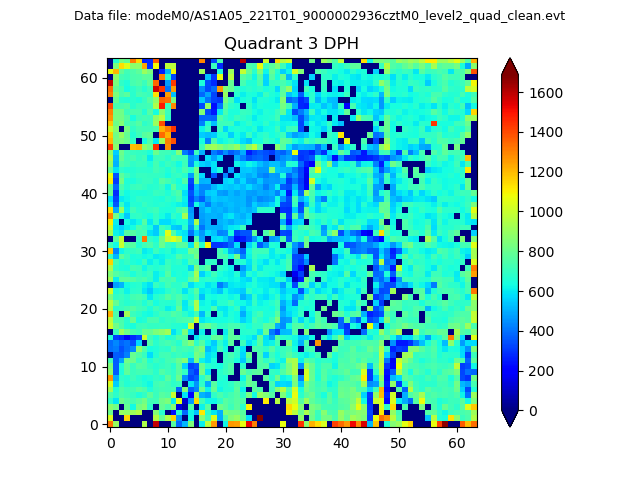 |
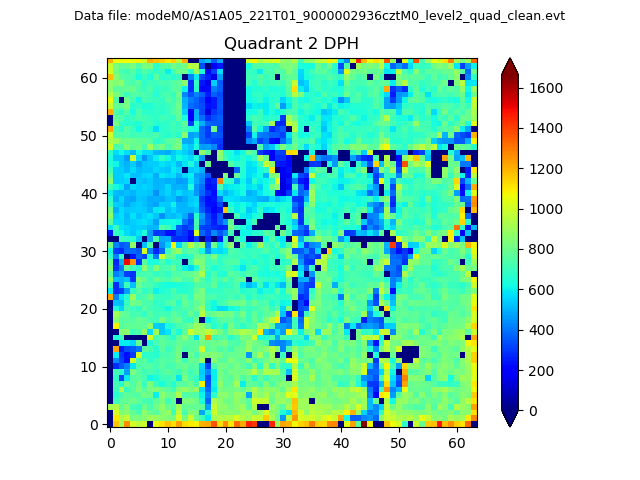 |
Quadrant C |
| Plot type | Count rate plots | Images |
|---|---|---|
| Comparison with Poisson distribution Blue bars denote a histogram of data divided into 1 sec bins. Red curve is a Poisson curve with rate = median count rate of data. |
 |
 |
| Quadrant-wise count rates Data is divided into 100 sec bins |
 |
|
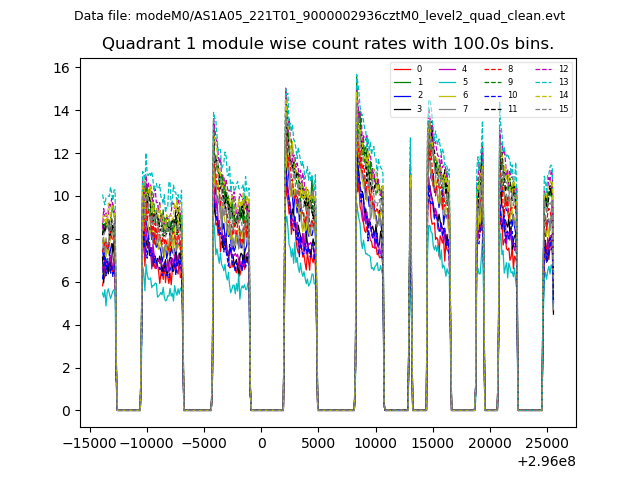
| Module-wise count rates for Quadrant A Data is divided into 100 sec bins |
 |
 |
| Module-wise count rates for Quadrant B Data is divided into 100 sec bins |
 |
 |
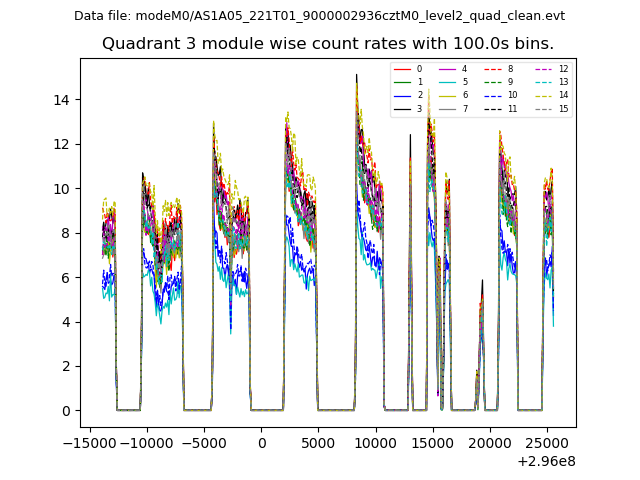
| Module-wise count rates for Quadrant C Data is divided into 100 sec bins |
 |
 |
| Module-wise count rates for Quadrant D Data is divided into 100 sec bins |
 |
 |
| Parameter | Plot |
|---|---|
| CZT HV Monitor |  |
| D_VDD |  |
| Temperature 1 |  |
| Veto HV Monitor | 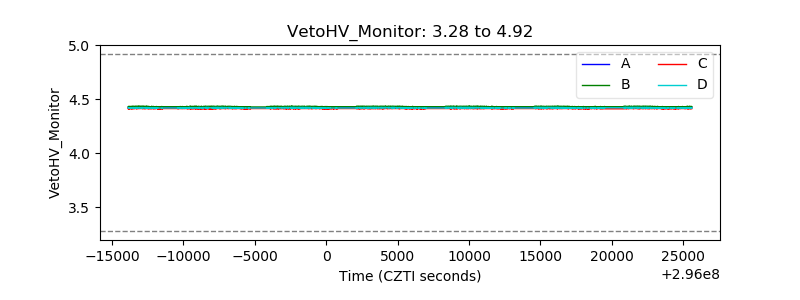 |
| Veto LLD |  |
| Alpha Counter |  |
| _CPM_Rate |  |
| CZT Counter |  |
| +2.5 Volts monitor |  |
| +5 Volts monitor |  |
| _ROLL_ROT | 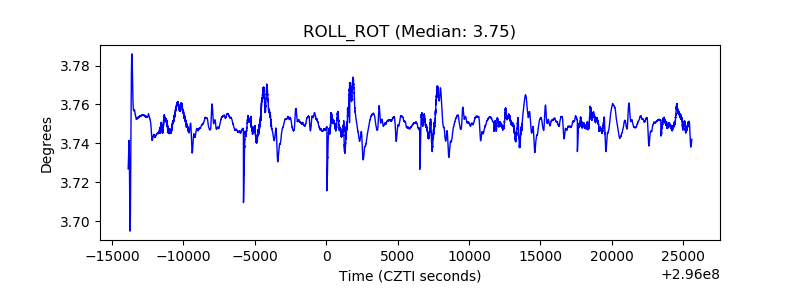 |
| _Roll_DEC |  |
| _Roll_RA | 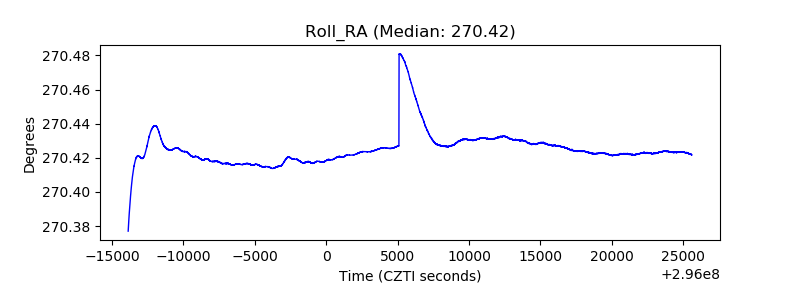 |
| Veto Counter | 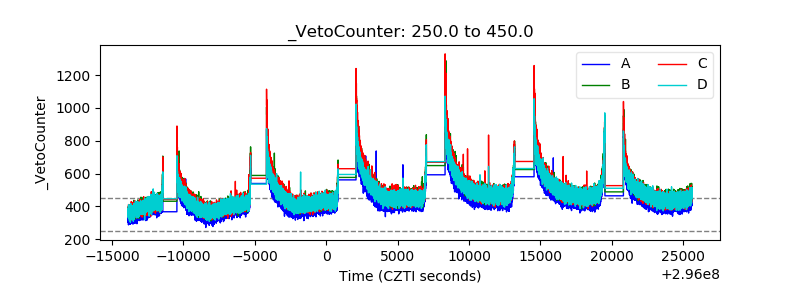 |