| Param | Original file | Final file |
|---|---|---|
| Filename | modeM0/AS1A05_221T01_9000002936_19680cztM0_level2.evt | modeM0/AS1A05_221T01_9000002936_19680cztM0_level2_quad_clean.evt |
| Size (bytes) | 290,885,760 | 53,651,520 |
| Size | 277.4 MB | 51.2 MB |
| Events in quadrant A | 1,897,200 | 341,236 |
| Events in quadrant B | 2,301,926 | 348,577 |
| Events in quadrant C | 2,014,940 | 338,569 |
| Events in quadrant D | 2,332,323 | 323,865 |
| Mode M0 | |||
|---|---|---|---|
| Quadrant | BADHDUFLAG | Total packets | Discarded packets |
| A | 0 | 8005 | 1 |
| B | 0 | 9371 | 1 |
| C | 0 | 8236 | 1 |
| D | 0 | 9381 | 1 |
| Mode M9 | |||
|---|---|---|---|
| Quadrant | BADHDUFLAG | Total packets | Discarded packets |
| A | 0 | 10 | 0 |
| B | 0 | 10 | 0 |
| C | 0 | 10 | 0 |
| D | 0 | 10 | 0 |
| Mode SS | |||
|---|---|---|---|
| Quadrant | BADHDUFLAG | Total packets | Discarded packets |
| A | 0 | 78 | 0 |
| B | 0 | 78 | 0 |
| C | 0 | 78 | 0 |
| D | 0 | 78 | 0 |
| Quadrant | Total seconds | Saturated seconds | Saturation percentage |
|---|---|---|---|
| A | 3857 | 15 | 0.388903% |
| B | 3856 | 145 | 3.760373% |
| C | 3856 | 35 | 0.907676% |
| D | 3856 | 141 | 3.656639% |
Noise dominated data is calculated using 1-second bins in cleaned event files. If a bin has >2000 counts, and if more than 50% of those come from <1% of pixels, then it is considered to be noise-dominated and hence unusable.
| Quadrant | # 1 sec bins | Bins with >0 counts | Bins with >2000 counts | High rate bins dominated by noise | Noise dominated (total time) | Noise dominated (detector-on time) | Marked lightcurve |
|---|---|---|---|---|---|---|---|
| A | 4842 | 3858 | 0 | 0 | 0.00% | 0.00% |  |
| B | 4841 | 3857 | 58 | 58 | 1.20% | 1.50% | 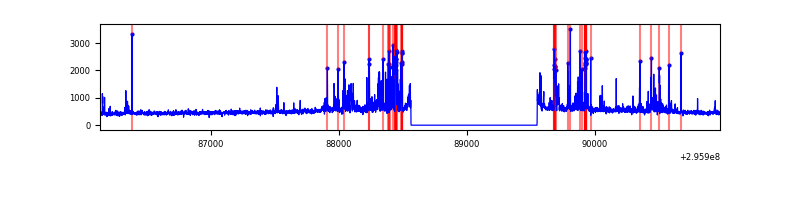 |
| C | 4841 | 3856 | 0 | 0 | 0.00% | 0.00% | 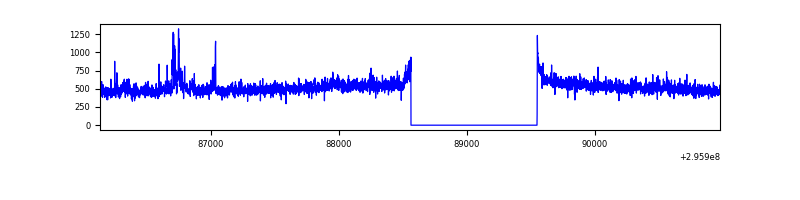 |
| D | 4840 | 3856 | 131 | 131 | 2.71% | 3.40% | 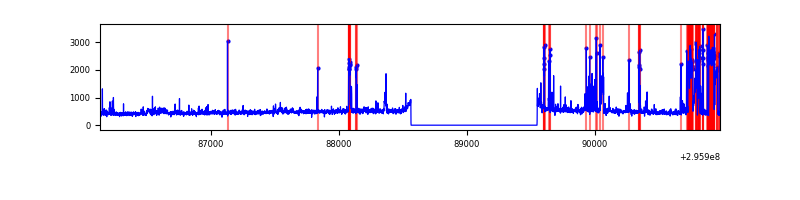 |
Top three noisy pixels from each quadrant. If the there are fewer than three noisy pixels in the level2.evt file, extra rows are filled as -1
| Pixel properties | Quadrant properties | ||||||
|---|---|---|---|---|---|---|---|
| Quadrant | DetID | PixID | Counts | Sigma | Mean | Median | Sigma |
| A | 11 | 29 | 20568 | 201.2 | 485 | 475 | 99.9 |
| A | 5 | 16 | 10650 | 101.89 | 485 | 475 | 99.9 |
| A | 0 | 226 | 4265 | 37.95 | 485 | 475 | 99.9 |
| B | 3 | 112 | 388913 | 4170.48 | 478 | 465 | 93.1 |
| B | 4 | 216 | 16724 | 174.56 | 478 | 465 | 93.1 |
| B | 0 | 230 | 12449 | 128.66 | 478 | 465 | 93.1 |
| C | 3 | 233 | 75752 | 678.93 | 468 | 474 | 110.9 |
| C | 14 | 238 | 72710 | 651.5 | 468 | 474 | 110.9 |
| C | 8 | 208 | 21374 | 188.5 | 468 | 474 | 110.9 |
| D | 1 | 52 | 360990 | 3143.88 | 471 | 459 | 114.7 |
| D | 12 | 218 | 118388 | 1028.36 | 471 | 459 | 114.7 |
| D | 2 | 16 | 41132 | 354.67 | 471 | 459 | 114.7 |
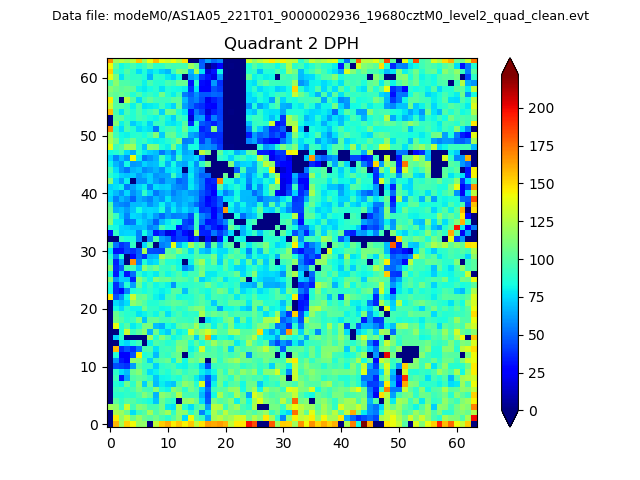
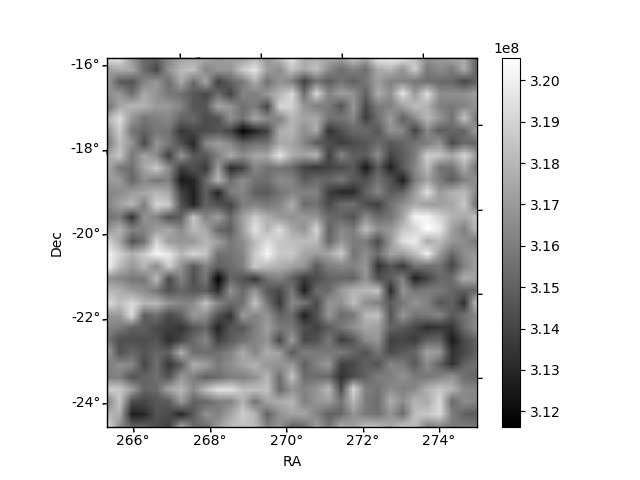
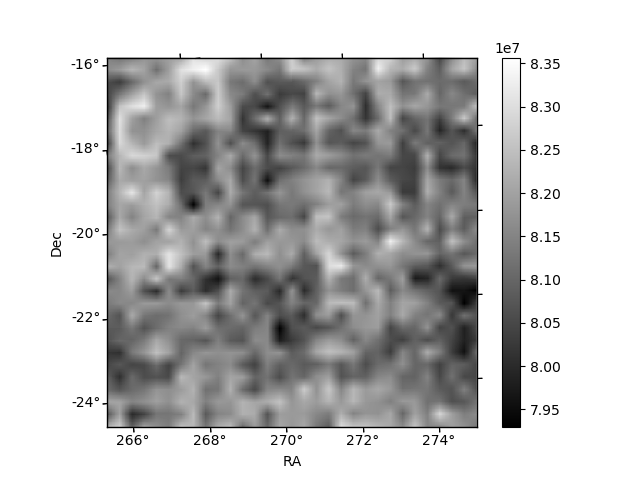
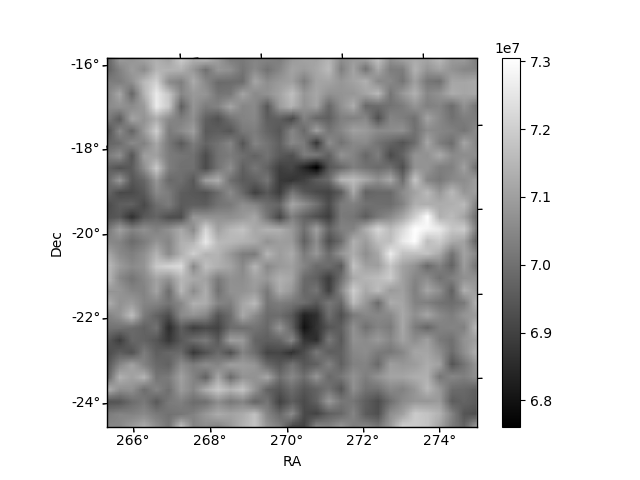
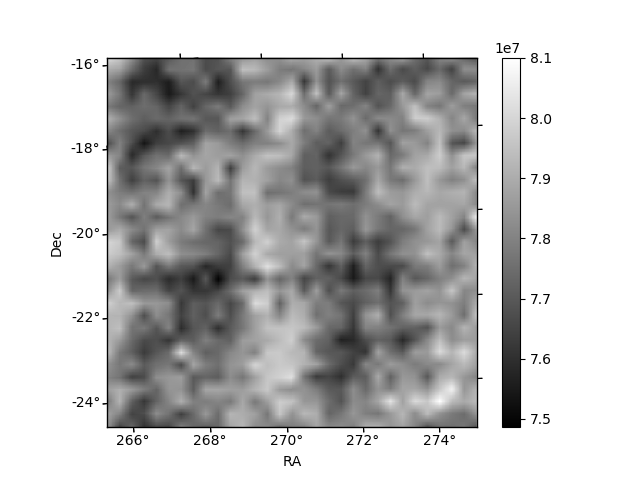
Histogram calculated using DETX and DETY for each event in the final _common_clean file
| Quadrant A |  |
 |
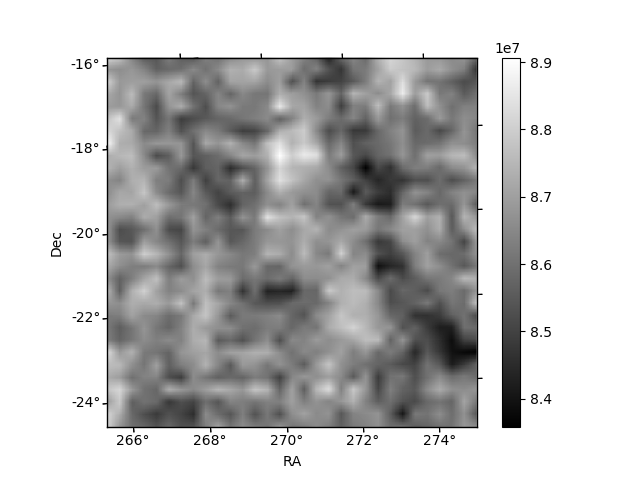
Quadrant B |
|---|---|---|---|
| Quadrant D |  |
 |
Quadrant C |
| Plot type | Count rate plots | Images |
|---|---|---|
| Comparison with Poisson distribution Blue bars denote a histogram of data divided into 1 sec bins. Red curve is a Poisson curve with rate = median count rate of data. |
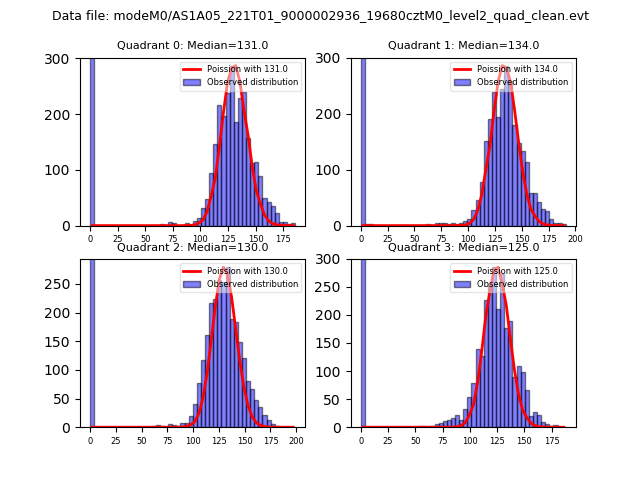 |
 |
| Quadrant-wise count rates Data is divided into 100 sec bins |
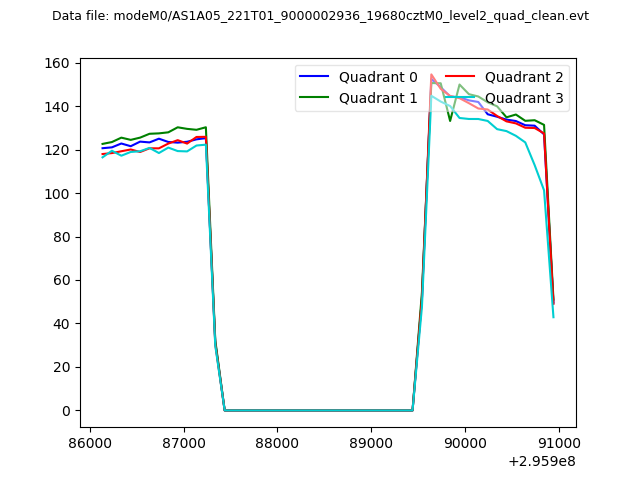 |
|
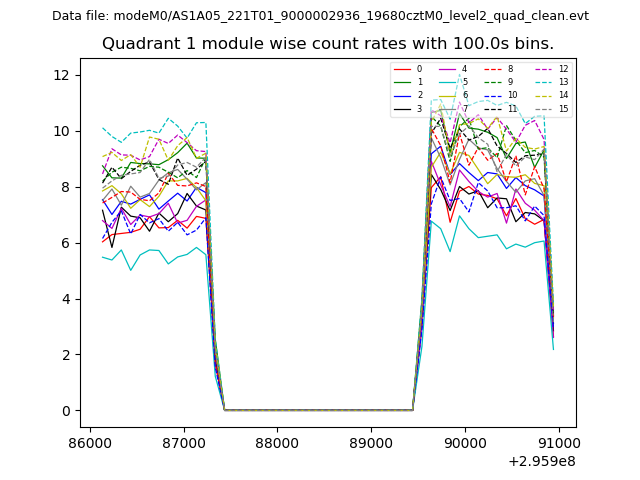
| Module-wise count rates for Quadrant A Data is divided into 100 sec bins |
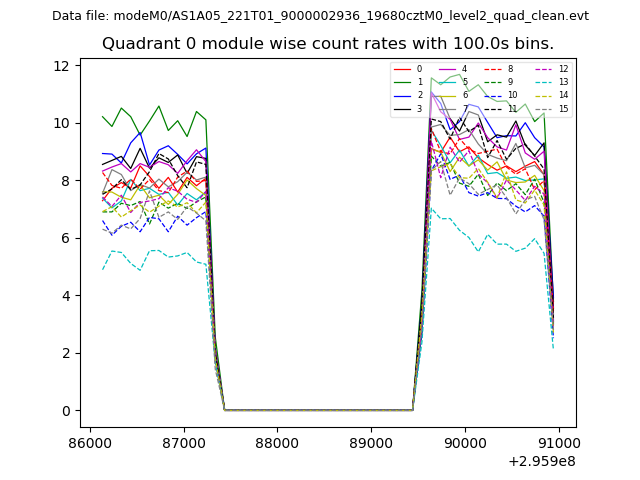 |
 |
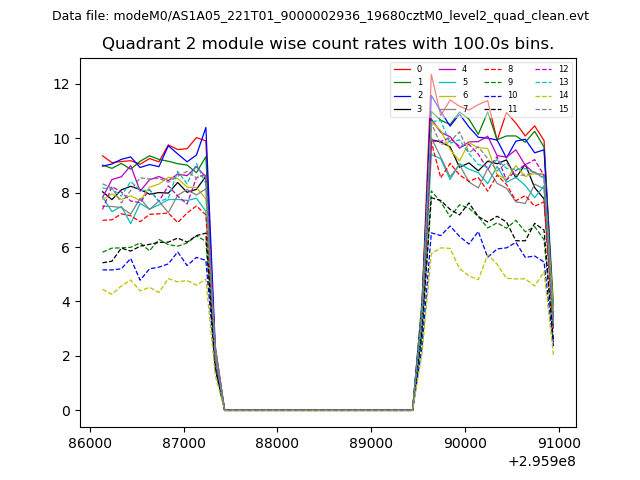
| Module-wise count rates for Quadrant B Data is divided into 100 sec bins |
 |
 |
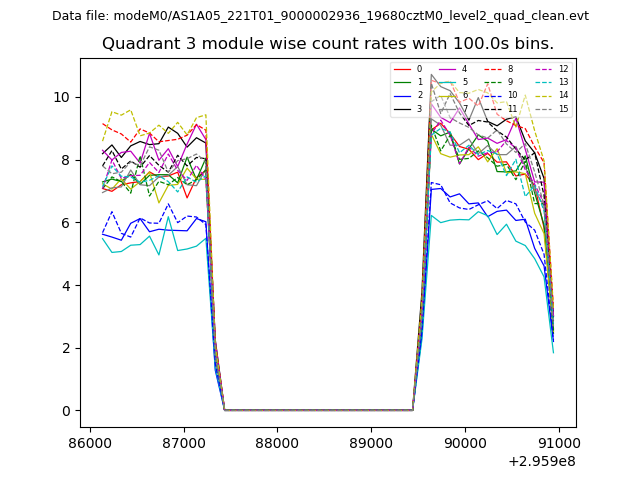
| Module-wise count rates for Quadrant C Data is divided into 100 sec bins |
 |
 |
| Module-wise count rates for Quadrant D Data is divided into 100 sec bins |
 |
 |
| Parameter | Plot |
|---|---|
| CZT HV Monitor | 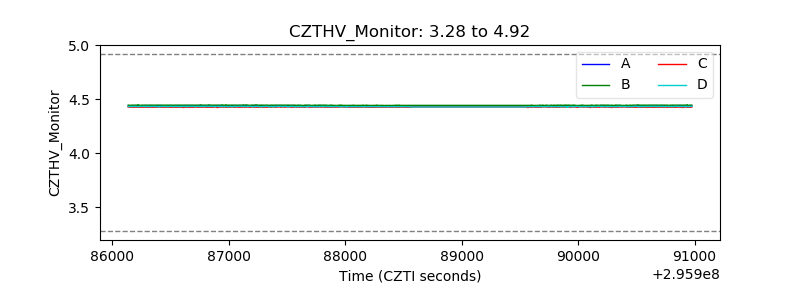 |
| D_VDD | 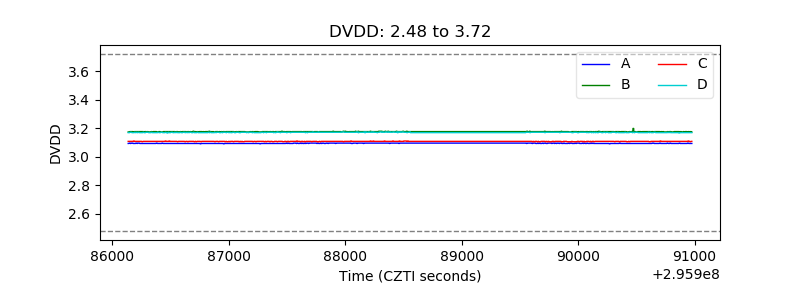 |
| Temperature 1 | 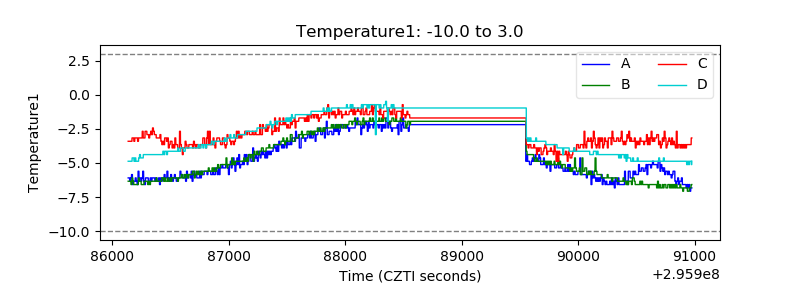 |
| Veto HV Monitor | 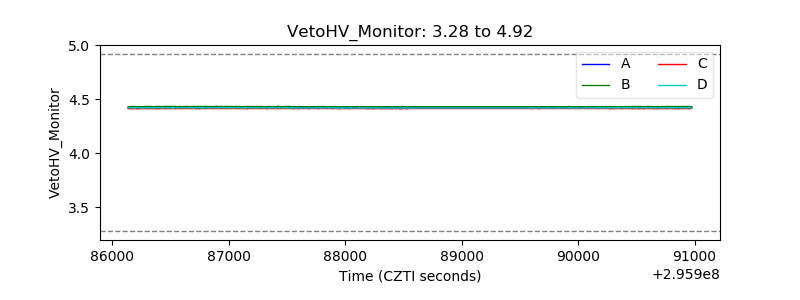 |
| Veto LLD | 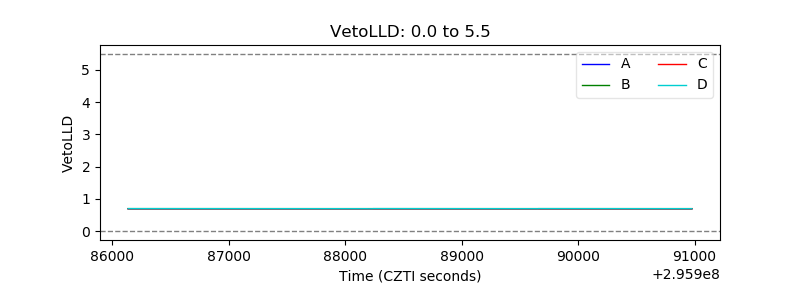 |
| Alpha Counter | 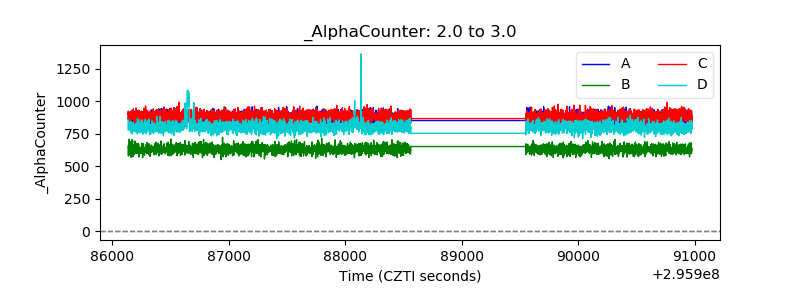 |
| _CPM_Rate | 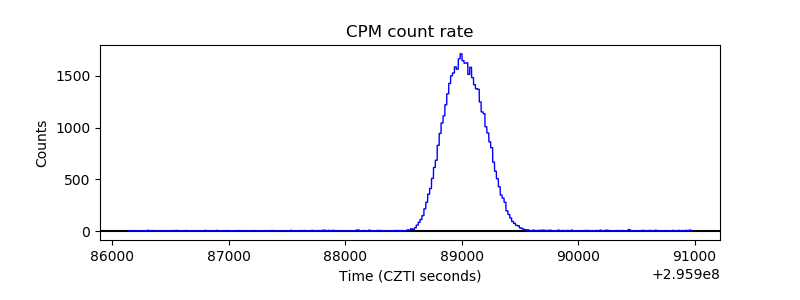 |
| CZT Counter | 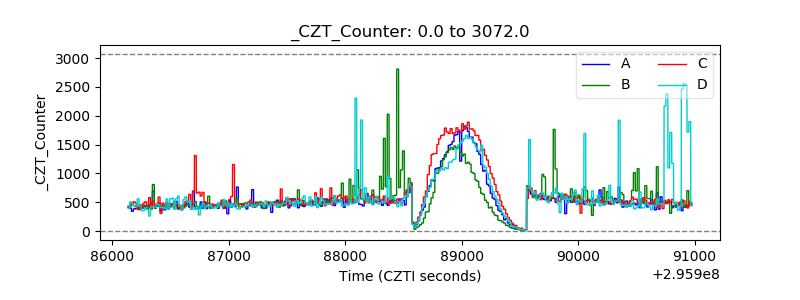 |
| +2.5 Volts monitor | 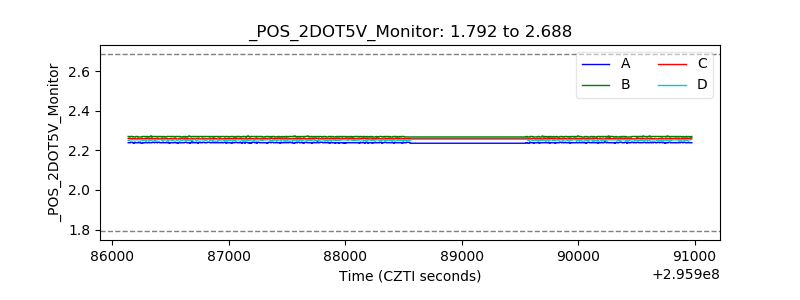 |
| +5 Volts monitor |  |
| _ROLL_ROT | 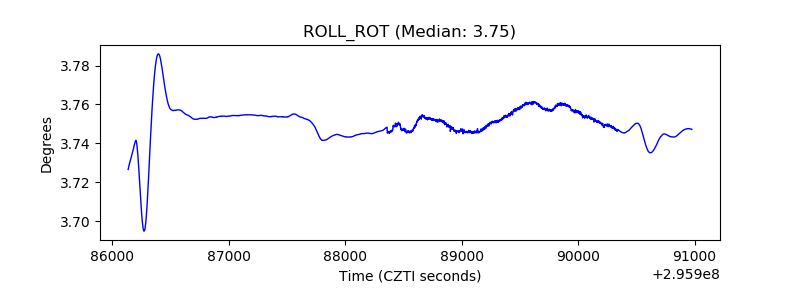 |
| _Roll_DEC | 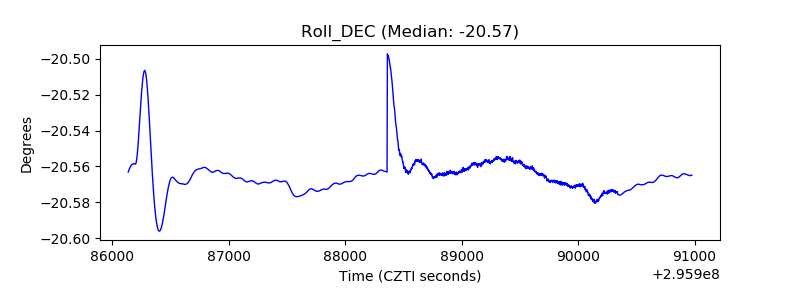 |
| _Roll_RA |  |
| Veto Counter | 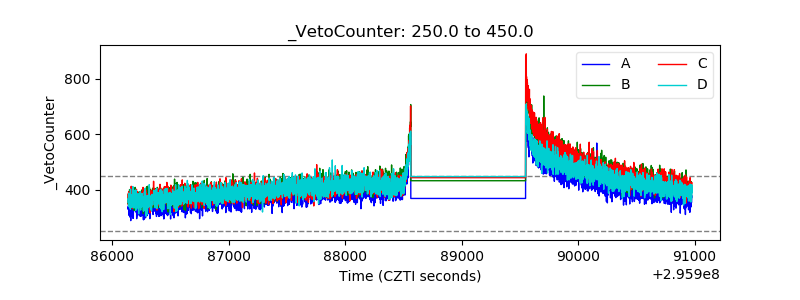 |