| Param | Original file | Final file |
|---|---|---|
| Filename | modeM0/AS1A05_221T01_9000002936_19683cztM0_level2.evt | modeM0/AS1A05_221T01_9000002936_19683cztM0_level2_quad_clean.evt |
| Size (bytes) | 476,671,680 | 99,858,240 |
| Size | 454.6 MB | 95.2 MB |
| Events in quadrant A | 3,154,510 | 647,855 |
| Events in quadrant B | 3,483,178 | 671,590 |
| Events in quadrant C | 3,411,202 | 647,546 |
| Events in quadrant D | 3,957,404 | 615,637 |
| Mode M0 | |||
|---|---|---|---|
| Quadrant | BADHDUFLAG | Total packets | Discarded packets |
| A | 0 | 13374 | 1 |
| B | 0 | 14454 | 1 |
| C | 0 | 14081 | 1 |
| D | 0 | 15991 | 1 |
| Mode M9 | |||
|---|---|---|---|
| Quadrant | BADHDUFLAG | Total packets | Discarded packets |
| A | 0 | 24 | 0 |
| B | 0 | 24 | 0 |
| C | 0 | 24 | 0 |
| D | 0 | 24 | 0 |
| Mode SS | |||
|---|---|---|---|
| Quadrant | BADHDUFLAG | Total packets | Discarded packets |
| A | 0 | 130 | 0 |
| B | 0 | 130 | 0 |
| C | 0 | 130 | 0 |
| D | 0 | 130 | 0 |
| Quadrant | Total seconds | Saturated seconds | Saturation percentage |
|---|---|---|---|
| A | 6329 | 29 | 0.458208% |
| B | 6329 | 120 | 1.896034% |
| C | 6329 | 89 | 1.406225% |
| D | 6329 | 147 | 2.322642% |
Noise dominated data is calculated using 1-second bins in cleaned event files. If a bin has >2000 counts, and if more than 50% of those come from <1% of pixels, then it is considered to be noise-dominated and hence unusable.
| Quadrant | # 1 sec bins | Bins with >0 counts | Bins with >2000 counts | High rate bins dominated by noise | Noise dominated (total time) | Noise dominated (detector-on time) | Marked lightcurve |
|---|---|---|---|---|---|---|---|
| A | 8694 | 6330 | 2 | 2 | 0.02% | 0.03% | 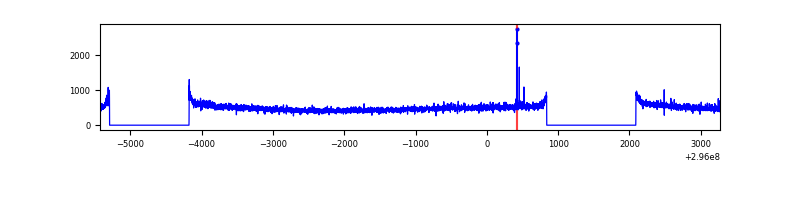 |
| B | 8694 | 6330 | 34 | 34 | 0.39% | 0.54% | 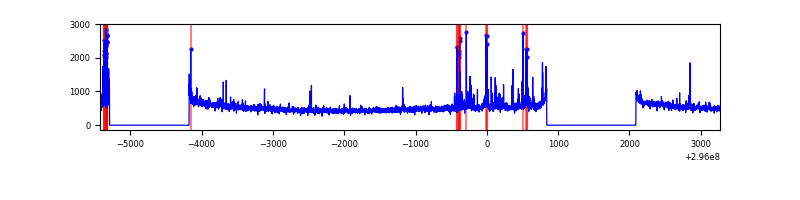 |
| C | 8694 | 6330 | 1 | 1 | 0.01% | 0.02% | 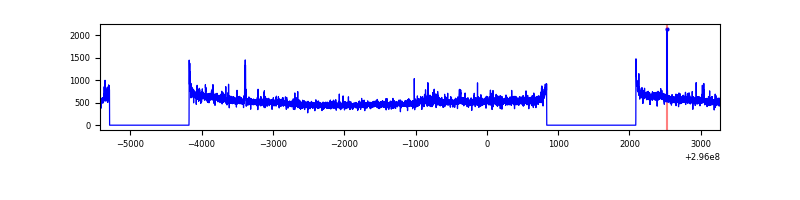 |
| D | 8694 | 6331 | 105 | 105 | 1.21% | 1.66% | 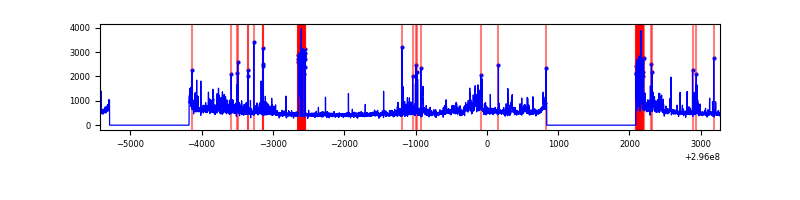 |
Top three noisy pixels from each quadrant. If the there are fewer than three noisy pixels in the level2.evt file, extra rows are filled as -1
| Pixel properties | Quadrant properties | ||||||
|---|---|---|---|---|---|---|---|
| Quadrant | DetID | PixID | Counts | Sigma | Mean | Median | Sigma |
| A | 5 | 16 | 17261 | 101.24 | 815 | 799 | 162.6 |
| A | 0 | 226 | 7038 | 38.37 | 815 | 799 | 162.6 |
| A | 3 | 137 | 6255 | 33.56 | 815 | 799 | 162.6 |
| B | 3 | 112 | 216081 | 1412.02 | 816 | 796 | 152.5 |
| B | 4 | 216 | 30253 | 193.2 | 816 | 796 | 152.5 |
| B | 7 | 220 | 20976 | 132.36 | 816 | 796 | 152.5 |
| C | 14 | 238 | 125784 | 671.64 | 799 | 807 | 186.1 |
| C | 3 | 233 | 106492 | 567.96 | 799 | 807 | 186.1 |
| C | 7 | 247 | 36509 | 191.87 | 799 | 807 | 186.1 |
| D | 1 | 52 | 848628 | 4454.31 | 794 | 774 | 190.3 |
| D | 2 | 16 | 33838 | 173.71 | 794 | 774 | 190.3 |
| D | 1 | 20 | 25795 | 131.45 | 794 | 774 | 190.3 |
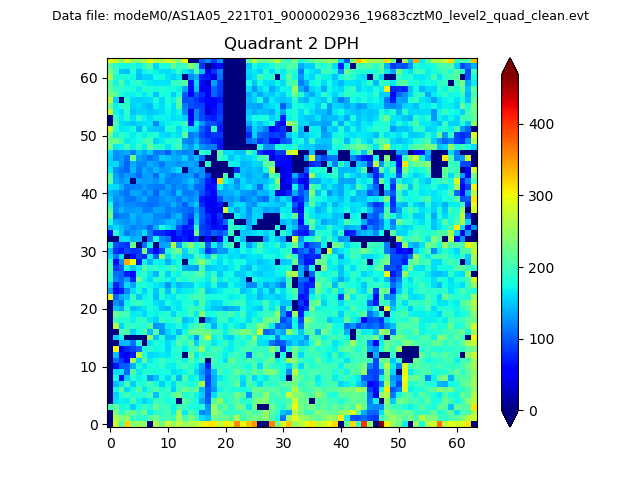
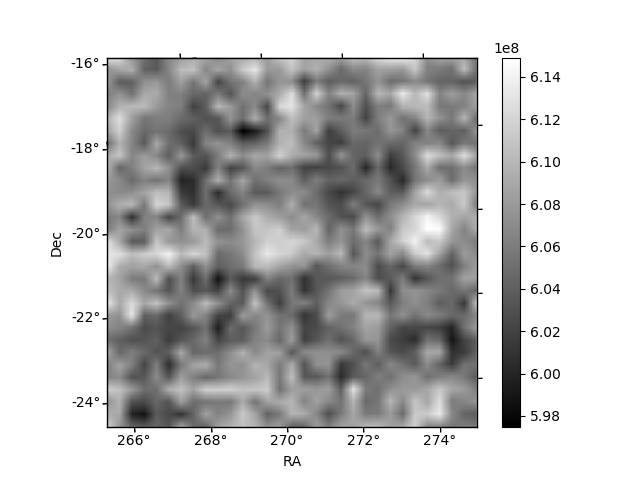
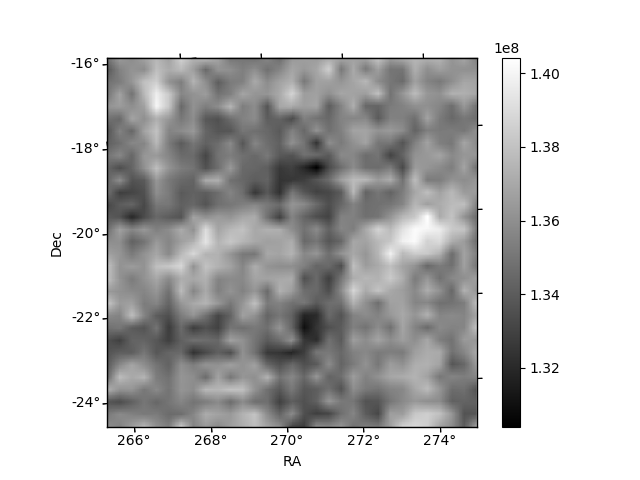
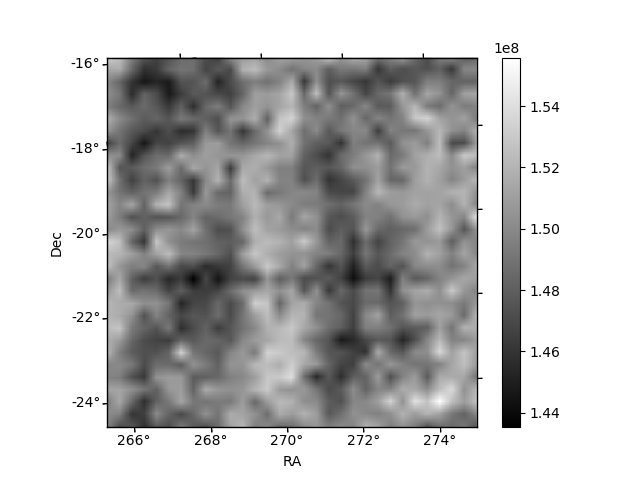
Histogram calculated using DETX and DETY for each event in the final _common_clean file
| Quadrant A | 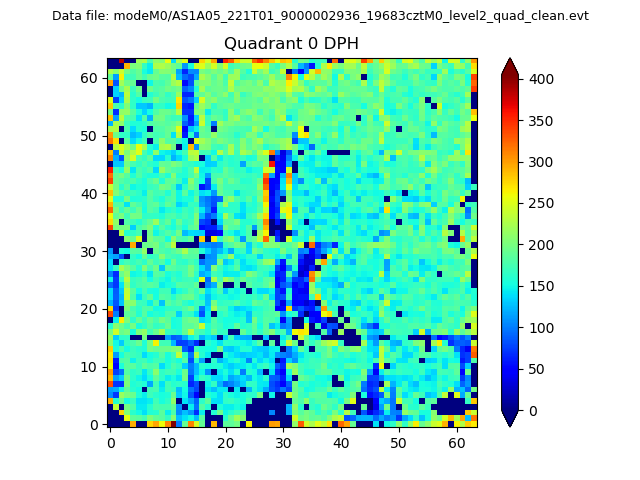 |
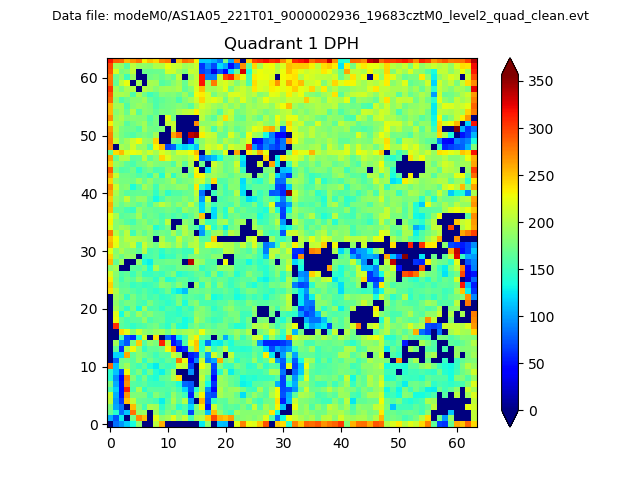 |
Quadrant B |
|---|---|---|---|
| Quadrant D | 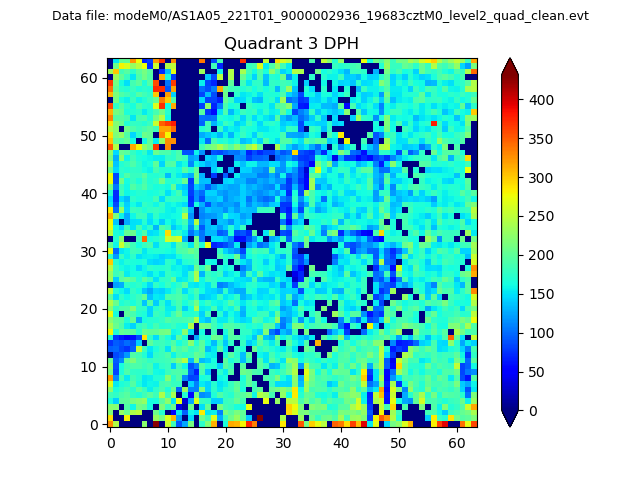 |
 |
Quadrant C |
| Plot type | Count rate plots | Images |
|---|---|---|
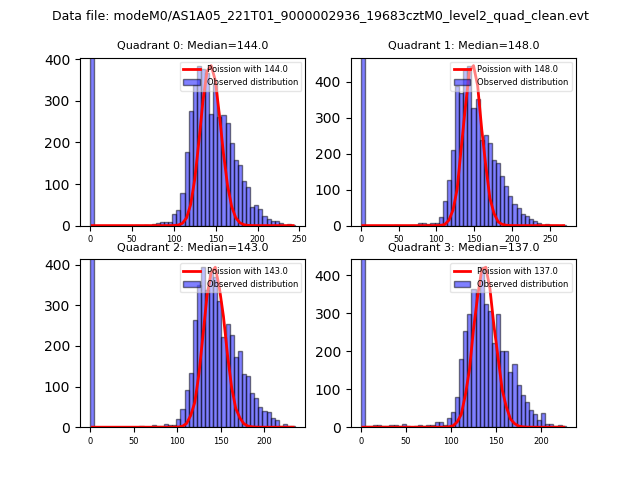
| Comparison with Poisson distribution Blue bars denote a histogram of data divided into 1 sec bins. Red curve is a Poisson curve with rate = median count rate of data. |
 |
 |
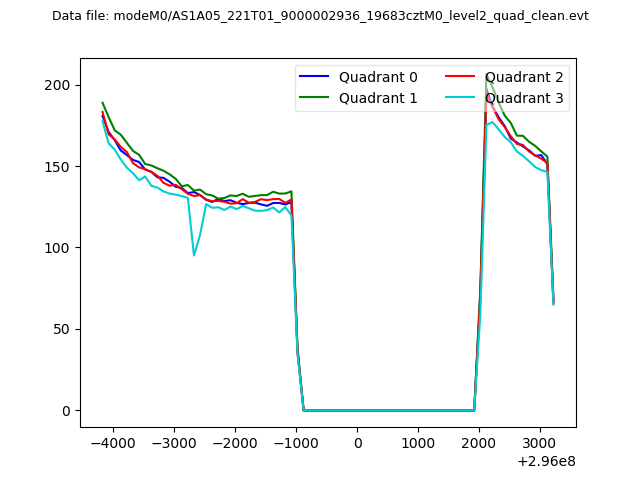
| Quadrant-wise count rates Data is divided into 100 sec bins |
 |
|
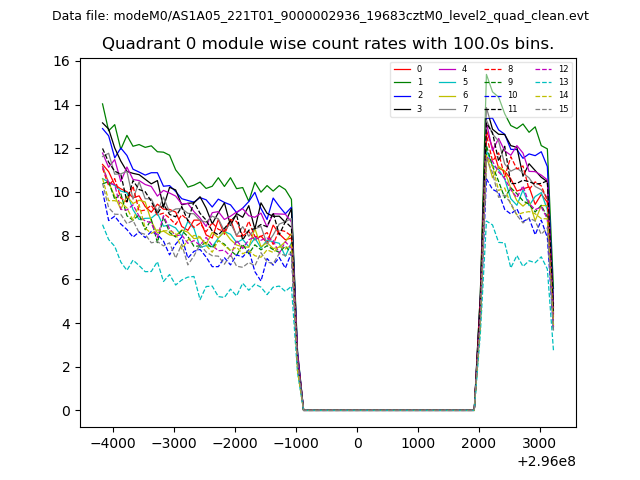
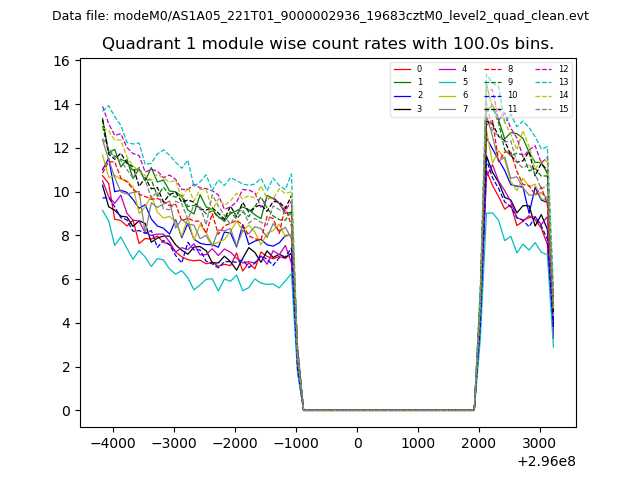
| Module-wise count rates for Quadrant A Data is divided into 100 sec bins |
 |
 |
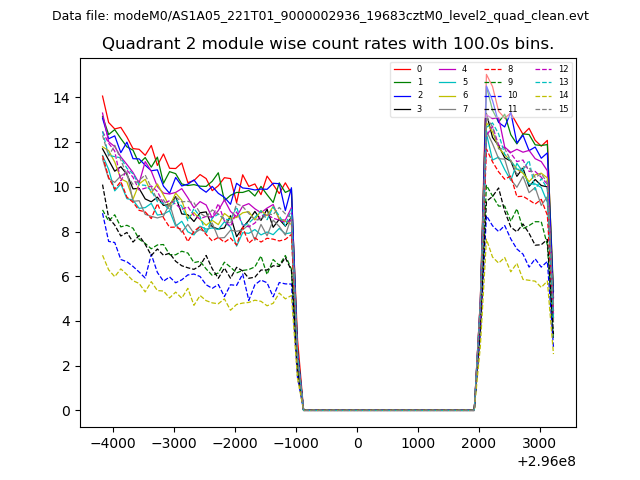
| Module-wise count rates for Quadrant B Data is divided into 100 sec bins |
 |
 |
| Module-wise count rates for Quadrant C Data is divided into 100 sec bins |
 |
 |
| Module-wise count rates for Quadrant D Data is divided into 100 sec bins |
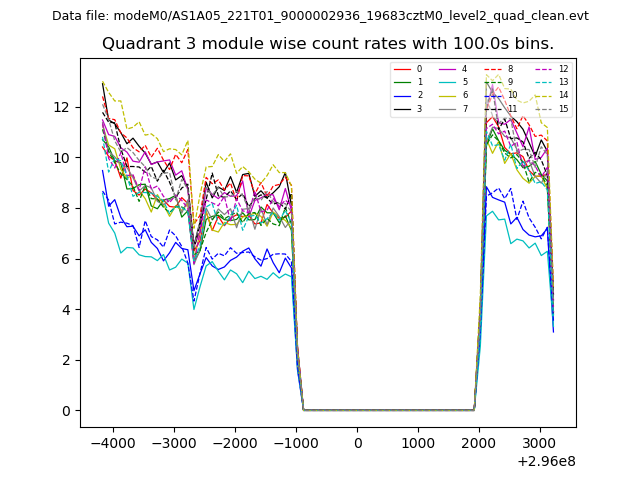 |
 |
| Parameter | Plot |
|---|---|
| CZT HV Monitor | 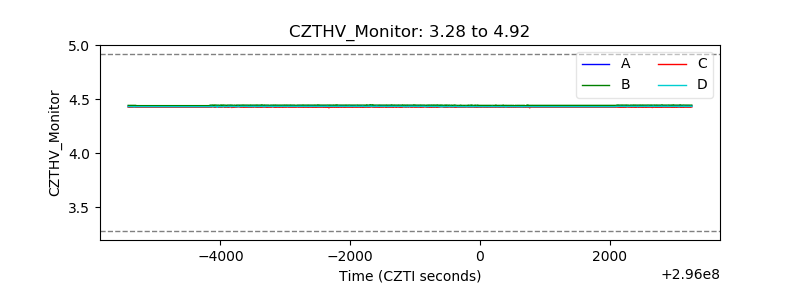 |
| D_VDD | 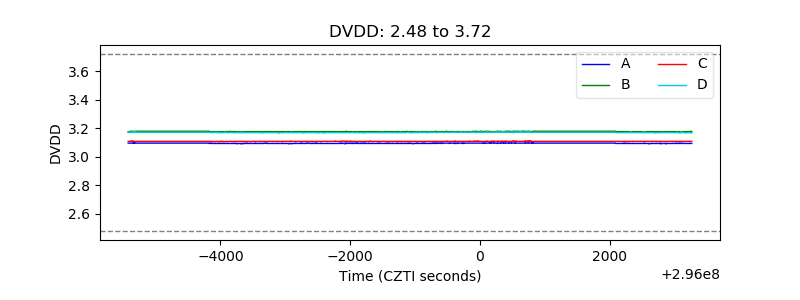 |
| Temperature 1 | 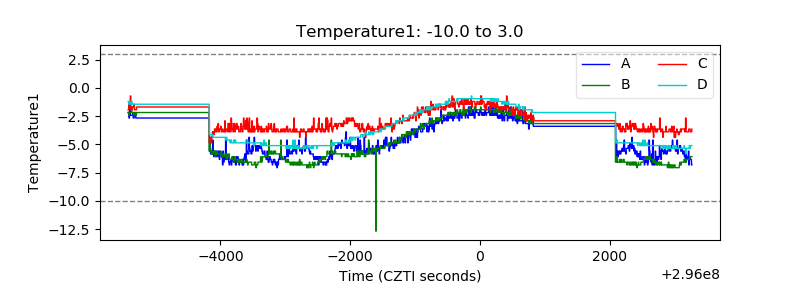 |
| Veto HV Monitor |  |
| Veto LLD | 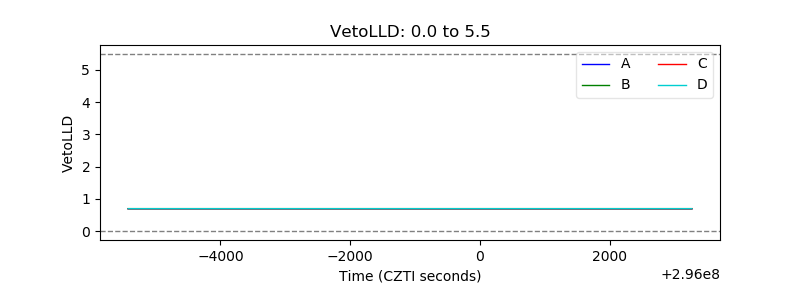 |
| Alpha Counter | 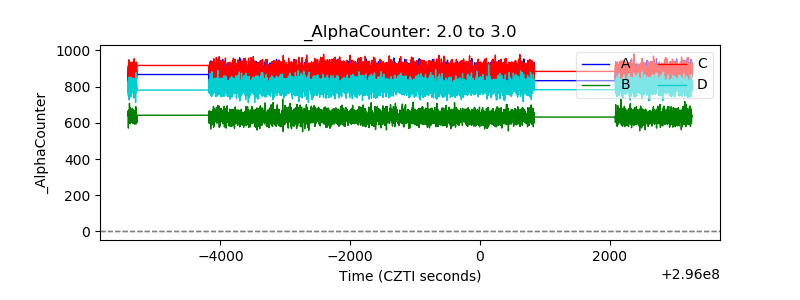 |
| _CPM_Rate | 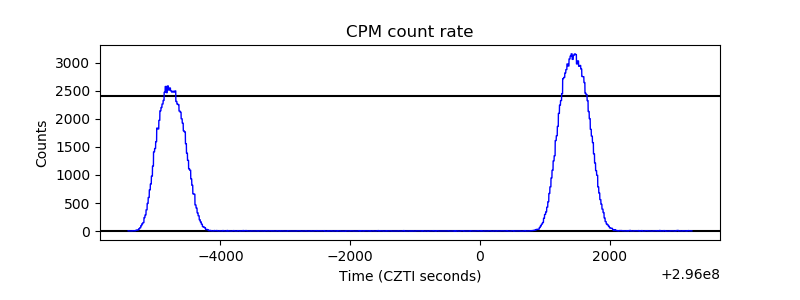 |
| CZT Counter | 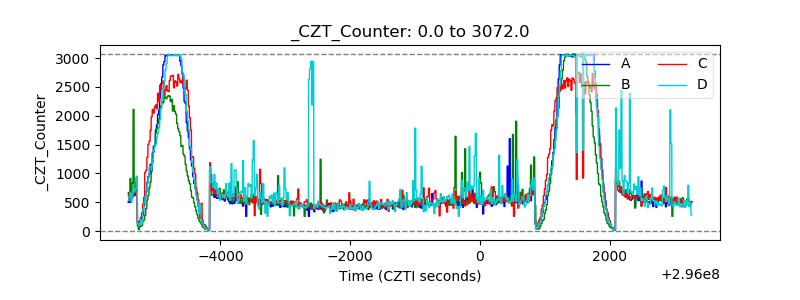 |
| +2.5 Volts monitor |  |
| +5 Volts monitor |  |
| _ROLL_ROT | 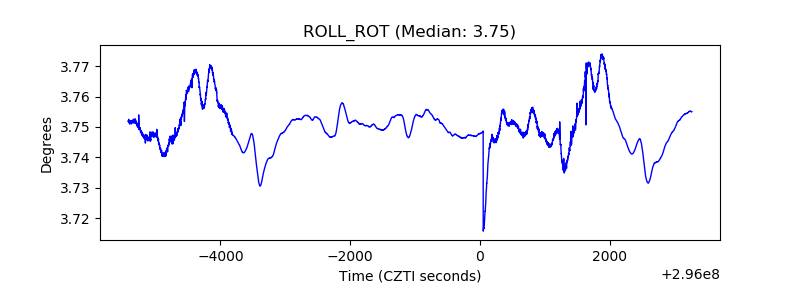 |
| _Roll_DEC | 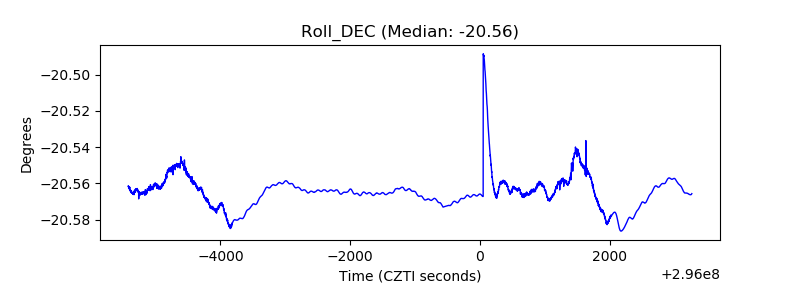 |
| _Roll_RA | 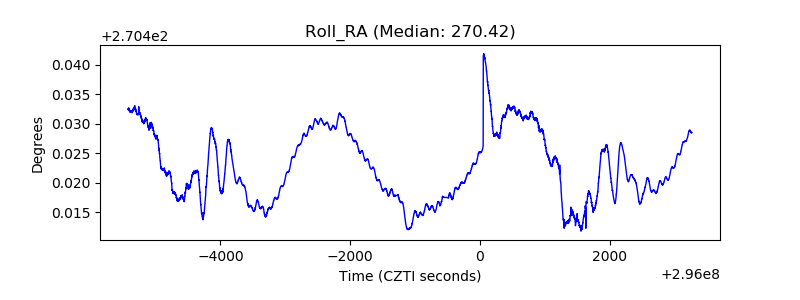 |
| Veto Counter | 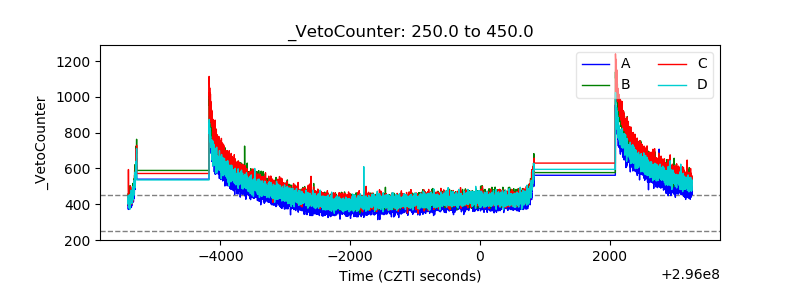 |