| Param | Original file | Final file |
|---|---|---|
| Filename | modeM0/AS1A05_221T01_9000002936_19684cztM0_level2.evt | modeM0/AS1A05_221T01_9000002936_19684cztM0_level2_quad_clean.evt |
| Size (bytes) | 484,701,120 | 107,861,760 |
| Size | 462.2 MB | 102.9 MB |
| Events in quadrant A | 3,365,010 | 706,370 |
| Events in quadrant B | 3,518,404 | 729,409 |
| Events in quadrant C | 3,656,415 | 696,826 |
| Events in quadrant D | 3,692,978 | 675,628 |
| Mode M0 | |||
|---|---|---|---|
| Quadrant | BADHDUFLAG | Total packets | Discarded packets |
| A | 0 | 13949 | 1 |
| B | 0 | 14450 | 1 |
| C | 0 | 14813 | 1 |
| D | 0 | 15207 | 1 |
| Mode M9 | |||
|---|---|---|---|
| Quadrant | BADHDUFLAG | Total packets | Discarded packets |
| A | 0 | 23 | 0 |
| B | 0 | 24 | 0 |
| C | 0 | 24 | 0 |
| D | 0 | 24 | 0 |
| Mode SS | |||
|---|---|---|---|
| Quadrant | BADHDUFLAG | Total packets | Discarded packets |
| A | 0 | 132 | 0 |
| B | 0 | 132 | 0 |
| C | 0 | 132 | 0 |
| D | 0 | 132 | 0 |
| Quadrant | Total seconds | Saturated seconds | Saturation percentage |
|---|---|---|---|
| A | 6581 | 30 | 0.455858% |
| B | 6581 | 51 | 0.774958% |
| C | 6581 | 87 | 1.321988% |
| D | 6581 | 86 | 1.306792% |
Noise dominated data is calculated using 1-second bins in cleaned event files. If a bin has >2000 counts, and if more than 50% of those come from <1% of pixels, then it is considered to be noise-dominated and hence unusable.
| Quadrant | # 1 sec bins | Bins with >0 counts | Bins with >2000 counts | High rate bins dominated by noise | Noise dominated (total time) | Noise dominated (detector-on time) | Marked lightcurve |
|---|---|---|---|---|---|---|---|
| A | 7891 | 6582 | 0 | 0 | 0.00% | 0.00% | 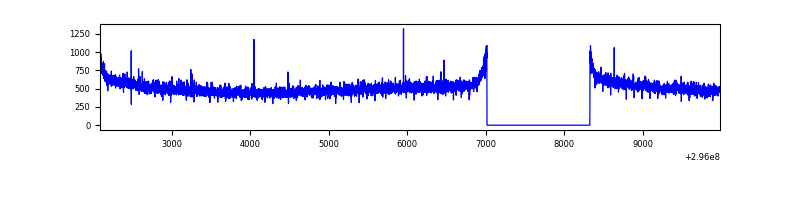 |
| B | 7891 | 6582 | 8 | 8 | 0.10% | 0.12% | 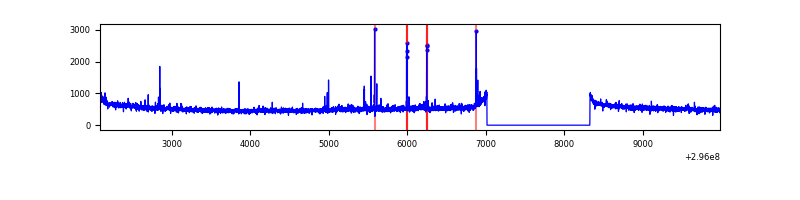 |
| C | 7891 | 6582 | 6 | 6 | 0.08% | 0.09% | 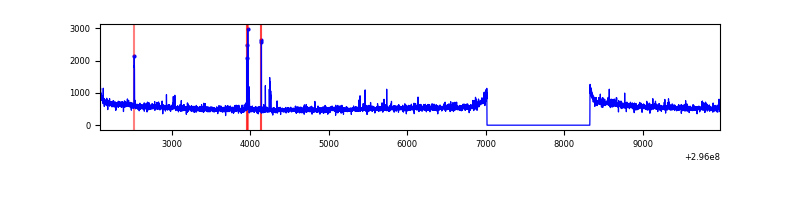 |
| D | 7891 | 6582 | 54 | 54 | 0.68% | 0.82% | 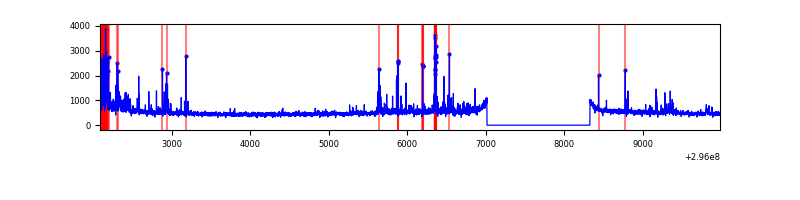 |
Top three noisy pixels from each quadrant. If the there are fewer than three noisy pixels in the level2.evt file, extra rows are filled as -1
| Pixel properties | Quadrant properties | ||||||
|---|---|---|---|---|---|---|---|
| Quadrant | DetID | PixID | Counts | Sigma | Mean | Median | Sigma |
| A | 0 | 226 | 7705 | 39.29 | 874 | 860 | 174.2 |
| A | 3 | 137 | 6261 | 31.0 | 874 | 860 | 174.2 |
| A | 12 | 194 | 6205 | 30.68 | 874 | 860 | 174.2 |
| B | 12 | 111 | 18639 | 109.01 | 875 | 856 | 163.1 |
| B | 4 | 216 | 17800 | 103.87 | 875 | 856 | 163.1 |
| B | 7 | 220 | 16993 | 98.92 | 875 | 856 | 163.1 |
| C | 14 | 238 | 133331 | 663.46 | 855 | 863 | 199.7 |
| C | 3 | 233 | 108259 | 537.89 | 855 | 863 | 199.7 |
| C | 9 | 221 | 43895 | 215.52 | 855 | 863 | 199.7 |
| D | 1 | 52 | 381156 | 1832.5 | 856 | 833 | 207.5 |
| D | 7 | 38 | 54482 | 258.5 | 856 | 833 | 207.5 |
| D | 2 | 234 | 23652 | 109.95 | 856 | 833 | 207.5 |
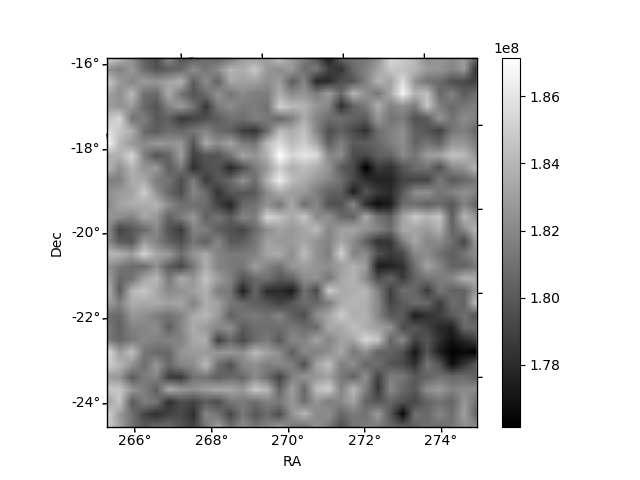
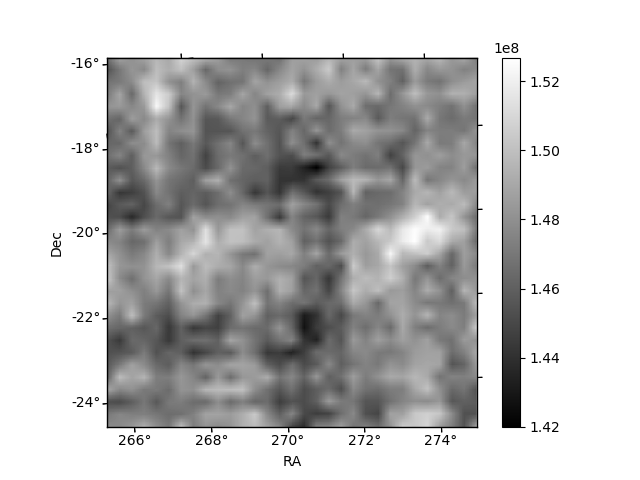
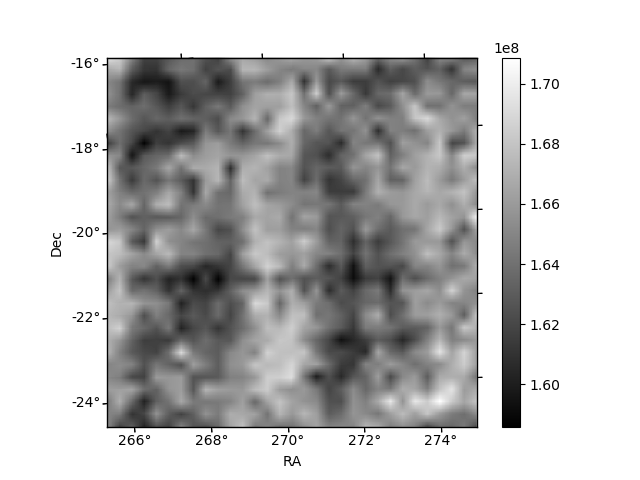
Histogram calculated using DETX and DETY for each event in the final _common_clean file
| Quadrant A | 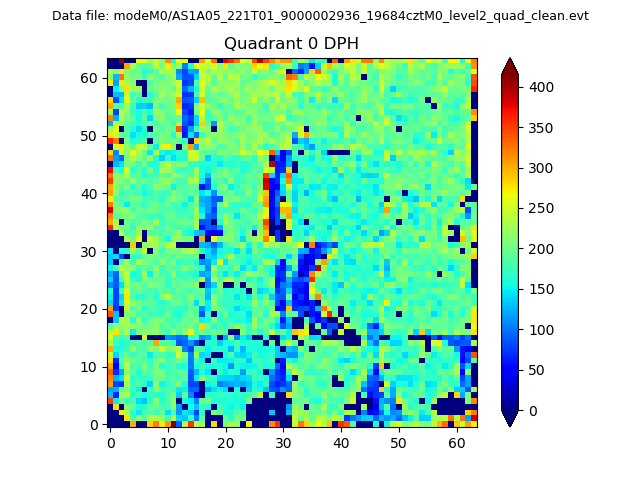 |
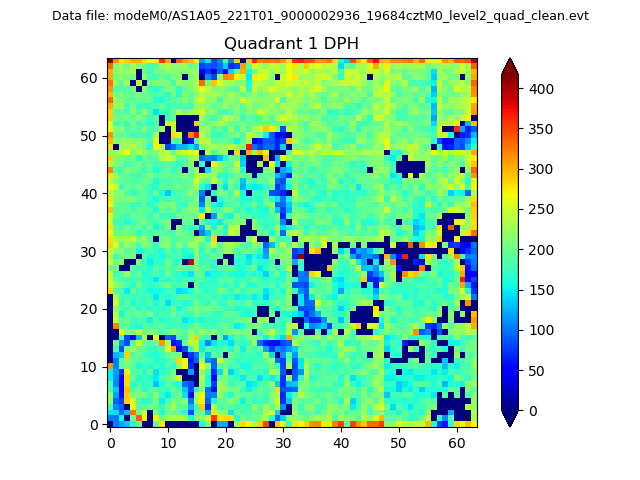 |
Quadrant B |
|---|---|---|---|
| Quadrant D | 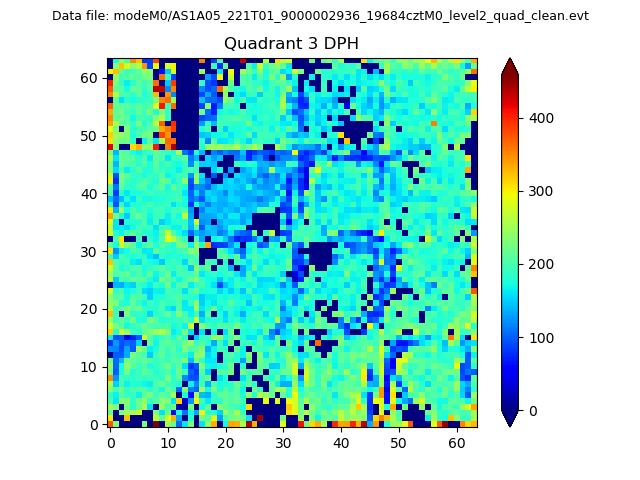 |
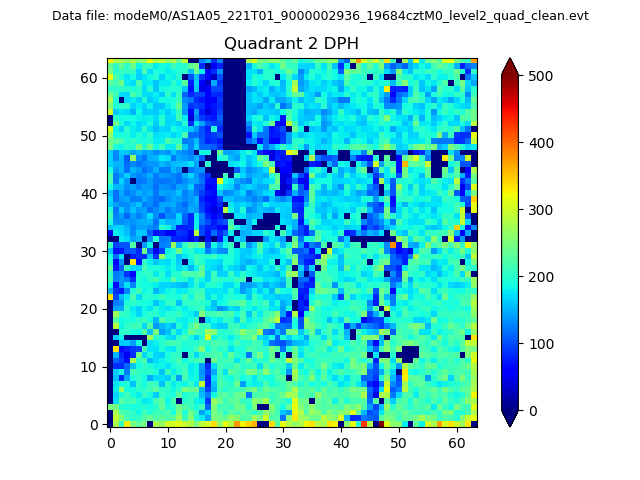 |
Quadrant C |
| Plot type | Count rate plots | Images |
|---|---|---|
| Comparison with Poisson distribution Blue bars denote a histogram of data divided into 1 sec bins. Red curve is a Poisson curve with rate = median count rate of data. |
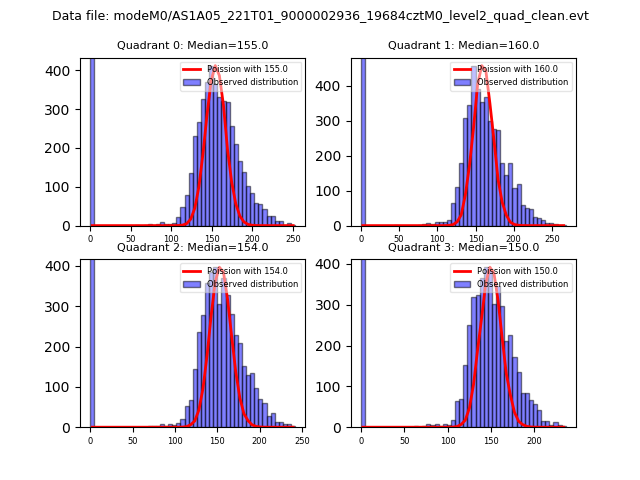 |
 |
| Quadrant-wise count rates Data is divided into 100 sec bins |
 |
|
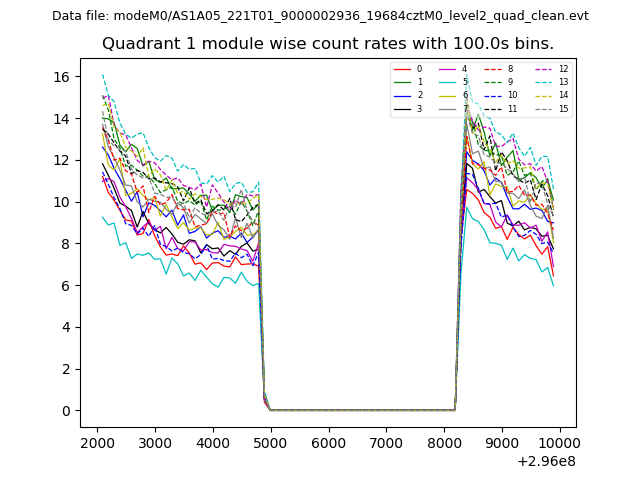
| Module-wise count rates for Quadrant A Data is divided into 100 sec bins |
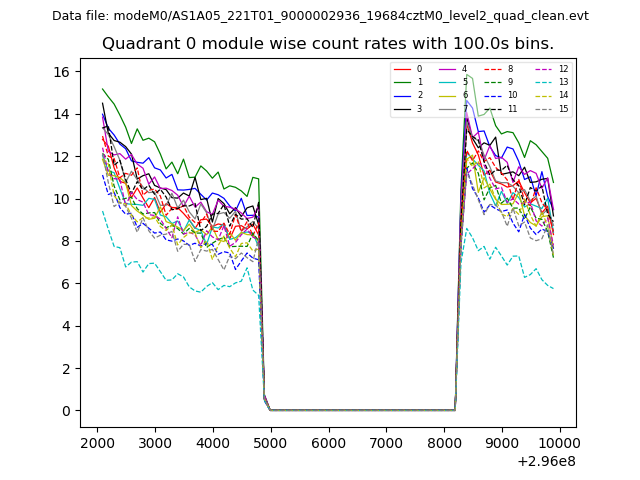 |
 |
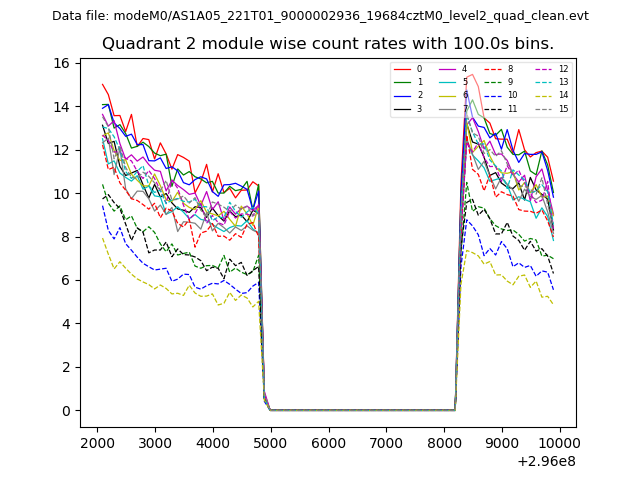
| Module-wise count rates for Quadrant B Data is divided into 100 sec bins |
 |
 |
| Module-wise count rates for Quadrant C Data is divided into 100 sec bins |
 |
 |
| Module-wise count rates for Quadrant D Data is divided into 100 sec bins |
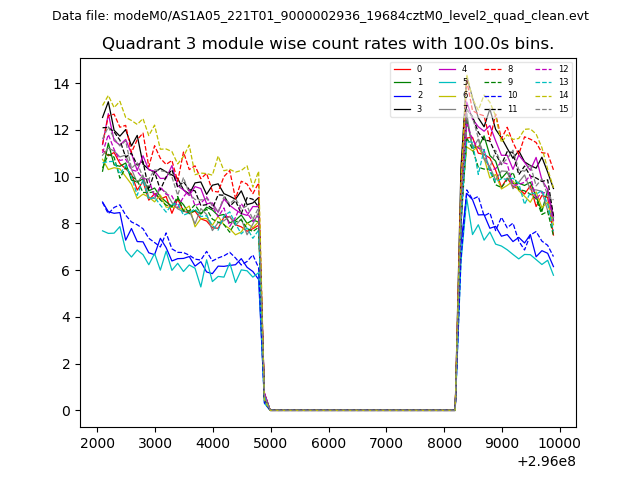 |
 |
| Parameter | Plot |
|---|---|
| CZT HV Monitor | 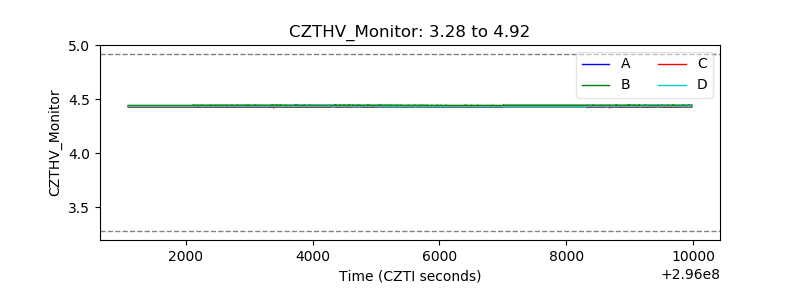 |
| D_VDD | 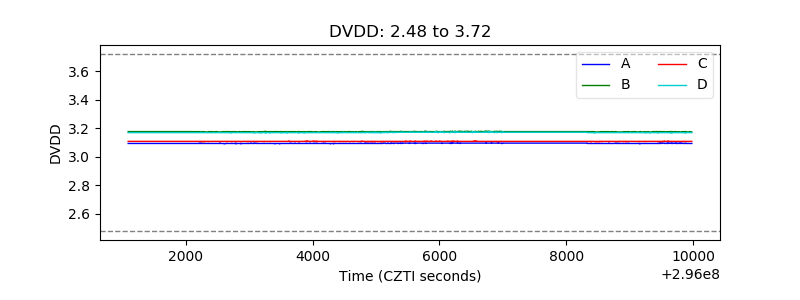 |
| Temperature 1 | 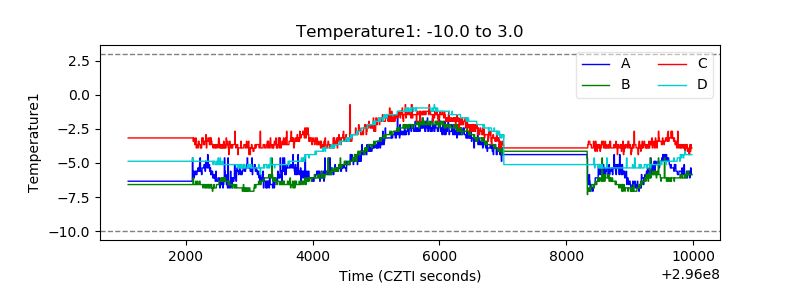 |
| Veto HV Monitor | 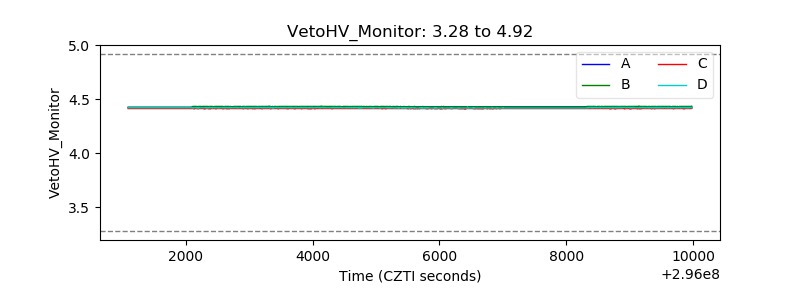 |
| Veto LLD | 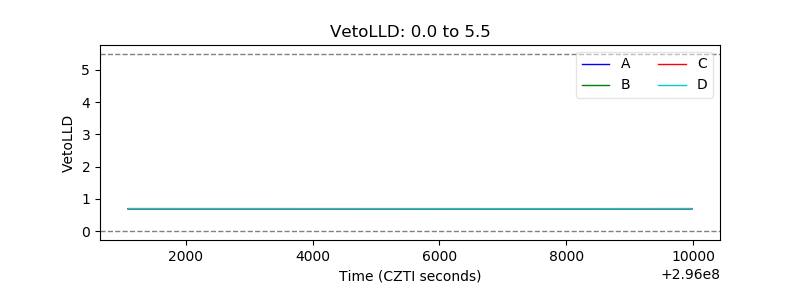 |
| Alpha Counter | 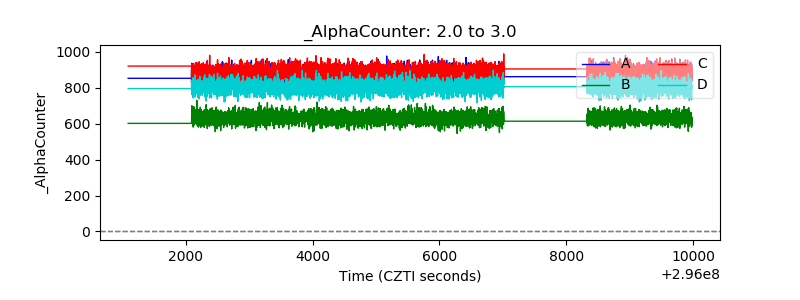 |
| _CPM_Rate | 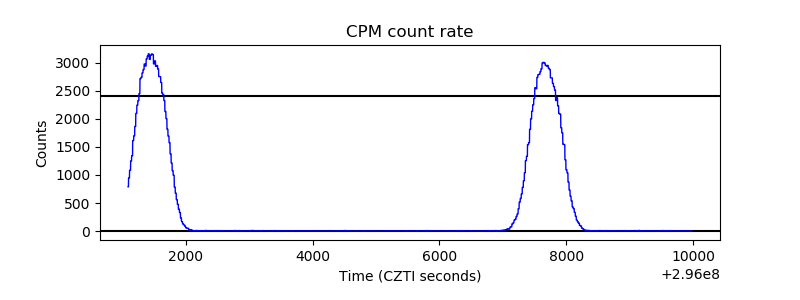 |
| CZT Counter | 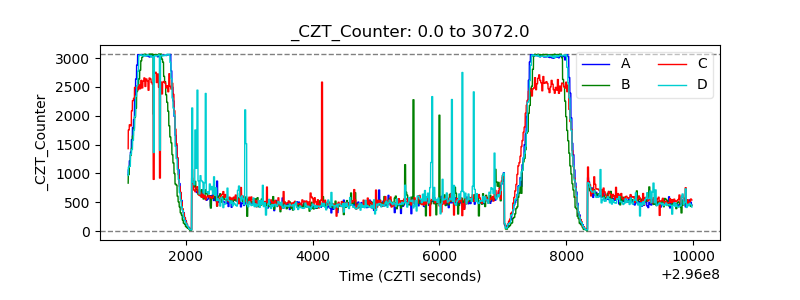 |
| +2.5 Volts monitor |  |
| +5 Volts monitor |  |
| _ROLL_ROT | 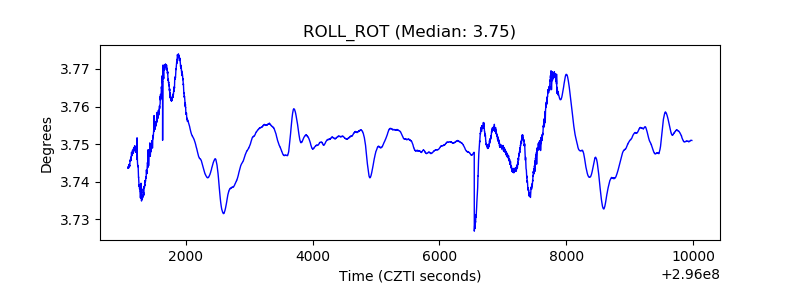 |
| _Roll_DEC | 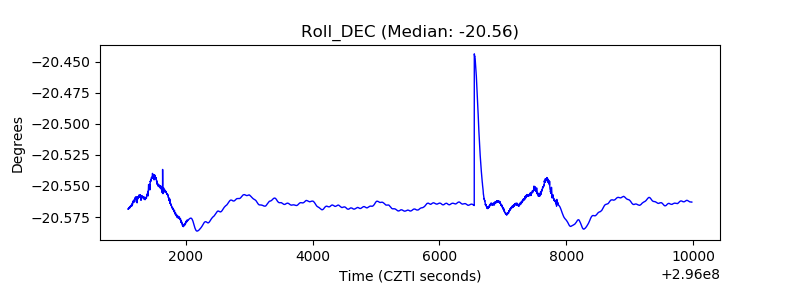 |
| _Roll_RA | 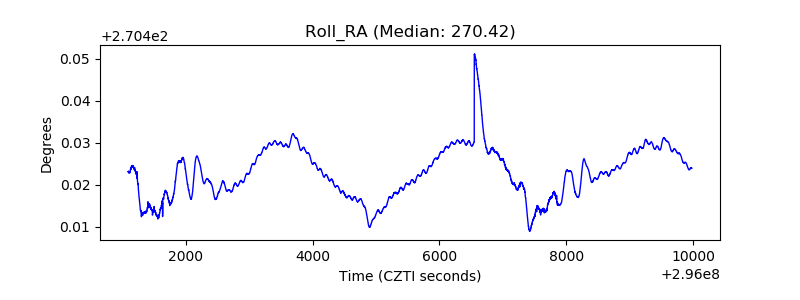 |
| Veto Counter | 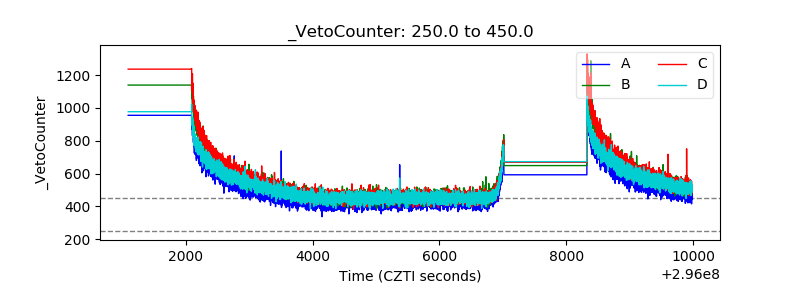 |