| Param | Original file | Final file |
|---|---|---|
| Filename | modeM0/AS1A05_221T01_9000002936_19685cztM0_level2.evt | modeM0/AS1A05_221T01_9000002936_19685cztM0_level2_quad_clean.evt |
| Size (bytes) | 516,029,760 | 103,124,160 |
| Size | 492.1 MB | 98.3 MB |
| Events in quadrant A | 3,450,609 | 693,990 |
| Events in quadrant B | 3,507,721 | 711,125 |
| Events in quadrant C | 3,611,412 | 677,977 |
| Events in quadrant D | 4,617,728 | 587,051 |
| Mode M0 | |||
|---|---|---|---|
| Quadrant | BADHDUFLAG | Total packets | Discarded packets |
| A | 0 | 14025 | 2 |
| B | 0 | 14228 | 2 |
| C | 0 | 14587 | 2 |
| D | 0 | 17771 | 2 |
| Mode M9 | |||
|---|---|---|---|
| Quadrant | BADHDUFLAG | Total packets | Discarded packets |
| A | 0 | 16 | 0 |
| B | 0 | 17 | 0 |
| C | 0 | 17 | 0 |
| D | 0 | 17 | 0 |
| Mode SS | |||
|---|---|---|---|
| Quadrant | BADHDUFLAG | Total packets | Discarded packets |
| A | 0 | 130 | 0 |
| B | 0 | 130 | 0 |
| C | 0 | 130 | 0 |
| D | 0 | 130 | 0 |
| Quadrant | Total seconds | Saturated seconds | Saturation percentage |
|---|---|---|---|
| A | 6492 | 49 | 0.754775% |
| B | 6492 | 62 | 0.955022% |
| C | 6492 | 71 | 1.093654% |
| D | 6492 | 626 | 9.642637% |
Noise dominated data is calculated using 1-second bins in cleaned event files. If a bin has >2000 counts, and if more than 50% of those come from <1% of pixels, then it is considered to be noise-dominated and hence unusable.
| Quadrant | # 1 sec bins | Bins with >0 counts | Bins with >2000 counts | High rate bins dominated by noise | Noise dominated (total time) | Noise dominated (detector-on time) | Marked lightcurve |
|---|---|---|---|---|---|---|---|
| A | 7857 | 6493 | 4 | 4 | 0.05% | 0.06% |  |
| B | 7857 | 6493 | 5 | 5 | 0.06% | 0.08% |  |
| C | 7857 | 6493 | 0 | 0 | 0.00% | 0.00% |  |
| D | 7857 | 6493 | 498 | 498 | 6.34% | 7.67% |  |
Top three noisy pixels from each quadrant. If the there are fewer than three noisy pixels in the level2.evt file, extra rows are filled as -1
| Pixel properties | Quadrant properties | ||||||
|---|---|---|---|---|---|---|---|
| Quadrant | DetID | PixID | Counts | Sigma | Mean | Median | Sigma |
| A | 5 | 16 | 58694 | 331.21 | 880 | 864 | 174.6 |
| A | 0 | 226 | 7626 | 38.73 | 880 | 864 | 174.6 |
| A | 12 | 194 | 6363 | 31.49 | 880 | 864 | 174.6 |
| B | 4 | 216 | 24401 | 144.83 | 876 | 859 | 162.6 |
| B | 12 | 111 | 18788 | 110.3 | 876 | 859 | 162.6 |
| B | 11 | 111 | 16375 | 95.45 | 876 | 859 | 162.6 |
| C | 14 | 238 | 134843 | 673.88 | 852 | 860 | 198.8 |
| C | 3 | 233 | 102321 | 510.31 | 852 | 860 | 198.8 |
| C | 9 | 221 | 31859 | 155.91 | 852 | 860 | 198.8 |
| D | 1 | 20 | 1284758 | 6698.23 | 799 | 781 | 191.7 |
| D | 1 | 52 | 161165 | 836.69 | 799 | 781 | 191.7 |
| D | 7 | 38 | 56680 | 291.61 | 799 | 781 | 191.7 |
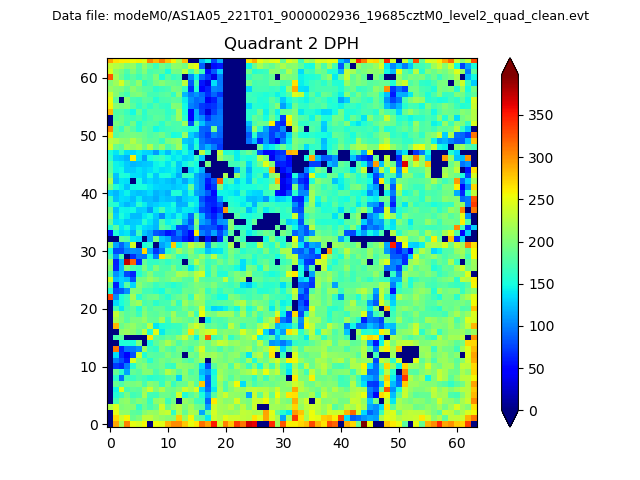
Histogram calculated using DETX and DETY for each event in the final _common_clean file
| Quadrant A | 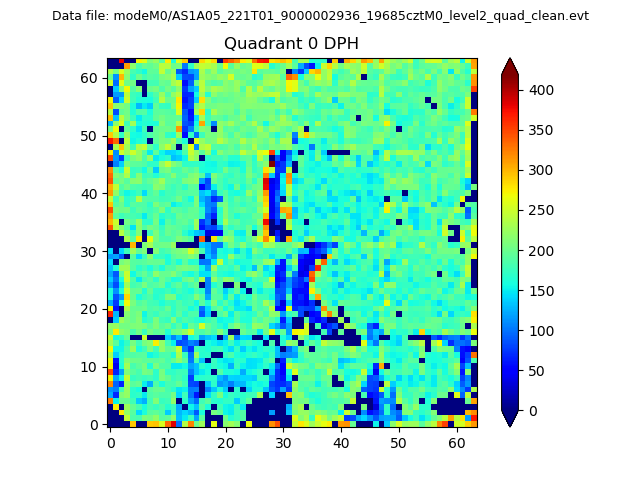 |
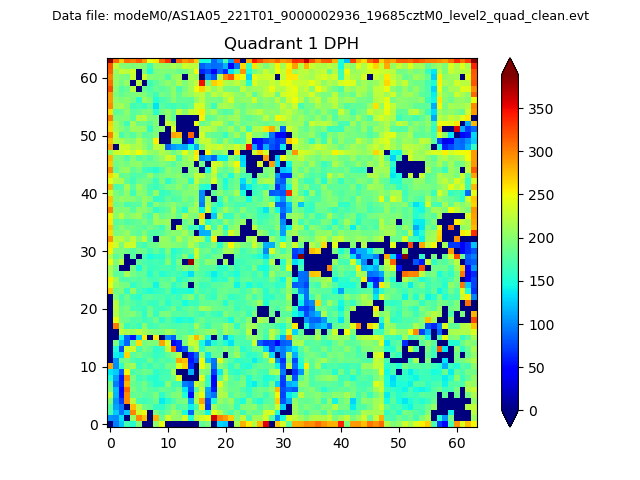 |
Quadrant B |
|---|---|---|---|
| Quadrant D | 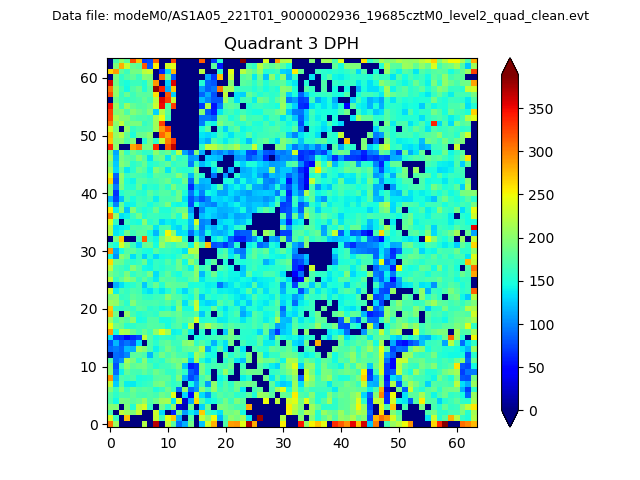 |
 |
Quadrant C |
| Plot type | Count rate plots | Images |
|---|---|---|
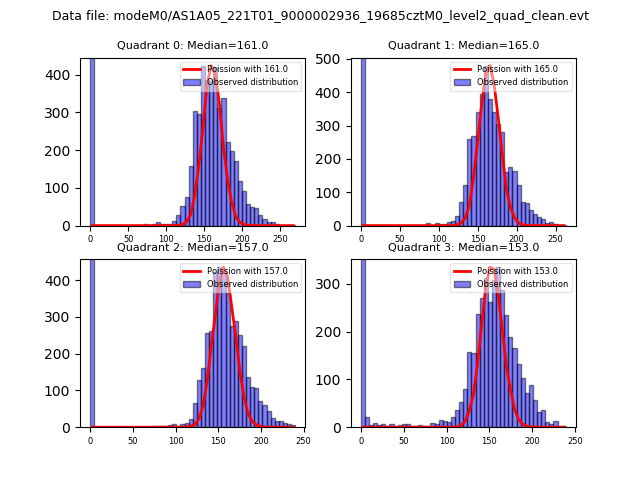
| Comparison with Poisson distribution Blue bars denote a histogram of data divided into 1 sec bins. Red curve is a Poisson curve with rate = median count rate of data. |
 |
 |
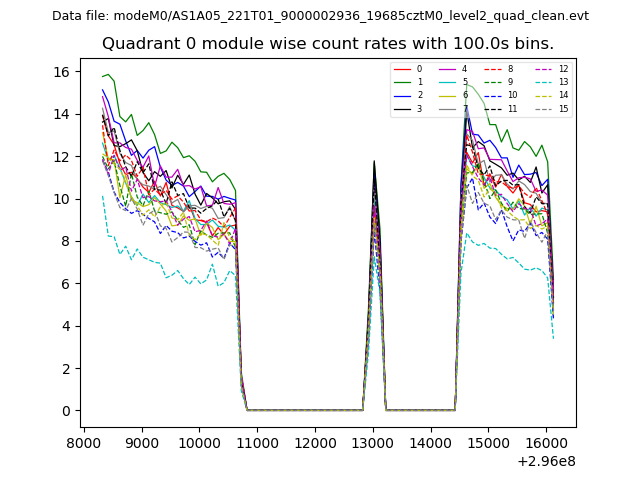
| Quadrant-wise count rates Data is divided into 100 sec bins |
 |
|
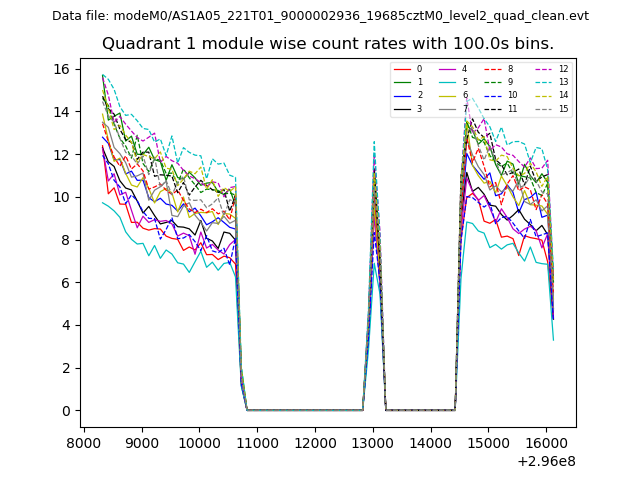
| Module-wise count rates for Quadrant A Data is divided into 100 sec bins |
 |
 |
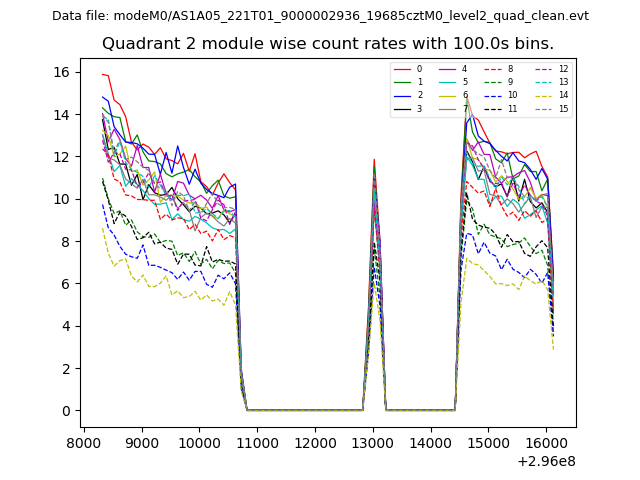
| Module-wise count rates for Quadrant B Data is divided into 100 sec bins |
 |
 |
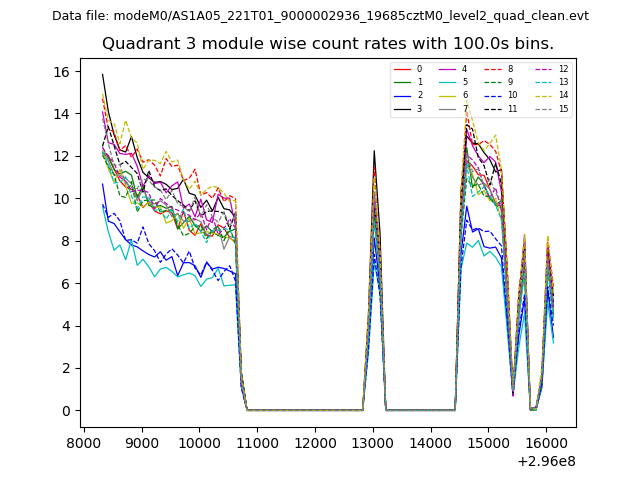
| Module-wise count rates for Quadrant C Data is divided into 100 sec bins |
 |
 |
| Module-wise count rates for Quadrant D Data is divided into 100 sec bins |
 |
 |
| Parameter | Plot |
|---|---|
| CZT HV Monitor | 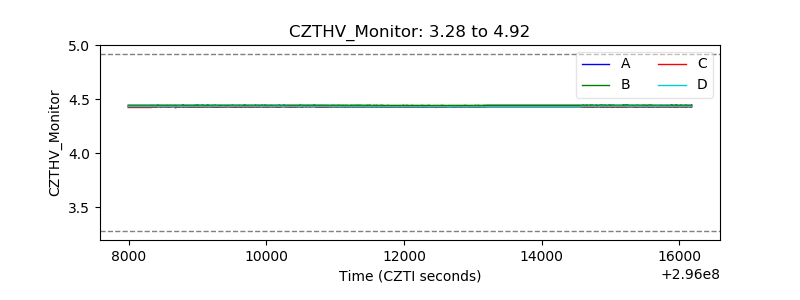 |
| D_VDD | 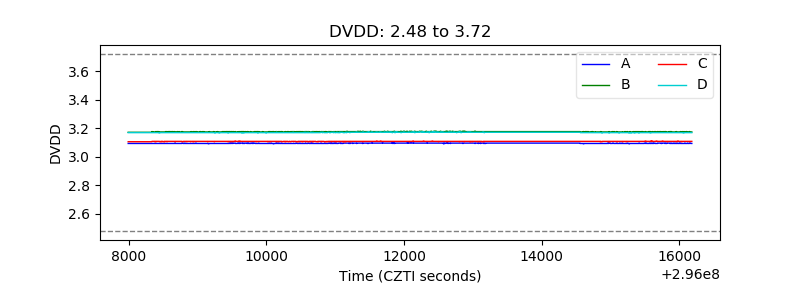 |
| Temperature 1 | 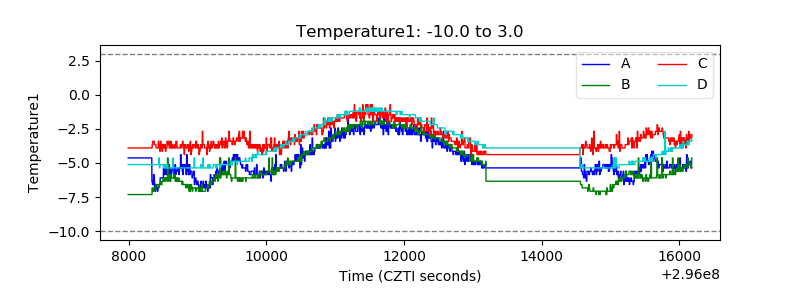 |
| Veto HV Monitor |  |
| Veto LLD | 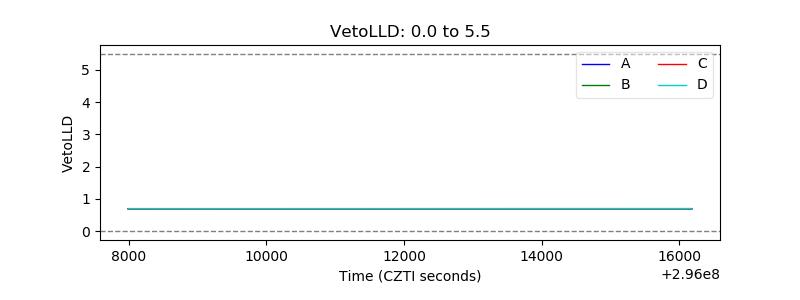 |
| Alpha Counter | 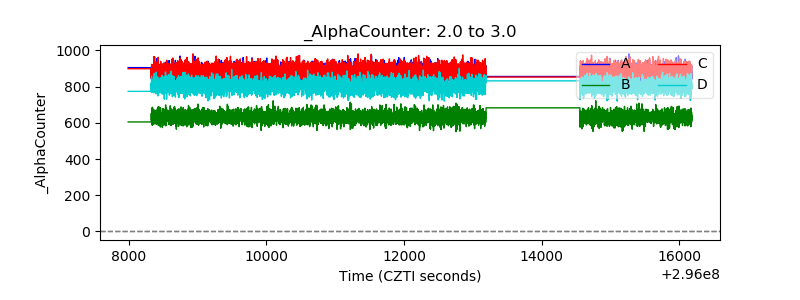 |
| _CPM_Rate | 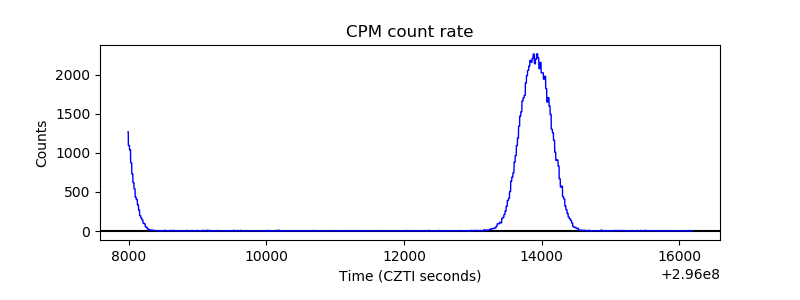 |
| CZT Counter | 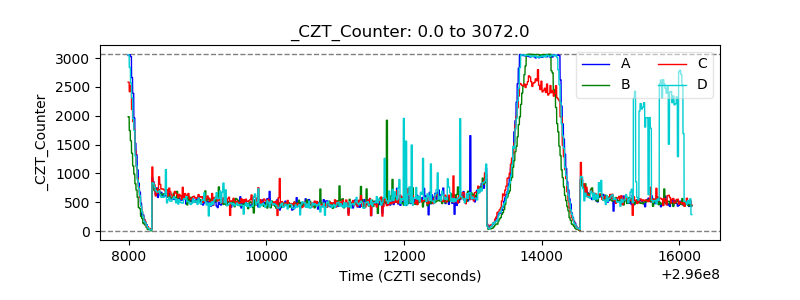 |
| +2.5 Volts monitor | 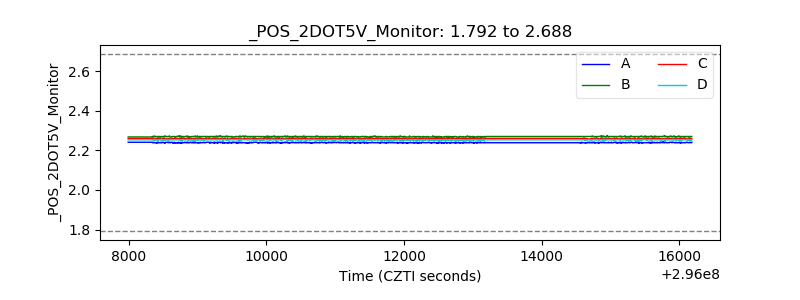 |
| +5 Volts monitor |  |
| _ROLL_ROT | 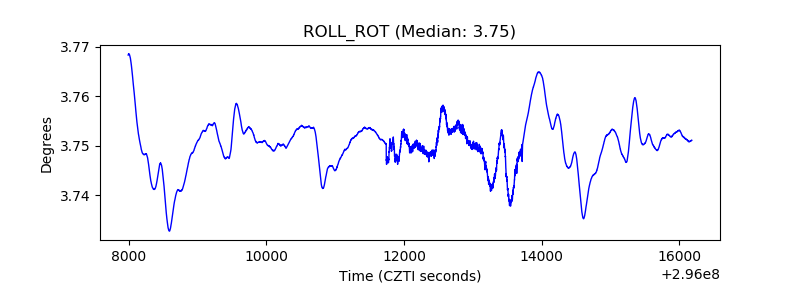 |
| _Roll_DEC | 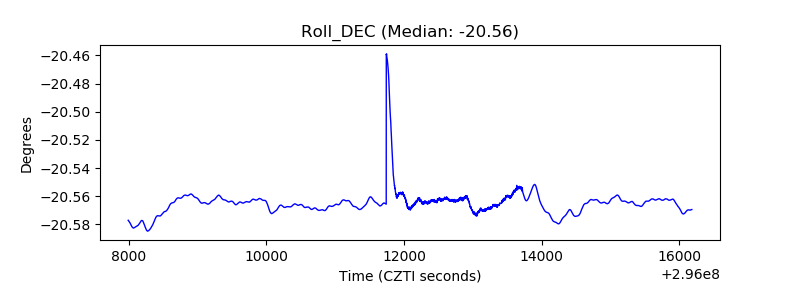 |
| _Roll_RA | 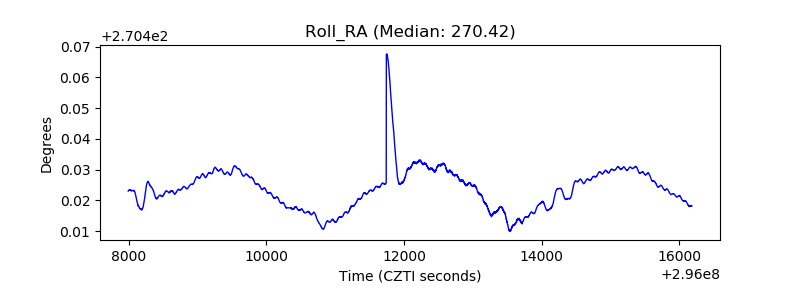 |
| Veto Counter | 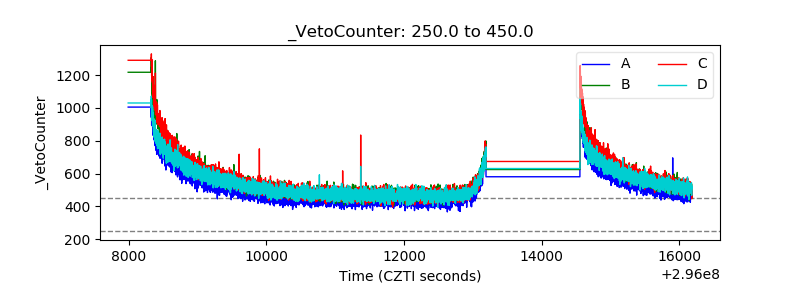 |