| Param | Original file | Final file |
|---|---|---|
| Filename | modeM0/AS1A05_221T01_9000002936_19686cztM0_level2.evt | modeM0/AS1A05_221T01_9000002936_19686cztM0_level2_quad_clean.evt |
| Size (bytes) | 557,043,840 | 85,466,880 |
| Size | 531.2 MB | 81.5 MB |
| Events in quadrant A | 3,315,100 | 584,474 |
| Events in quadrant B | 3,212,982 | 595,424 |
| Events in quadrant C | 3,296,834 | 568,846 |
| Events in quadrant D | 6,627,607 | 409,396 |
| Mode M0 | |||
|---|---|---|---|
| Quadrant | BADHDUFLAG | Total packets | Discarded packets |
| A | 0 | 13411 | 1 |
| B | 0 | 13038 | 1 |
| C | 0 | 13255 | 1 |
| D | 0 | 23599 | 1 |
| Mode M9 | |||
|---|---|---|---|
| Quadrant | BADHDUFLAG | Total packets | Discarded packets |
| A | 0 | 13 | 0 |
| B | 0 | 13 | 0 |
| C | 0 | 13 | 0 |
| D | 0 | 13 | 0 |
| Mode SS | |||
|---|---|---|---|
| Quadrant | BADHDUFLAG | Total packets | Discarded packets |
| A | 0 | 126 | 0 |
| B | 0 | 126 | 0 |
| C | 0 | 126 | 0 |
| D | 0 | 126 | 0 |
| Quadrant | Total seconds | Saturated seconds | Saturation percentage |
|---|---|---|---|
| A | 6149 | 80 | 1.301025% |
| B | 6150 | 91 | 1.479675% |
| C | 6149 | 114 | 1.853960% |
| D | 6149 | 1794 | 29.175476% |
Noise dominated data is calculated using 1-second bins in cleaned event files. If a bin has >2000 counts, and if more than 50% of those come from <1% of pixels, then it is considered to be noise-dominated and hence unusable.
| Quadrant | # 1 sec bins | Bins with >0 counts | Bins with >2000 counts | High rate bins dominated by noise | Noise dominated (total time) | Noise dominated (detector-on time) | Marked lightcurve |
|---|---|---|---|---|---|---|---|
| A | 7449 | 6149 | 17 | 17 | 0.23% | 0.28% | 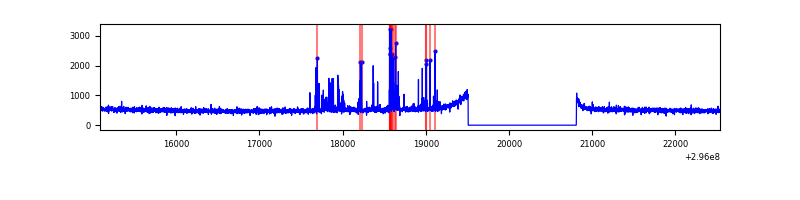 |
| B | 7450 | 6151 | 5 | 5 | 0.07% | 0.08% | 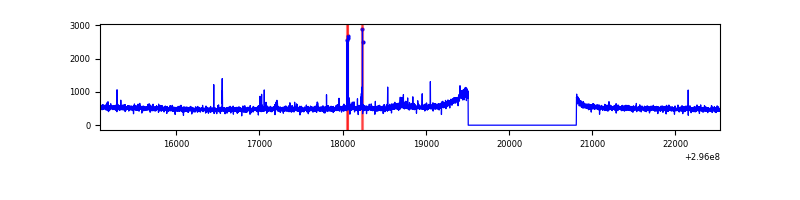 |
| C | 7449 | 6149 | 0 | 0 | 0.00% | 0.00% | 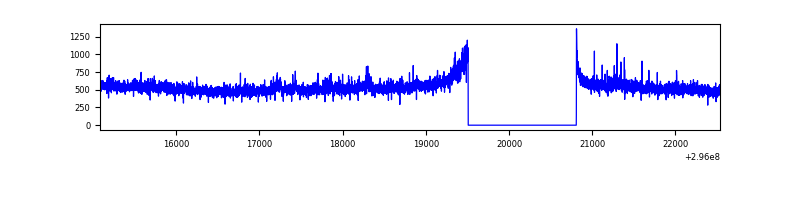 |
| D | 7449 | 6149 | 1369 | 1369 | 18.38% | 22.26% | 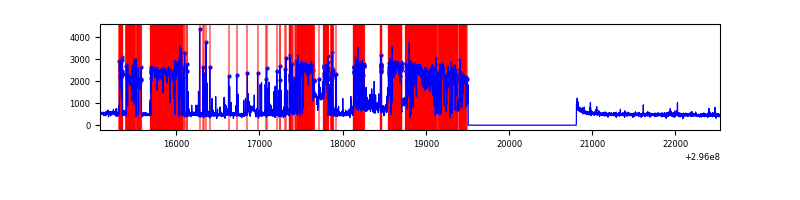 |
Top three noisy pixels from each quadrant. If the there are fewer than three noisy pixels in the level2.evt file, extra rows are filled as -1
| Pixel properties | Quadrant properties | ||||||
|---|---|---|---|---|---|---|---|
| Quadrant | DetID | PixID | Counts | Sigma | Mean | Median | Sigma |
| A | 5 | 16 | 161838 | 971.44 | 819 | 801 | 165.8 |
| A | 0 | 226 | 7156 | 38.34 | 819 | 801 | 165.8 |
| A | 3 | 137 | 5898 | 30.75 | 819 | 801 | 165.8 |
| B | 3 | 64 | 26619 | 170.07 | 805 | 788 | 151.9 |
| B | 12 | 111 | 17823 | 112.16 | 805 | 788 | 151.9 |
| B | 11 | 111 | 15469 | 96.66 | 805 | 788 | 151.9 |
| C | 14 | 238 | 122565 | 669.05 | 781 | 789 | 182.0 |
| C | 3 | 233 | 100809 | 549.52 | 781 | 789 | 182.0 |
| C | 9 | 221 | 18125 | 95.25 | 781 | 789 | 182.0 |
| D | 1 | 20 | 3187944 | 21534.88 | 609 | 593 | 148.0 |
| D | 7 | 38 | 550239 | 3713.61 | 609 | 593 | 148.0 |
| D | 1 | 52 | 310677 | 2095.04 | 609 | 593 | 148.0 |
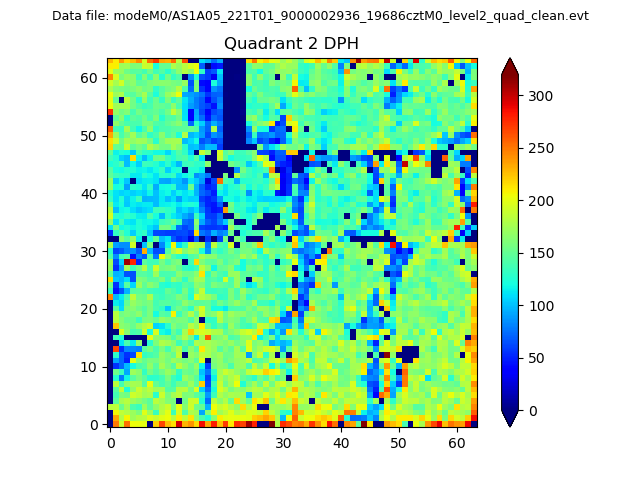
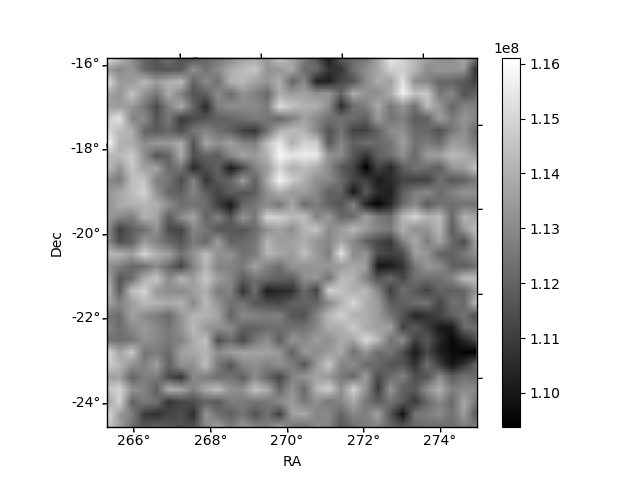
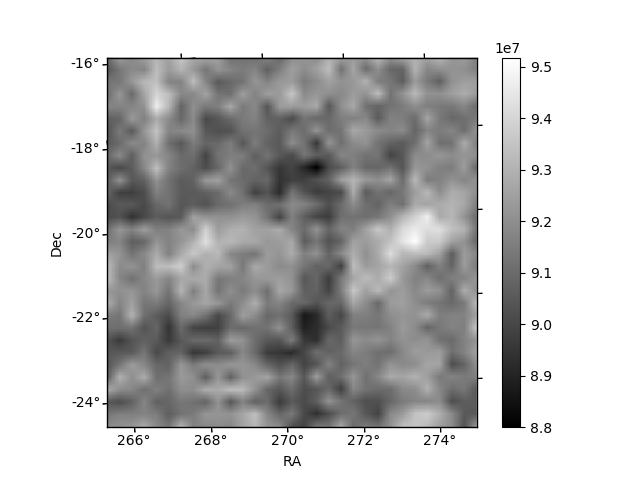
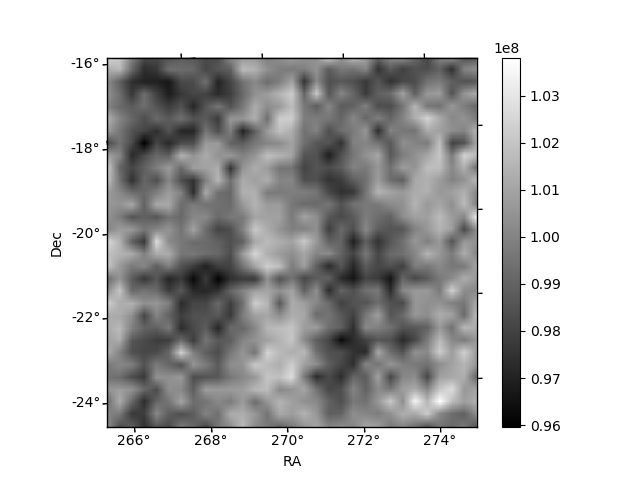
Histogram calculated using DETX and DETY for each event in the final _common_clean file
| Quadrant A | 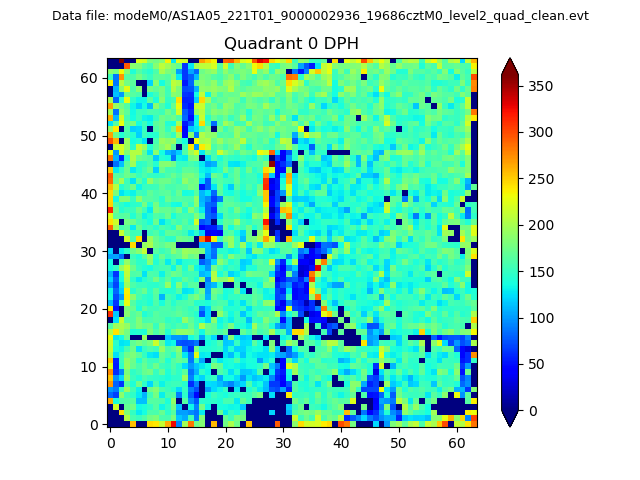 |
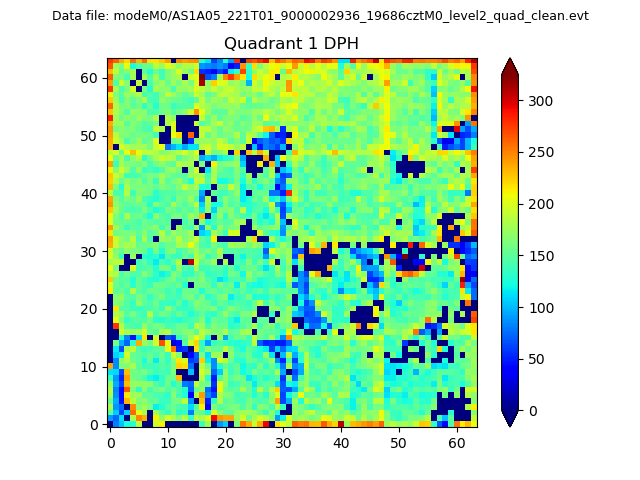 |
Quadrant B |
|---|---|---|---|
| Quadrant D | 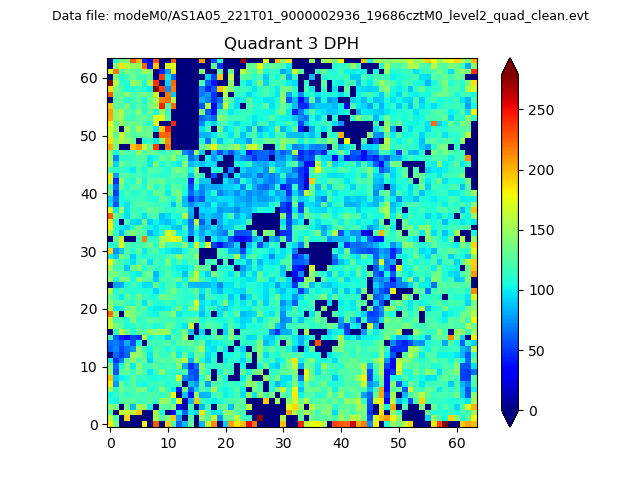 |
 |
Quadrant C |
| Plot type | Count rate plots | Images |
|---|---|---|
| Comparison with Poisson distribution Blue bars denote a histogram of data divided into 1 sec bins. Red curve is a Poisson curve with rate = median count rate of data. |
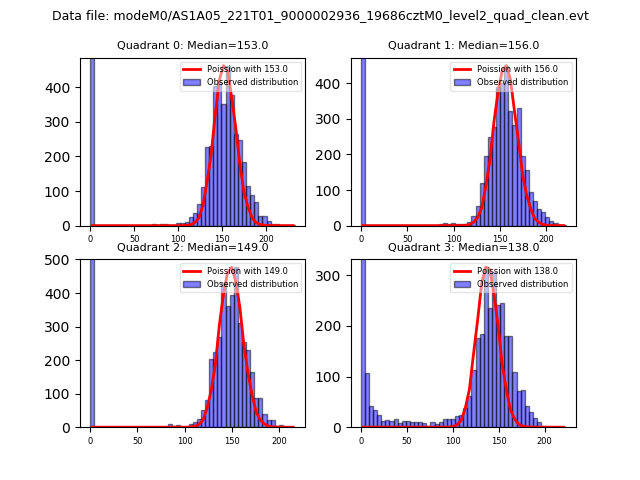 |
 |
| Quadrant-wise count rates Data is divided into 100 sec bins |
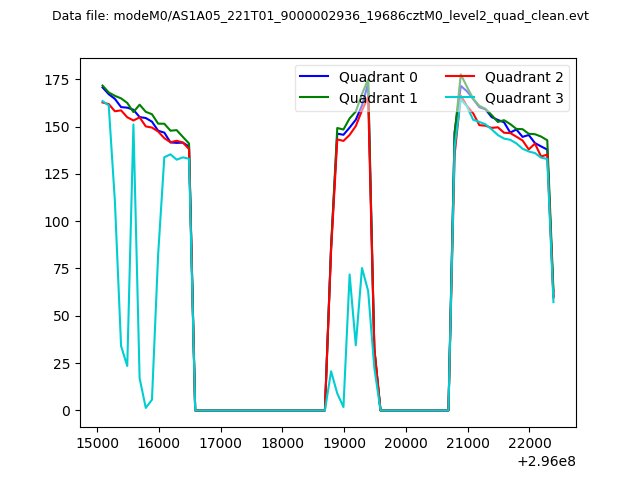 |
|
| Module-wise count rates for Quadrant A Data is divided into 100 sec bins |
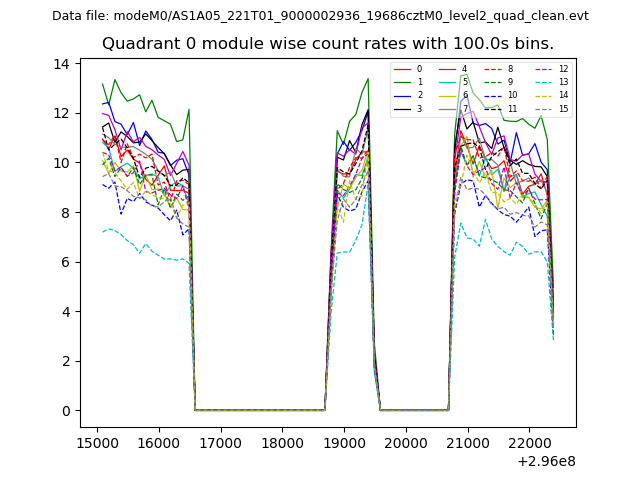 |
 |
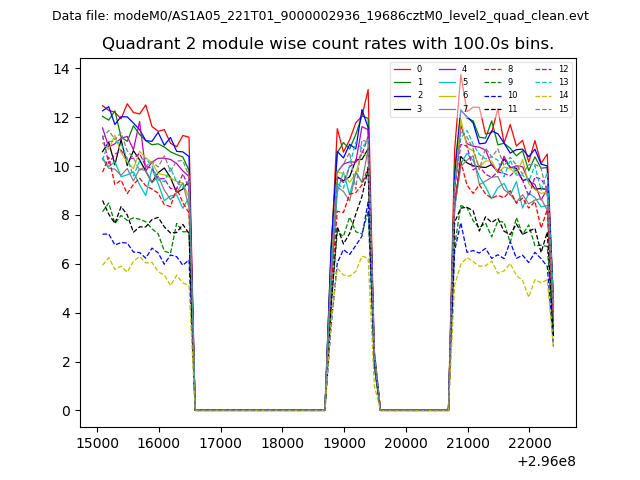
| Module-wise count rates for Quadrant B Data is divided into 100 sec bins |
 |
 |
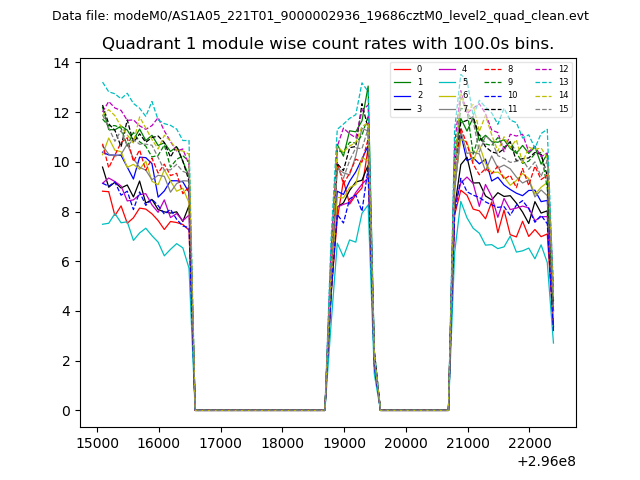
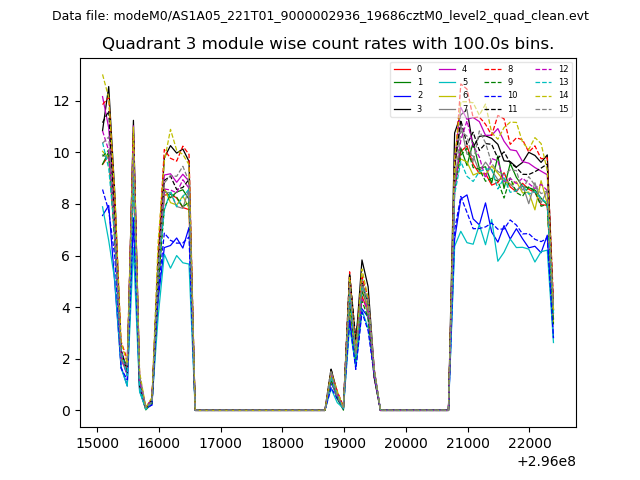
| Module-wise count rates for Quadrant C Data is divided into 100 sec bins |
 |
 |
| Module-wise count rates for Quadrant D Data is divided into 100 sec bins |
 |
 |
| Parameter | Plot |
|---|---|
| CZT HV Monitor | 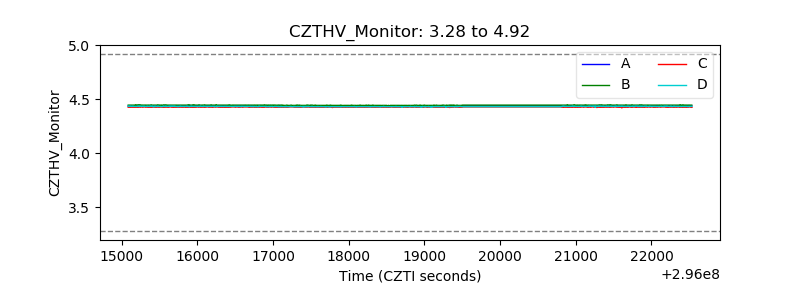 |
| D_VDD | 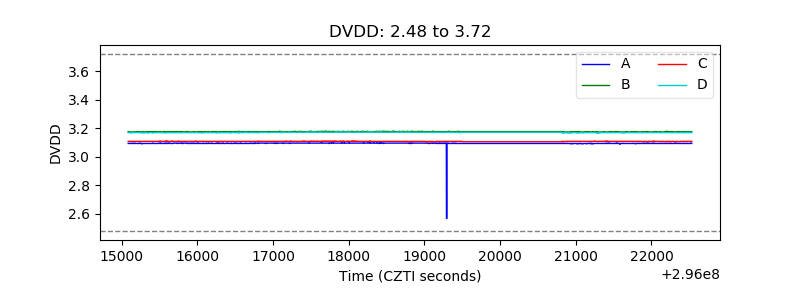 |
| Temperature 1 | 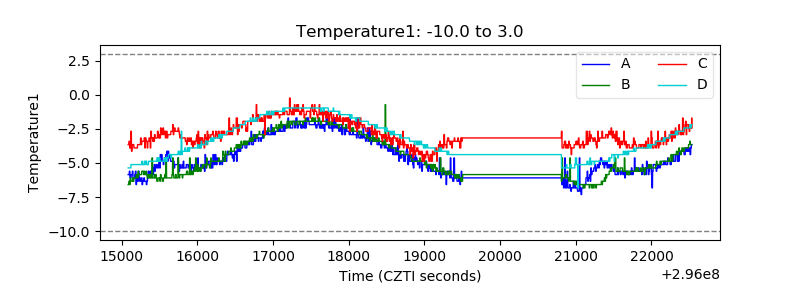 |
| Veto HV Monitor | 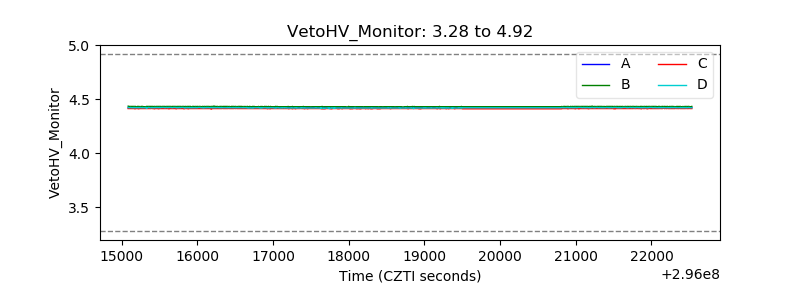 |
| Veto LLD | 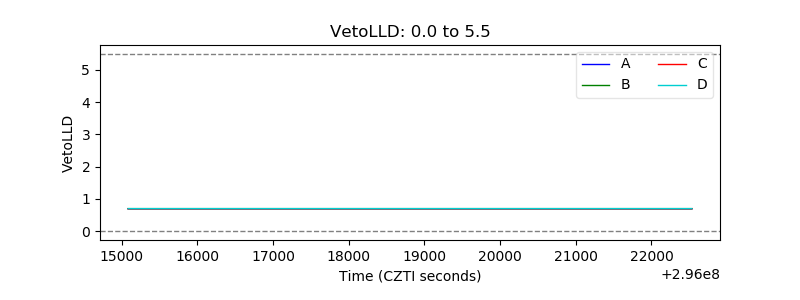 |
| Alpha Counter | 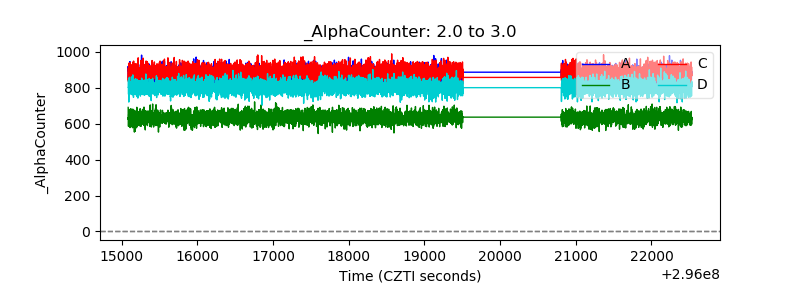 |
| _CPM_Rate | 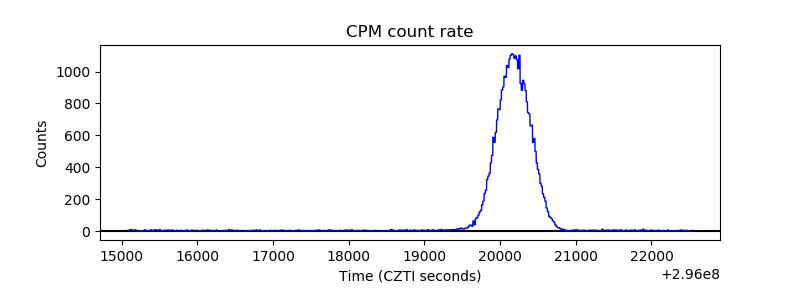 |
| CZT Counter |  |
| +2.5 Volts monitor |  |
| +5 Volts monitor | 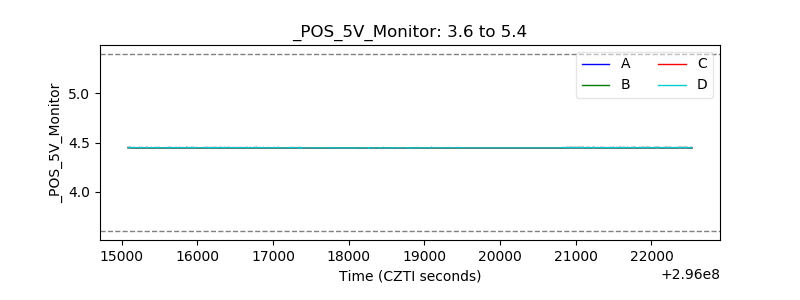 |
| _ROLL_ROT | 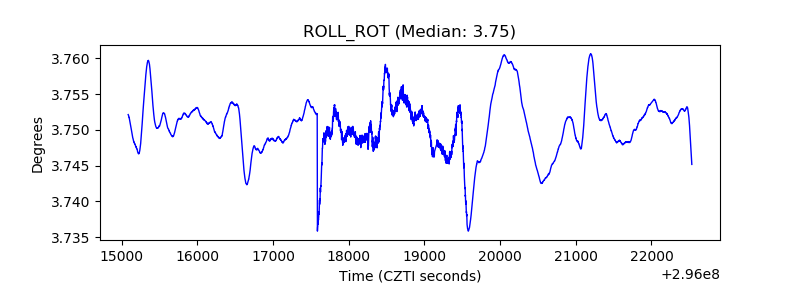 |
| _Roll_DEC | 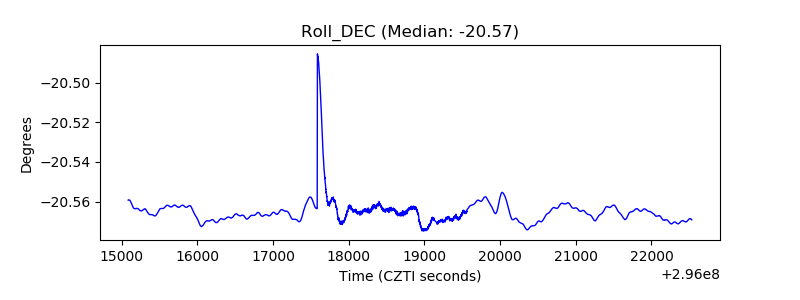 |
| _Roll_RA |  |
| Veto Counter | 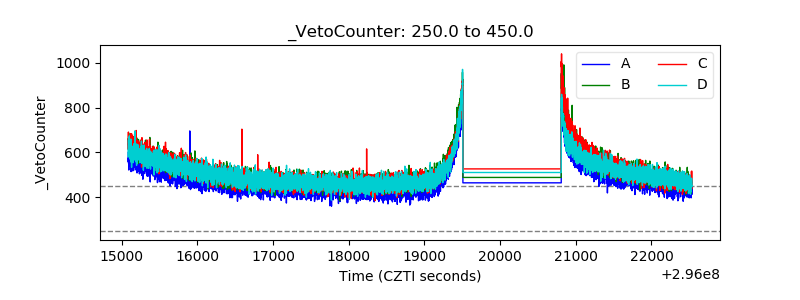 |