| Param | Original file | Final file |
|---|---|---|
| Filename | modeM0/AS1A05_221T01_9000002936_19687cztM0_level2.evt | modeM0/AS1A05_221T01_9000002936_19687cztM0_level2_quad_clean.evt |
| Size (bytes) | 278,412,480 | 41,650,560 |
| Size | 265.5 MB | 39.7 MB |
| Events in quadrant A | 1,946,583 | 248,679 |
| Events in quadrant B | 2,018,103 | 251,532 |
| Events in quadrant C | 1,975,067 | 241,299 |
| Events in quadrant D | 2,220,136 | 238,425 |
| Mode M0 | |||
|---|---|---|---|
| Quadrant | BADHDUFLAG | Total packets | Discarded packets |
| A | 0 | 8083 | 0 |
| B | 0 | 8315 | 0 |
| C | 0 | 8123 | 0 |
| D | 0 | 9044 | 0 |
| Mode SS | |||
|---|---|---|---|
| Quadrant | BADHDUFLAG | Total packets | Discarded packets |
| A | 0 | 80 | 0 |
| B | 0 | 80 | 0 |
| C | 0 | 80 | 0 |
| D | 0 | 80 | 0 |
| Quadrant | Total seconds | Saturated seconds | Saturation percentage |
|---|---|---|---|
| A | 3977 | 8 | 0.201157% |
| B | 3978 | 20 | 0.502765% |
| C | 3978 | 11 | 0.276521% |
| D | 3978 | 69 | 1.734540% |
Noise dominated data is calculated using 1-second bins in cleaned event files. If a bin has >2000 counts, and if more than 50% of those come from <1% of pixels, then it is considered to be noise-dominated and hence unusable.
| Quadrant | # 1 sec bins | Bins with >0 counts | Bins with >2000 counts | High rate bins dominated by noise | Noise dominated (total time) | Noise dominated (detector-on time) | Marked lightcurve |
|---|---|---|---|---|---|---|---|
| A | 3977 | 3977 | 1 | 1 | 0.03% | 0.03% | 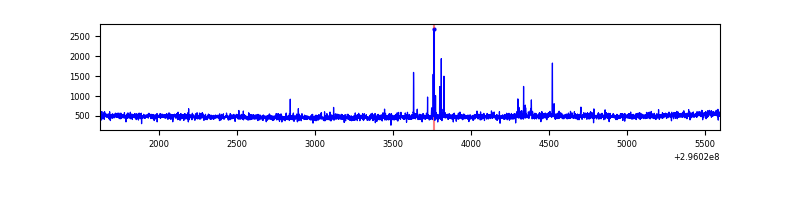 |
| B | 3978 | 3978 | 10 | 10 | 0.25% | 0.25% | 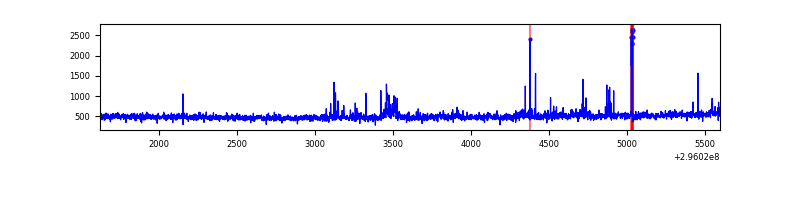 |
| C | 3978 | 3978 | 0 | 0 | 0.00% | 0.00% | 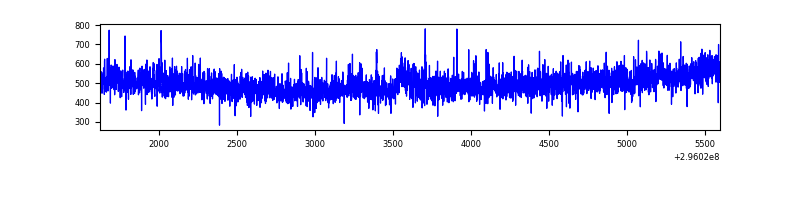 |
| D | 3978 | 3978 | 75 | 75 | 1.89% | 1.89% | 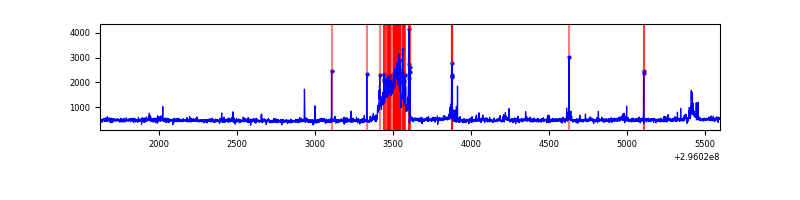 |
Top three noisy pixels from each quadrant. If the there are fewer than three noisy pixels in the level2.evt file, extra rows are filled as -1
| Pixel properties | Quadrant properties | ||||||
|---|---|---|---|---|---|---|---|
| Quadrant | DetID | PixID | Counts | Sigma | Mean | Median | Sigma |
| A | 5 | 16 | 30148 | 291.99 | 497 | 489 | 101.6 |
| A | 0 | 226 | 4367 | 38.18 | 497 | 489 | 101.6 |
| A | 3 | 137 | 3768 | 32.28 | 497 | 489 | 101.6 |
| B | 3 | 64 | 27713 | 290.23 | 492 | 480 | 93.8 |
| B | 0 | 197 | 19218 | 199.7 | 492 | 480 | 93.8 |
| B | 4 | 216 | 19002 | 197.4 | 492 | 480 | 93.8 |
| C | 14 | 238 | 75348 | 667.14 | 474 | 479 | 112.2 |
| C | 3 | 233 | 47005 | 414.58 | 474 | 479 | 112.2 |
| C | 13 | 61 | 3222 | 24.44 | 474 | 479 | 112.2 |
| D | 1 | 20 | 307933 | 2568.86 | 484 | 470 | 119.7 |
| D | 12 | 218 | 36364 | 299.9 | 484 | 470 | 119.7 |
| D | 1 | 52 | 26495 | 217.44 | 484 | 470 | 119.7 |
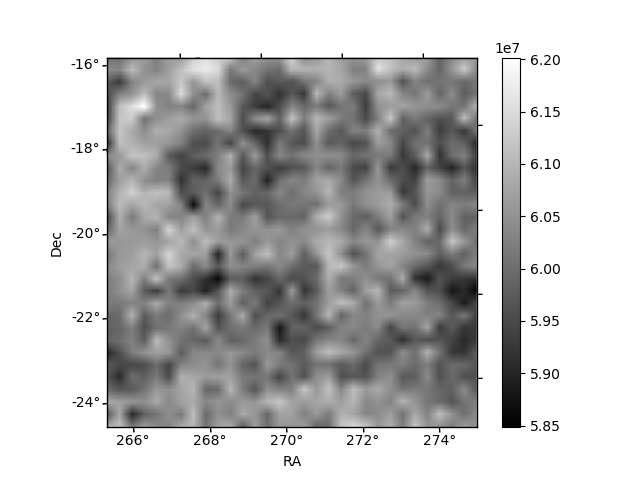
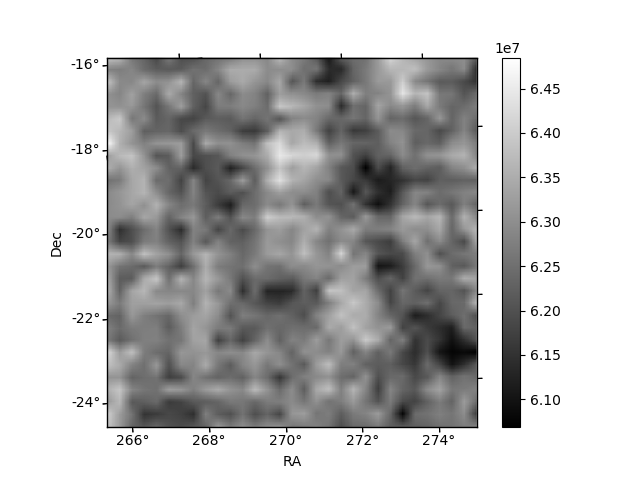
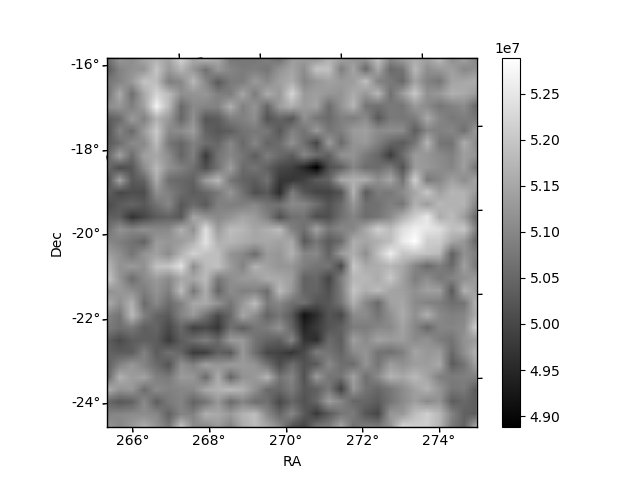
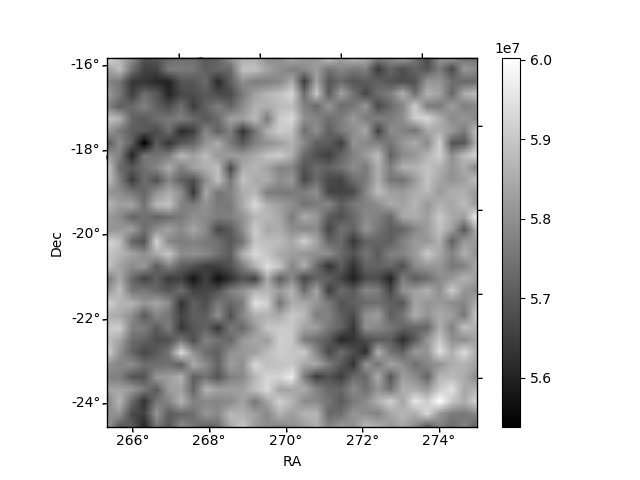
Histogram calculated using DETX and DETY for each event in the final _common_clean file
| Quadrant A |  |
 |
Quadrant B |
|---|---|---|---|
| Quadrant D |  |
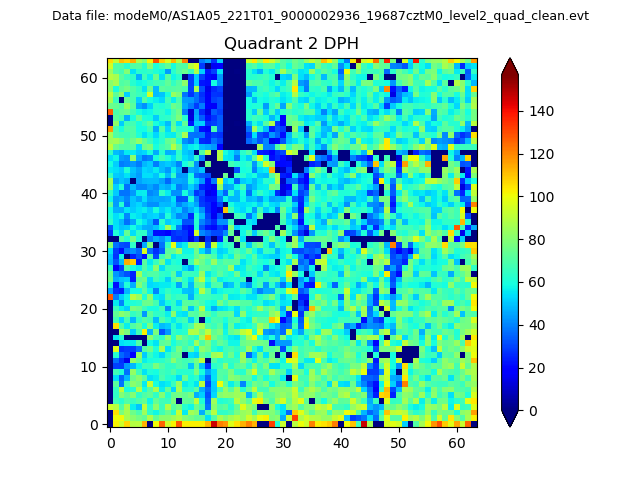 |
Quadrant C |
| Plot type | Count rate plots | Images |
|---|---|---|
| Comparison with Poisson distribution Blue bars denote a histogram of data divided into 1 sec bins. Red curve is a Poisson curve with rate = median count rate of data. |
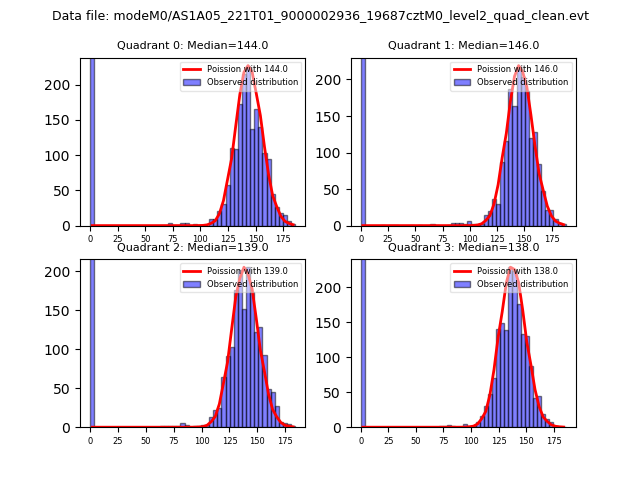 |
 |
| Quadrant-wise count rates Data is divided into 100 sec bins |
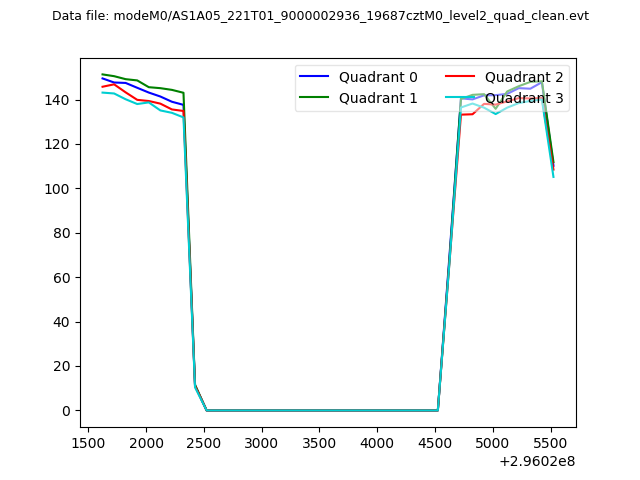 |
|
| Module-wise count rates for Quadrant A Data is divided into 100 sec bins |
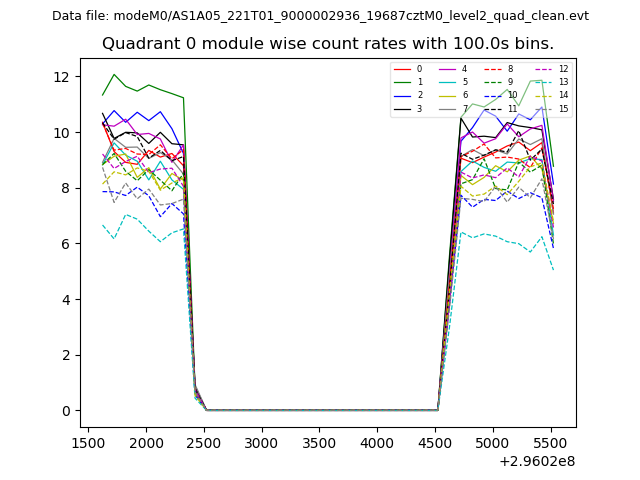 |
 |
| Module-wise count rates for Quadrant B Data is divided into 100 sec bins |
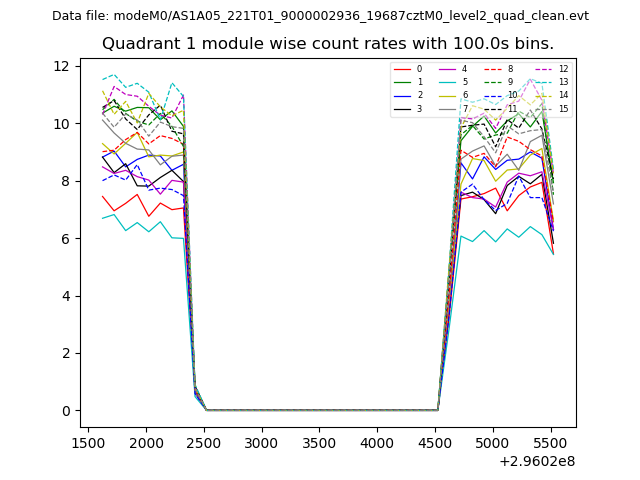 |
 |
| Module-wise count rates for Quadrant C Data is divided into 100 sec bins |
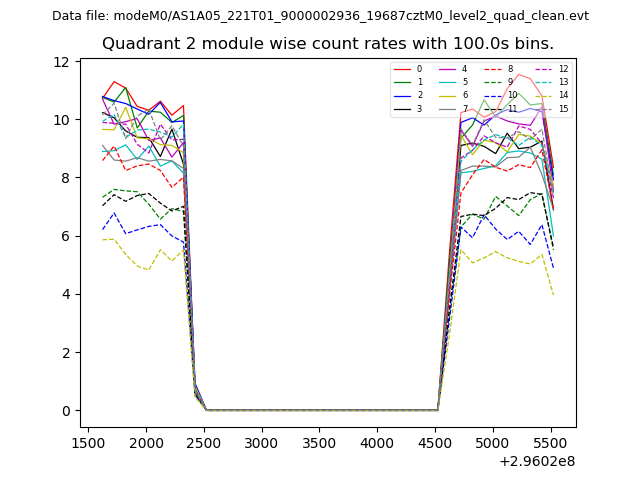 |
 |
| Module-wise count rates for Quadrant D Data is divided into 100 sec bins |
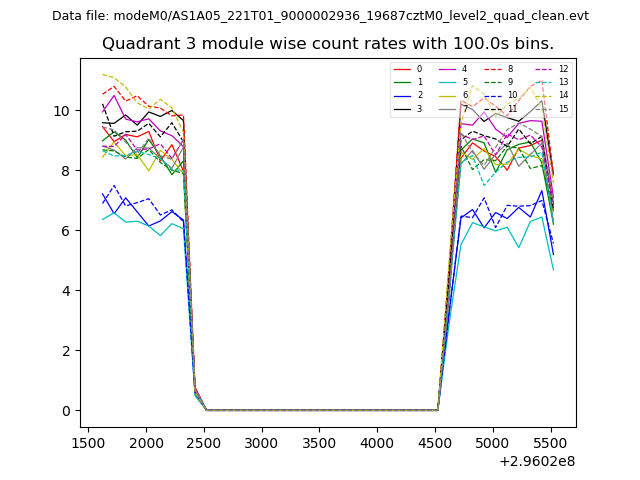 |
 |
| Parameter | Plot |
|---|---|
| CZT HV Monitor | 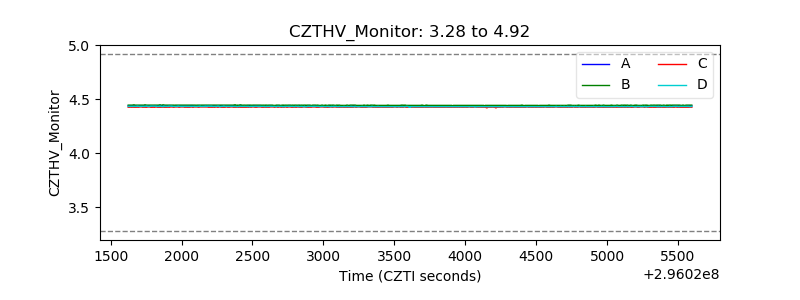 |
| D_VDD | 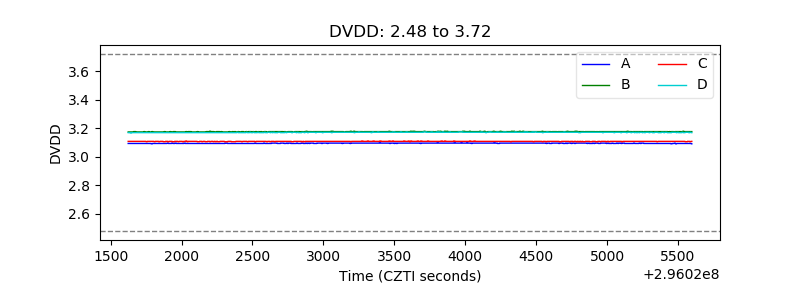 |
| Temperature 1 | 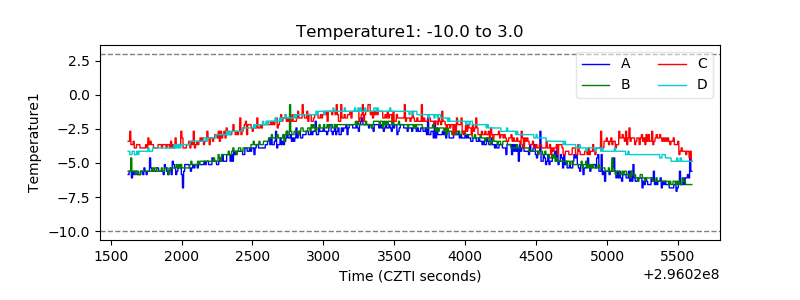 |
| Veto HV Monitor | 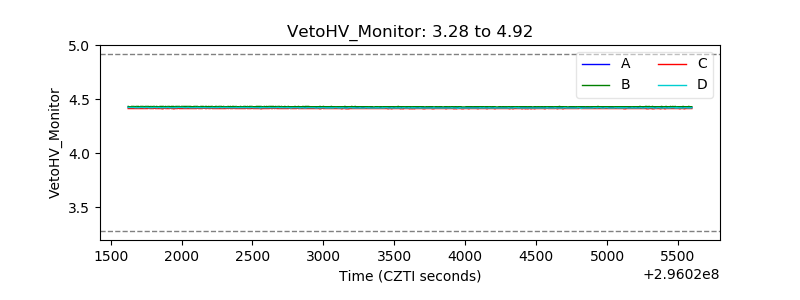 |
| Veto LLD | 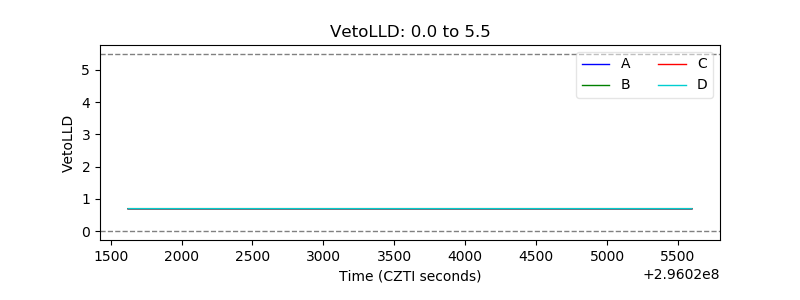 |
| Alpha Counter | 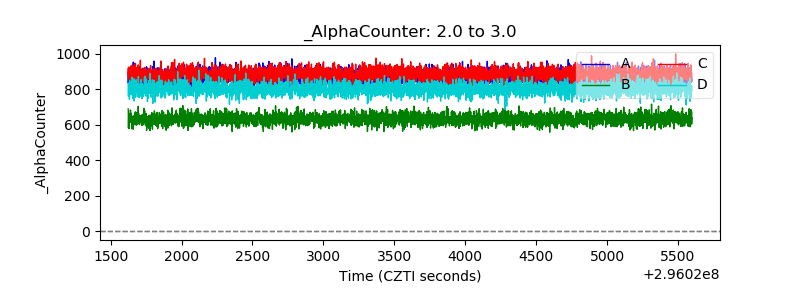 |
| _CPM_Rate | 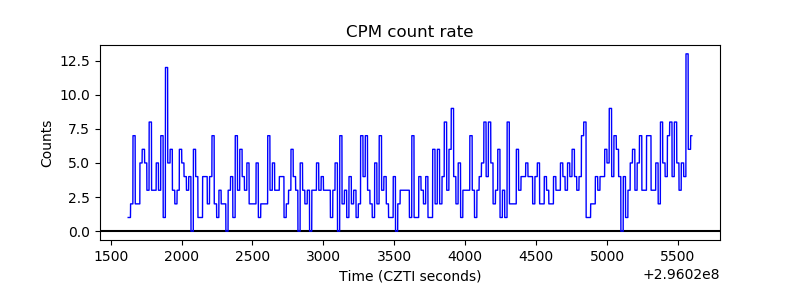 |
| CZT Counter | 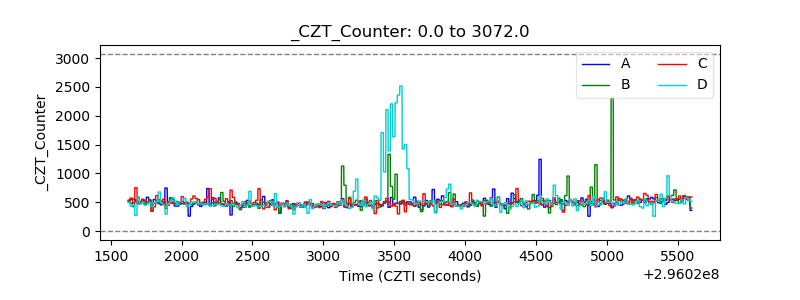 |
| +2.5 Volts monitor |  |
| +5 Volts monitor |  |
| _ROLL_ROT | 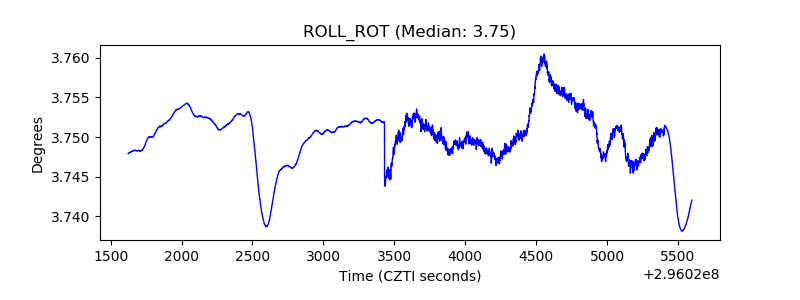 |
| _Roll_DEC | 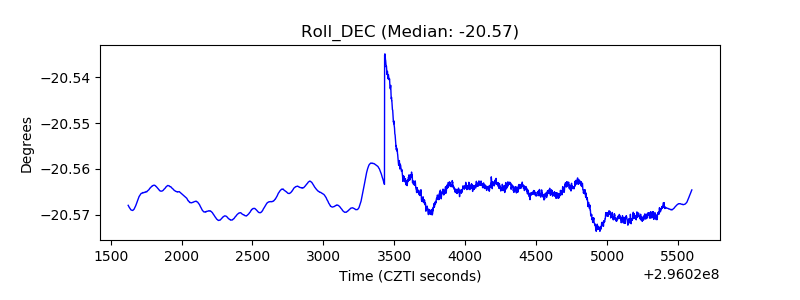 |
| _Roll_RA | 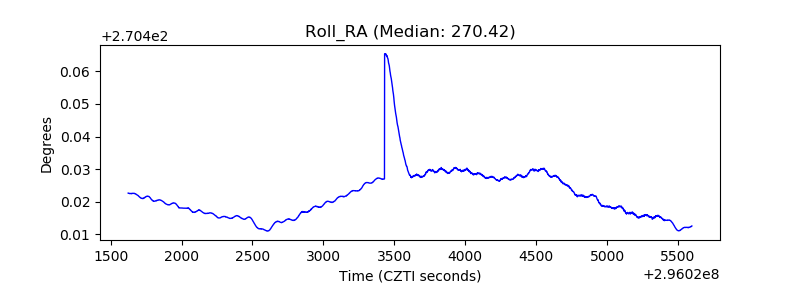 |
| Veto Counter | 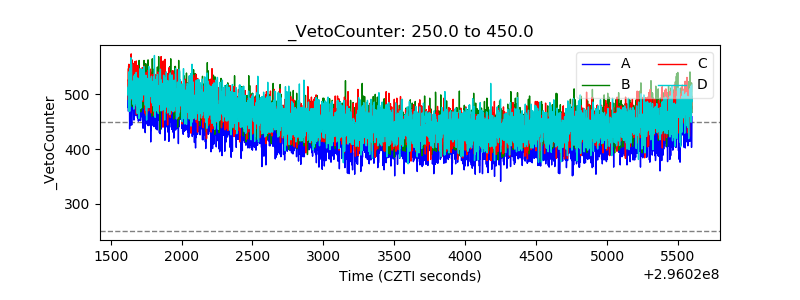 |