| Param | Original file | Final file |
|---|---|---|
| Filename | modeM0/AS1T03_037T01_9000002930cztM0_level2.fits | modeM0/AS1T03_037T01_9000002930cztM0_level2_quad_clean.evt |
| Size (bytes) | 273,677,760 | 198,527,040 |
| Size | 261.0 MB | 189.3 MB |
| Events in quadrant A | 1,684,976 | 1,074,995 |
| Events in quadrant B | 1,619,182 | 1,073,536 |
| Events in quadrant C | 1,661,598 | 1,039,832 |
| Events in quadrant D | 1,448,546 | 948,381 |
| Mode M0 | |||
|---|---|---|---|
| Quadrant | BADHDUFLAG | Total packets | Discarded packets |
| A | 0 | 57079 | 0 |
| B | 0 | 61322 | 0 |
| C | 0 | 58406 | 0 |
| D | 0 | 64488 | 0 |
| Mode M9 | |||
|---|---|---|---|
| Quadrant | BADHDUFLAG | Total packets | Discarded packets |
| A | 0 | 53 | 0 |
| B | 0 | 53 | 0 |
| C | 0 | 53 | 0 |
| D | 0 | 53 | 0 |
| Mode SS | |||
|---|---|---|---|
| Quadrant | BADHDUFLAG | Total packets | Discarded packets |
| A | 0 | 556 | 0 |
| B | 0 | 556 | 0 |
| C | 0 | 556 | 0 |
| D | 0 | 556 | 0 |
| Quadrant | Total seconds | Saturated seconds | Saturation percentage |
|---|---|---|---|
| A | 27250 | 323 | 1.185321% |
| B | 27250 | 592 | 2.172477% |
| C | 27250 | 498 | 1.827523% |
| D | 27250 | 669 | 2.455046% |
Noise dominated data is calculated using 1-second bins in cleaned event files. If a bin has >2000 counts, and if more than 50% of those come from <1% of pixels, then it is considered to be noise-dominated and hence unusable.
| Quadrant | # 1 sec bins | Bins with >0 counts | Bins with >2000 counts | High rate bins dominated by noise | Noise dominated (total time) | Noise dominated (detector-on time) | Marked lightcurve |
|---|---|---|---|---|---|---|---|
| A | 32595 | 27248 | 0 | 0 | 0.00% | 0.00% |  |
| B | 32595 | 27247 | 0 | 0 | 0.00% | 0.00% |  |
| C | 32595 | 27245 | 0 | 0 | 0.00% | 0.00% |  |
| D | 32595 | 27241 | 0 | 0 | 0.00% | 0.00% |  |
Top three noisy pixels from each quadrant. If the there are fewer than three noisy pixels in the level2.evt file, extra rows are filled as -1
| Pixel properties | Quadrant properties | ||||||
|---|---|---|---|---|---|---|---|
| Quadrant | DetID | PixID | Counts | Sigma | Mean | Median | Sigma |
| A | 0 | 29 | 1567 | 10.54 | 439 | 416 | 109.2 |
| A | 7 | 110 | 1327 | 8.34 | 439 | 416 | 109.2 |
| A | 9 | 19 | 1217 | 7.33 | 439 | 416 | 109.2 |
| B | 2 | 9 | 1329 | 10.91 | 428 | 411 | 84.2 |
| B | 2 | 8 | 1094 | 8.12 | 428 | 411 | 84.2 |
| B | 5 | 128 | 1074 | 7.88 | 428 | 411 | 84.2 |
| C | 12 | 241 | 1242 | 7.42 | 439 | 414 | 111.6 |
| C | 3 | 126 | 1165 | 6.73 | 439 | 414 | 111.6 |
| C | 3 | 235 | 1158 | 6.67 | 439 | 414 | 111.6 |
| D | 10 | 189 | 1072 | 6.24 | 414 | 379 | 111.1 |
| D | 6 | 67 | 1043 | 5.98 | 414 | 379 | 111.1 |
| D | 7 | 3 | 1021 | 5.78 | 414 | 379 | 111.1 |
Histogram calculated using DETX and DETY for each event in the final _common_clean file
| Quadrant A | 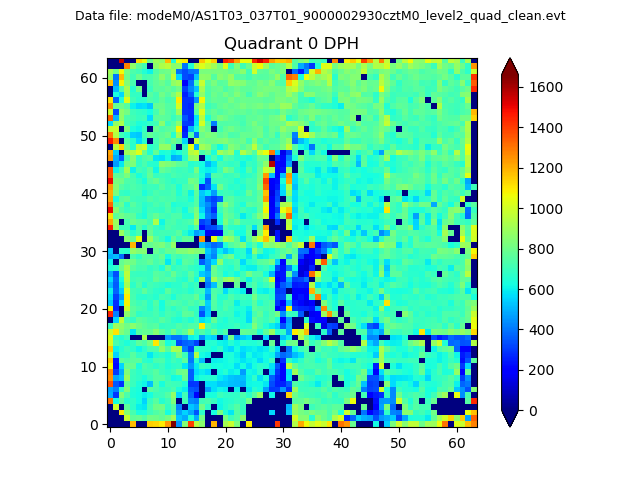 |
 |
Quadrant B |
|---|---|---|---|
| Quadrant D |  |
 |
Quadrant C |
| Plot type | Count rate plots | Images |
|---|---|---|
| Comparison with Poisson distribution Blue bars denote a histogram of data divided into 1 sec bins. Red curve is a Poisson curve with rate = median count rate of data. |
 |
 |
| Quadrant-wise count rates Data is divided into 100 sec bins |
 |
|
| Module-wise count rates for Quadrant A Data is divided into 100 sec bins |
 |
 |
| Module-wise count rates for Quadrant B Data is divided into 100 sec bins |
 |
 |
| Module-wise count rates for Quadrant C Data is divided into 100 sec bins |
 |
 |
| Module-wise count rates for Quadrant D Data is divided into 100 sec bins |
 |
 |
| Parameter | Plot |
|---|---|
| CZT HV Monitor |  |
| D_VDD |  |
| Temperature 1 |  |
| Veto HV Monitor |  |
| Veto LLD |  |
| Alpha Counter |  |
| _CPM_Rate |  |
| CZT Counter |  |
| +2.5 Volts monitor |  |
| +5 Volts monitor |  |
| _ROLL_ROT |  |
| _Roll_DEC |  |
| _Roll_RA |  |
| Veto Counter |  |