| Param | Original file | Final file |
|---|---|---|
| Filename | modeM0/AS1T03_037T01_9000002930_19670cztM0_level2.evt | modeM0/AS1T03_037T01_9000002930_19670cztM0_level2_quad_clean.evt |
| Size (bytes) | 286,954,560 | 61,859,520 |
| Size | 273.7 MB | 59.0 MB |
| Events in quadrant A | 1,978,802 | 400,484 |
| Events in quadrant B | 2,176,595 | 416,522 |
| Events in quadrant C | 2,166,801 | 396,089 |
| Events in quadrant D | 2,101,879 | 384,547 |
| Mode M0 | |||
|---|---|---|---|
| Quadrant | BADHDUFLAG | Total packets | Discarded packets |
| A | 0 | 8165 | 1 |
| B | 0 | 8797 | 1 |
| C | 0 | 8854 | 1 |
| D | 0 | 8721 | 1 |
| Mode M9 | |||
|---|---|---|---|
| Quadrant | BADHDUFLAG | Total packets | Discarded packets |
| A | 0 | 14 | 0 |
| B | 0 | 14 | 0 |
| C | 0 | 14 | 0 |
| D | 0 | 14 | 0 |
| Mode SS | |||
|---|---|---|---|
| Quadrant | BADHDUFLAG | Total packets | Discarded packets |
| A | 0 | 80 | 0 |
| B | 0 | 80 | 0 |
| C | 0 | 80 | 0 |
| D | 0 | 80 | 0 |
| Quadrant | Total seconds | Saturated seconds | Saturation percentage |
|---|---|---|---|
| A | 3902 | 16 | 0.410046% |
| B | 3902 | 46 | 1.178883% |
| C | 3902 | 48 | 1.230138% |
| D | 3902 | 22 | 0.563813% |
Noise dominated data is calculated using 1-second bins in cleaned event files. If a bin has >2000 counts, and if more than 50% of those come from <1% of pixels, then it is considered to be noise-dominated and hence unusable.
| Quadrant | # 1 sec bins | Bins with >0 counts | Bins with >2000 counts | High rate bins dominated by noise | Noise dominated (total time) | Noise dominated (detector-on time) | Marked lightcurve |
|---|---|---|---|---|---|---|---|
| A | 5252 | 3903 | 0 | 0 | 0.00% | 0.00% | 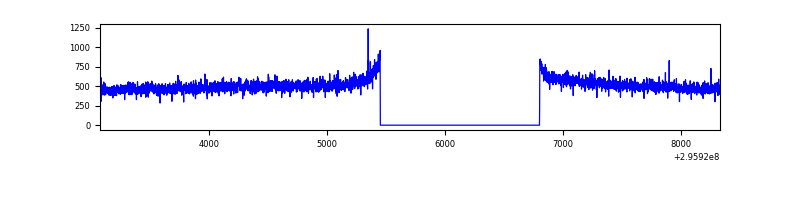 |
| B | 5252 | 3903 | 11 | 11 | 0.21% | 0.28% | 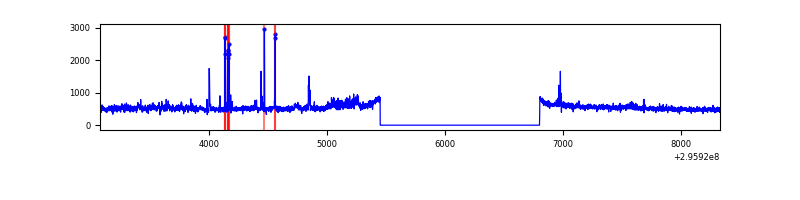 |
| C | 5252 | 3903 | 0 | 0 | 0.00% | 0.00% | 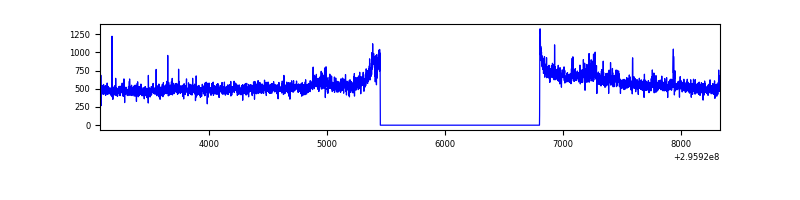 |
| D | 5252 | 3903 | 17 | 17 | 0.32% | 0.44% | 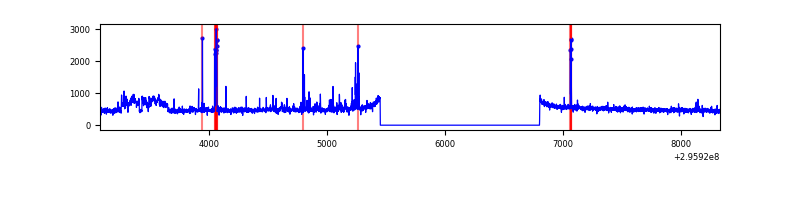 |
Top three noisy pixels from each quadrant. If the there are fewer than three noisy pixels in the level2.evt file, extra rows are filled as -1
| Pixel properties | Quadrant properties | ||||||
|---|---|---|---|---|---|---|---|
| Quadrant | DetID | PixID | Counts | Sigma | Mean | Median | Sigma |
| A | 11 | 29 | 20969 | 202.33 | 508 | 499 | 101.2 |
| A | 0 | 226 | 4377 | 38.33 | 508 | 499 | 101.2 |
| A | 3 | 137 | 3827 | 32.9 | 508 | 499 | 101.2 |
| B | 0 | 198 | 68583 | 716.68 | 511 | 499 | 95.0 |
| B | 4 | 216 | 43174 | 449.21 | 511 | 499 | 95.0 |
| B | 4 | 171 | 35036 | 363.55 | 511 | 499 | 95.0 |
| C | 3 | 233 | 120956 | 1036.78 | 499 | 502 | 116.2 |
| C | 14 | 238 | 78510 | 671.43 | 499 | 502 | 116.2 |
| C | 9 | 221 | 22747 | 191.46 | 499 | 502 | 116.2 |
| D | 1 | 20 | 113968 | 939.17 | 500 | 486 | 120.8 |
| D | 12 | 218 | 98769 | 813.38 | 500 | 486 | 120.8 |
| D | 2 | 234 | 15870 | 127.32 | 500 | 486 | 120.8 |
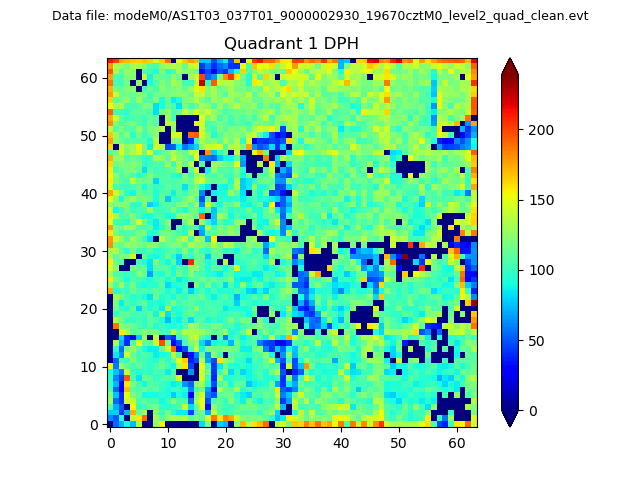
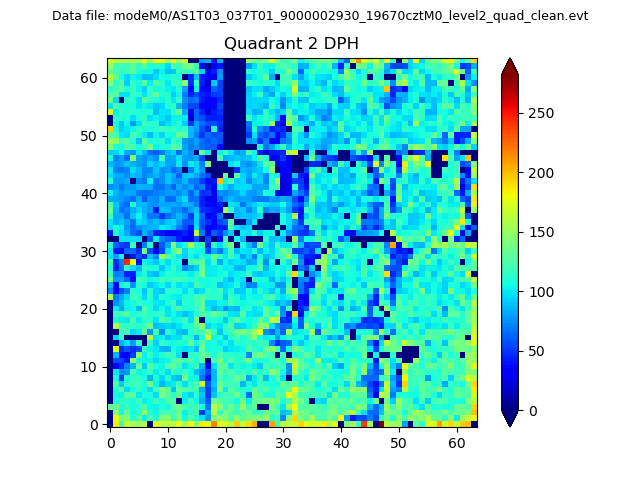
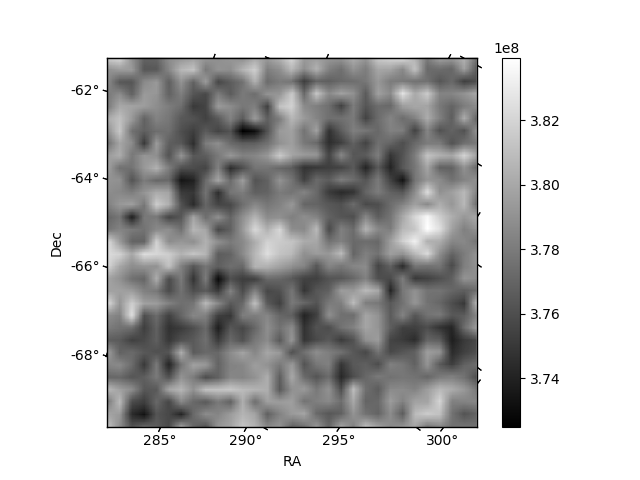
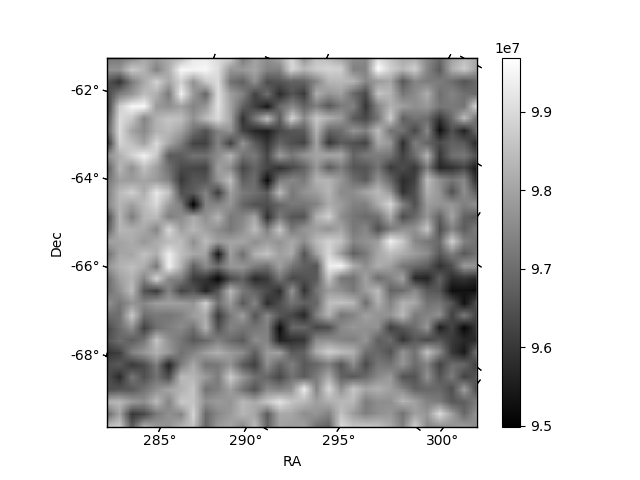
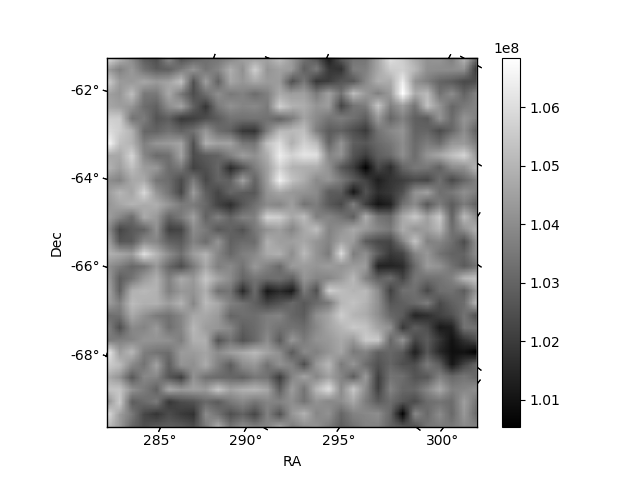
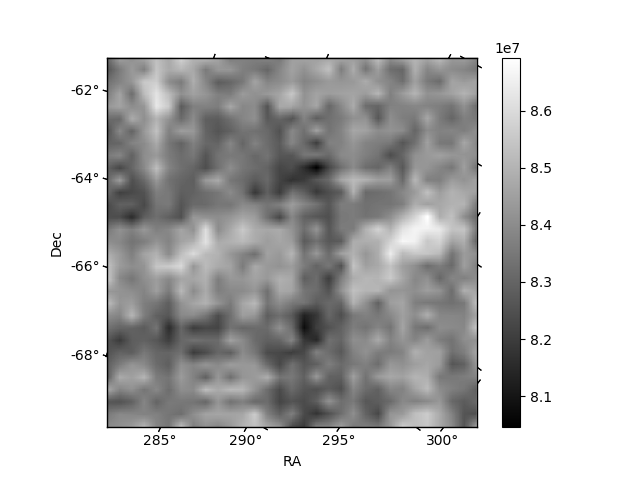
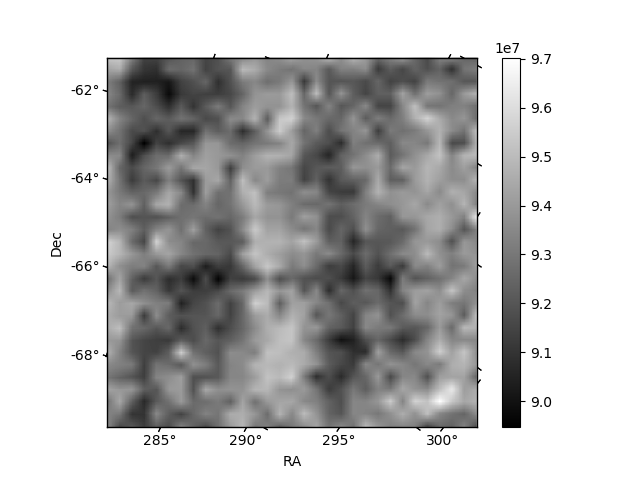
Histogram calculated using DETX and DETY for each event in the final _common_clean file
| Quadrant A |  |
 |
Quadrant B |
|---|---|---|---|
| Quadrant D | 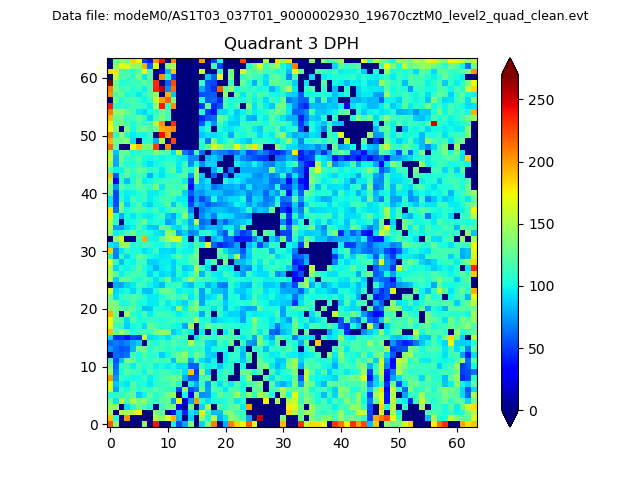 |
 |
Quadrant C |
| Plot type | Count rate plots | Images |
|---|---|---|
| Comparison with Poisson distribution Blue bars denote a histogram of data divided into 1 sec bins. Red curve is a Poisson curve with rate = median count rate of data. |
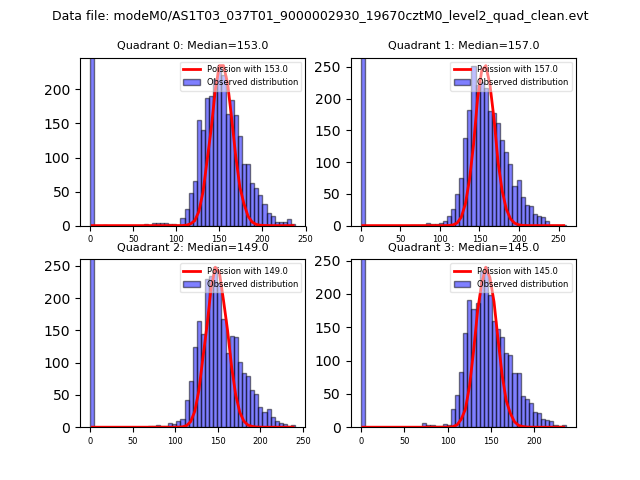 |
 |
| Quadrant-wise count rates Data is divided into 100 sec bins |
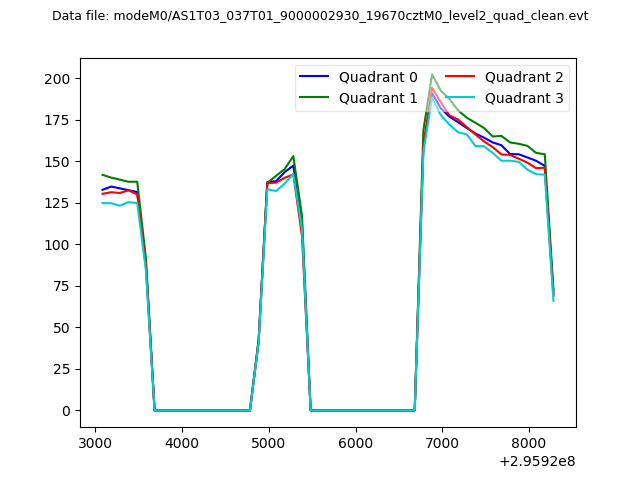 |
|
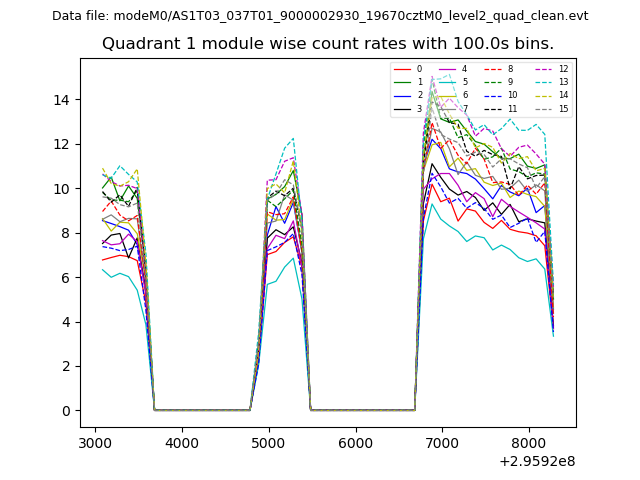
| Module-wise count rates for Quadrant A Data is divided into 100 sec bins |
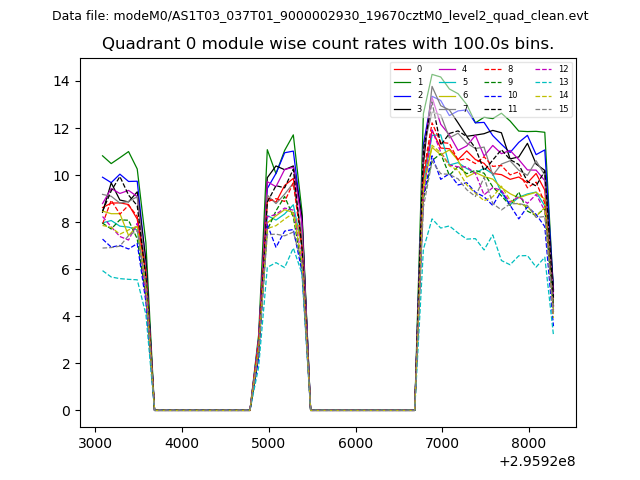 |
 |
| Module-wise count rates for Quadrant B Data is divided into 100 sec bins |
 |
 |
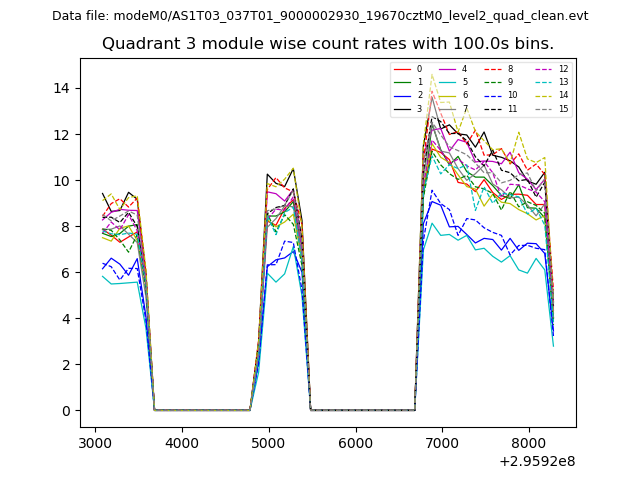
| Module-wise count rates for Quadrant C Data is divided into 100 sec bins |
 |
 |
| Module-wise count rates for Quadrant D Data is divided into 100 sec bins |
 |
 |
| Parameter | Plot |
|---|---|
| CZT HV Monitor | 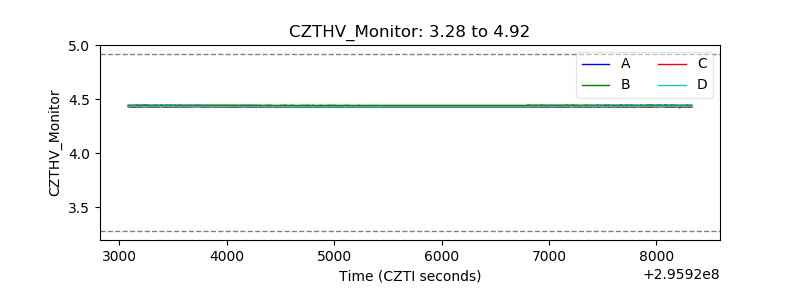 |
| D_VDD | 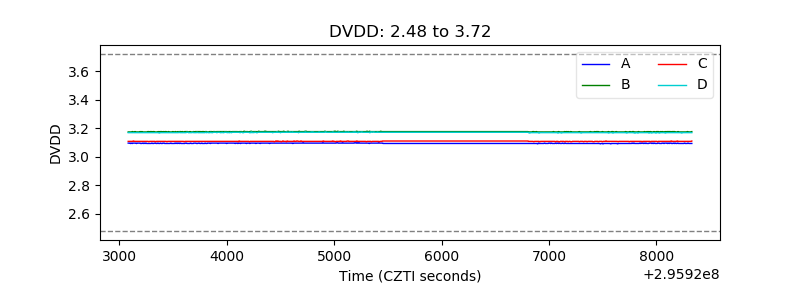 |
| Temperature 1 | 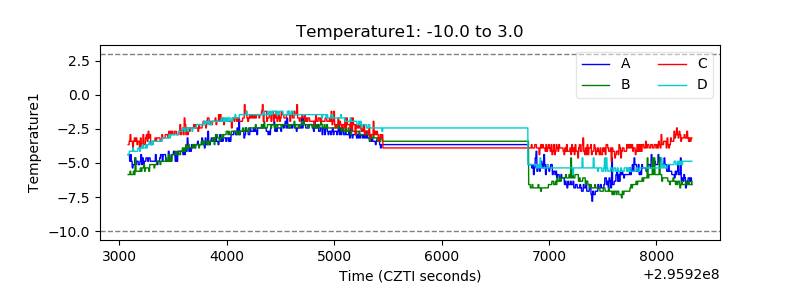 |
| Veto HV Monitor | 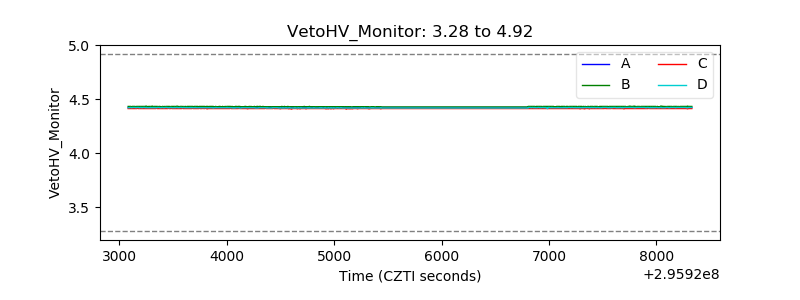 |
| Veto LLD | 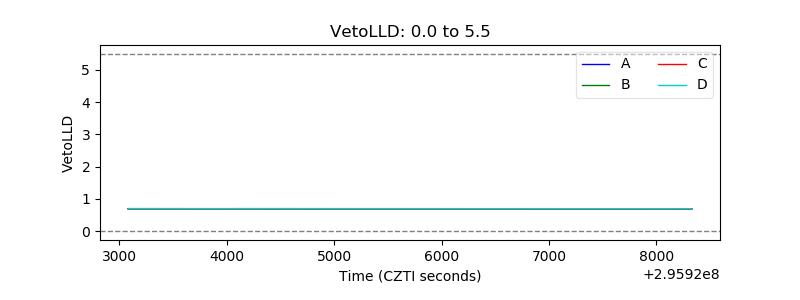 |
| Alpha Counter | 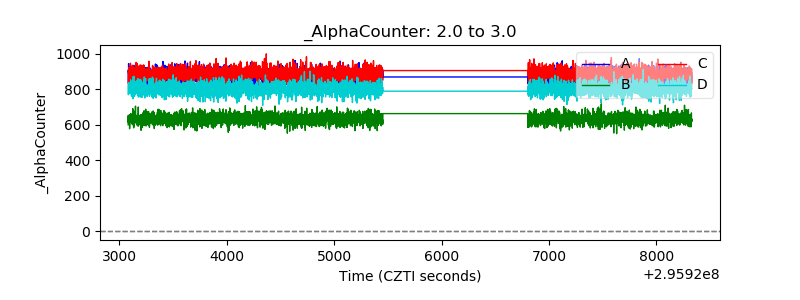 |
| _CPM_Rate | 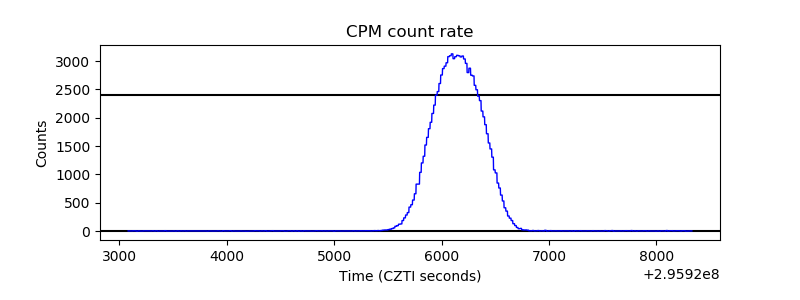 |
| CZT Counter | 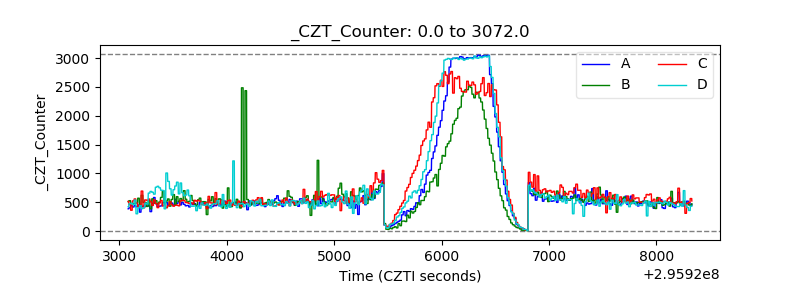 |
| +2.5 Volts monitor | 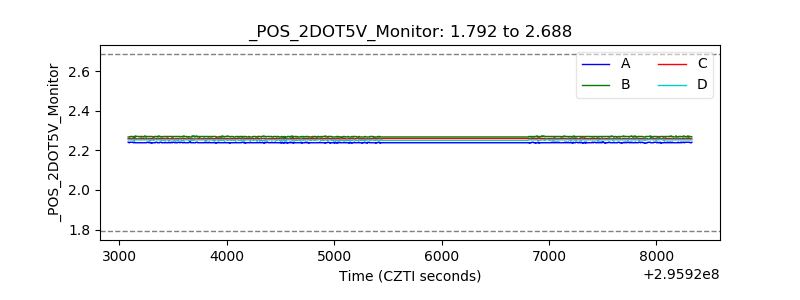 |
| +5 Volts monitor |  |
| _ROLL_ROT | 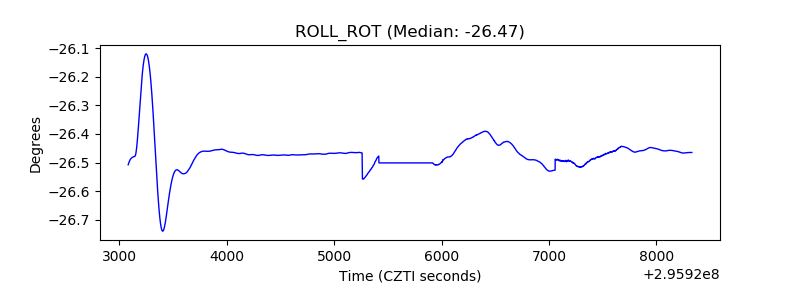 |
| _Roll_DEC | 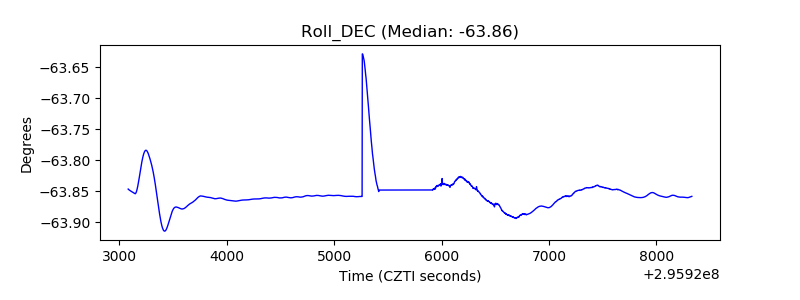 |
| _Roll_RA | 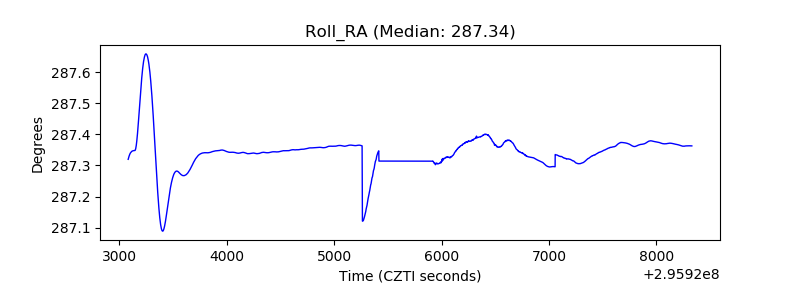 |
| Veto Counter | 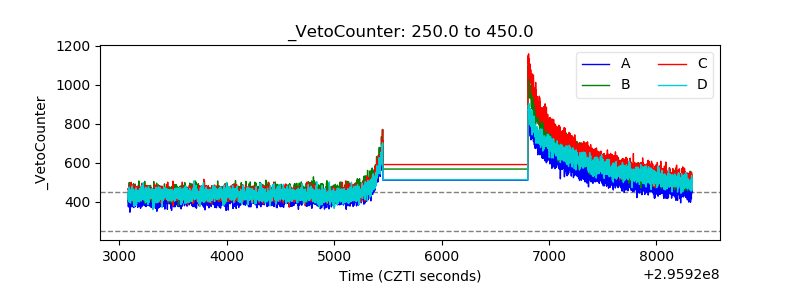 |