| Param | Original file | Final file |
|---|---|---|
| Filename | modeM0/AS1T03_037T01_9000002930_19671cztM0_level2.evt | modeM0/AS1T03_037T01_9000002930_19671cztM0_level2_quad_clean.evt |
| Size (bytes) | 472,078,080 | 116,576,640 |
| Size | 450.2 MB | 111.2 MB |
| Events in quadrant A | 3,221,588 | 774,017 |
| Events in quadrant B | 3,335,443 | 803,508 |
| Events in quadrant C | 3,606,133 | 767,793 |
| Events in quadrant D | 3,703,191 | 743,273 |
| Mode M0 | |||
|---|---|---|---|
| Quadrant | BADHDUFLAG | Total packets | Discarded packets |
| A | 0 | 13357 | 3 |
| B | 0 | 13667 | 2 |
| C | 0 | 14617 | 2 |
| D | 0 | 15006 | 2 |
| Mode M9 | |||
|---|---|---|---|
| Quadrant | BADHDUFLAG | Total packets | Discarded packets |
| A | 0 | 21 | 0 |
| B | 0 | 22 | 0 |
| C | 0 | 22 | 0 |
| D | 0 | 22 | 0 |
| Mode SS | |||
|---|---|---|---|
| Quadrant | BADHDUFLAG | Total packets | Discarded packets |
| A | 0 | 128 | 0 |
| B | 0 | 128 | 0 |
| C | 0 | 128 | 0 |
| D | 0 | 128 | 0 |
| Quadrant | Total seconds | Saturated seconds | Saturation percentage |
|---|---|---|---|
| A | 6342 | 52 | 0.819931% |
| B | 6342 | 62 | 0.977610% |
| C | 6342 | 124 | 1.955219% |
| D | 6342 | 135 | 2.128666% |
Noise dominated data is calculated using 1-second bins in cleaned event files. If a bin has >2000 counts, and if more than 50% of those come from <1% of pixels, then it is considered to be noise-dominated and hence unusable.
| Quadrant | # 1 sec bins | Bins with >0 counts | Bins with >2000 counts | High rate bins dominated by noise | Noise dominated (total time) | Noise dominated (detector-on time) | Marked lightcurve |
|---|---|---|---|---|---|---|---|
| A | 7667 | 6343 | 2 | 2 | 0.03% | 0.03% | 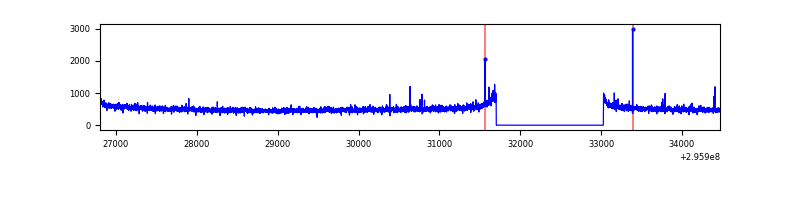 |
| B | 7667 | 6343 | 0 | 0 | 0.00% | 0.00% | 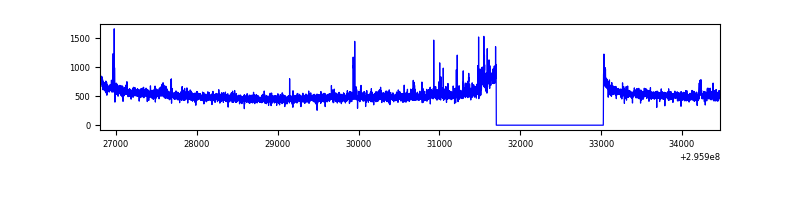 |
| C | 7667 | 6342 | 2 | 2 | 0.03% | 0.03% |  |
| D | 7667 | 6342 | 81 | 81 | 1.06% | 1.28% | 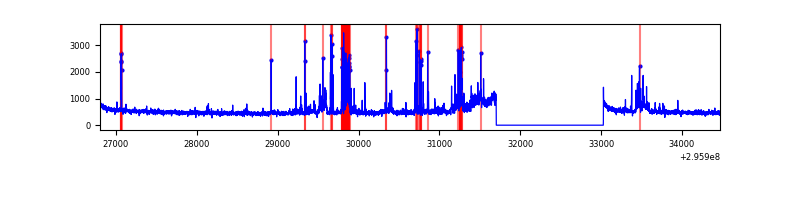 |
Top three noisy pixels from each quadrant. If the there are fewer than three noisy pixels in the level2.evt file, extra rows are filled as -1
| Pixel properties | Quadrant properties | ||||||
|---|---|---|---|---|---|---|---|
| Quadrant | DetID | PixID | Counts | Sigma | Mean | Median | Sigma |
| A | 11 | 29 | 33522 | 200.63 | 821 | 805 | 163.1 |
| A | 5 | 16 | 27790 | 165.48 | 821 | 805 | 163.1 |
| A | 0 | 226 | 7018 | 38.1 | 821 | 805 | 163.1 |
| B | 3 | 112 | 25800 | 163.11 | 829 | 808 | 153.2 |
| B | 0 | 198 | 25228 | 159.38 | 829 | 808 | 153.2 |
| B | 4 | 216 | 24368 | 153.76 | 829 | 808 | 153.2 |
| C | 3 | 233 | 210546 | 1113.65 | 814 | 822 | 188.3 |
| C | 14 | 238 | 129180 | 681.59 | 814 | 822 | 188.3 |
| C | 9 | 221 | 73238 | 384.53 | 814 | 822 | 188.3 |
| D | 12 | 218 | 399837 | 2069.25 | 811 | 791 | 192.8 |
| D | 1 | 20 | 130371 | 671.94 | 811 | 791 | 192.8 |
| D | 1 | 52 | 49197 | 251.01 | 811 | 791 | 192.8 |
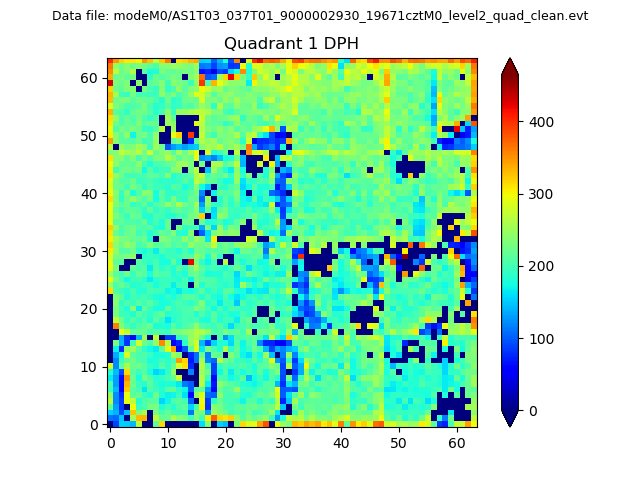
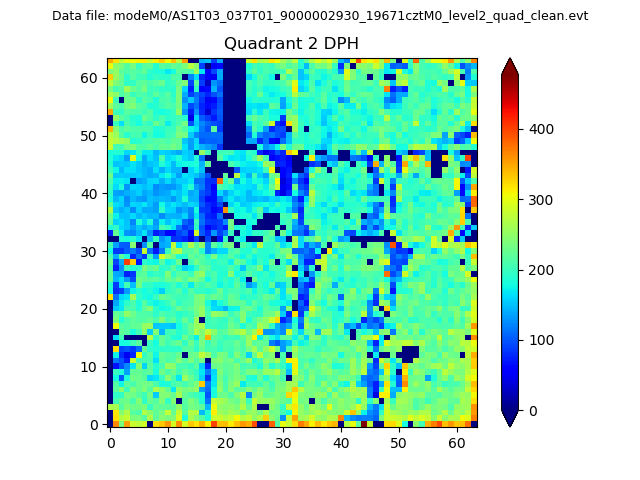
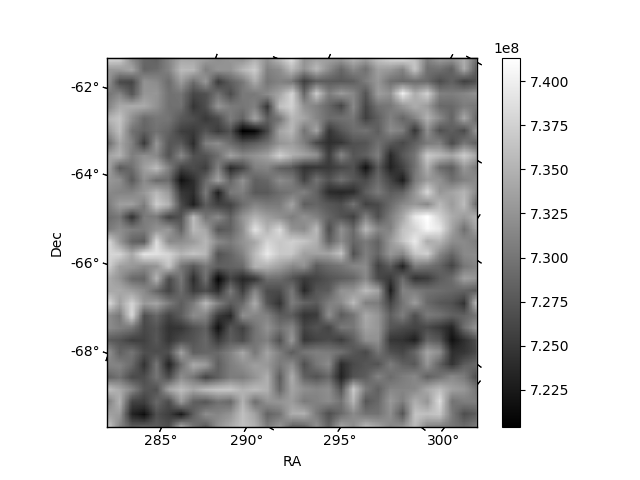
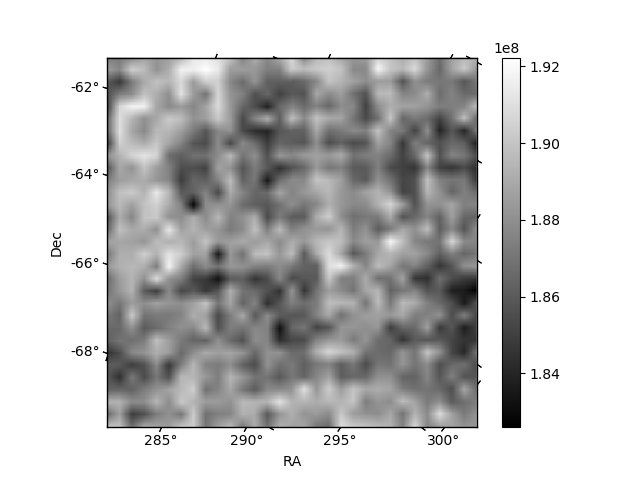
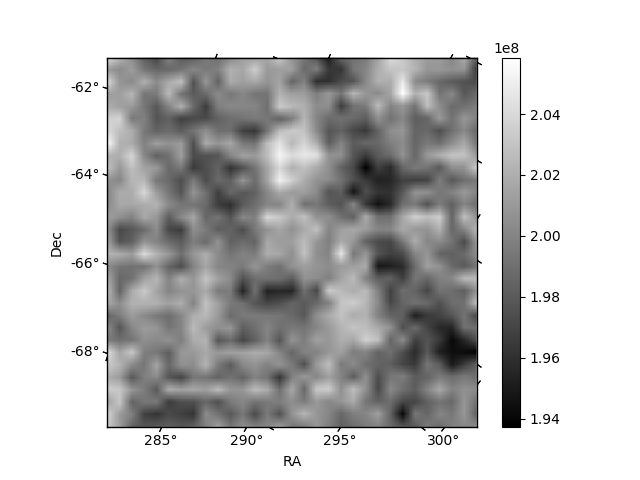
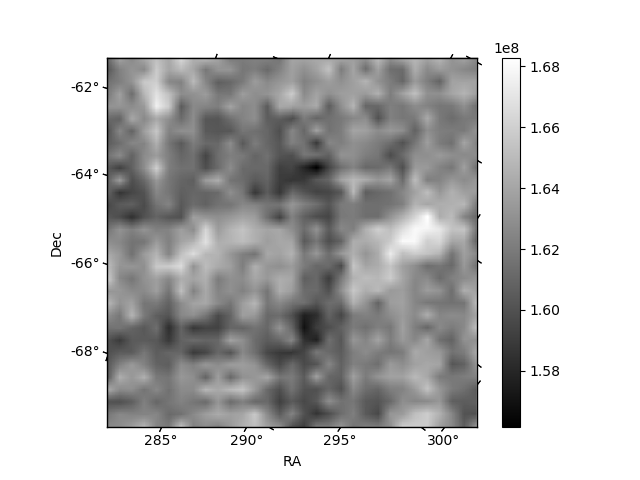
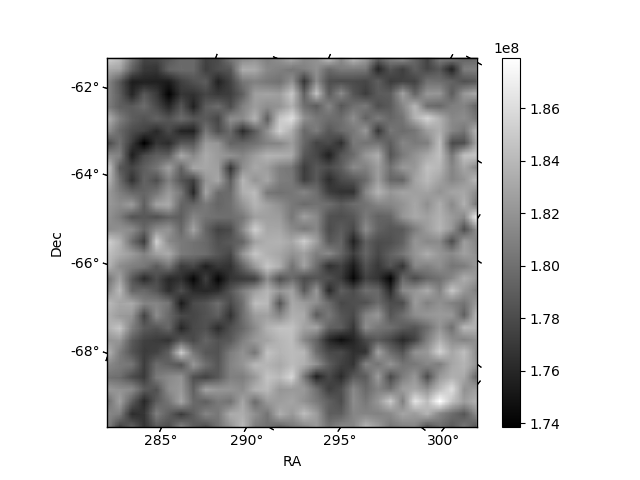
Histogram calculated using DETX and DETY for each event in the final _common_clean file
| Quadrant A | 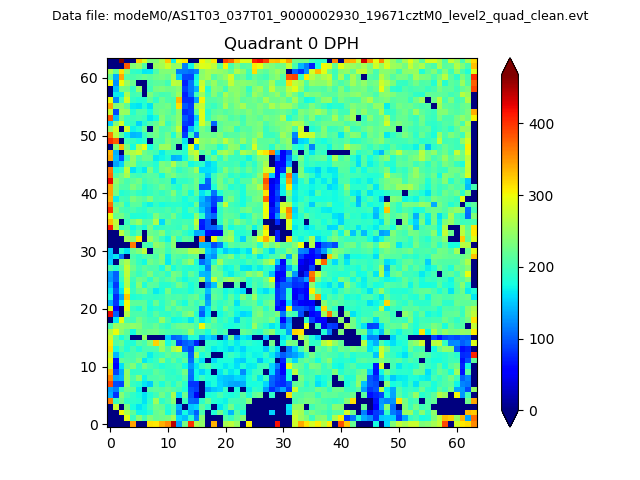 |
 |
Quadrant B |
|---|---|---|---|
| Quadrant D | 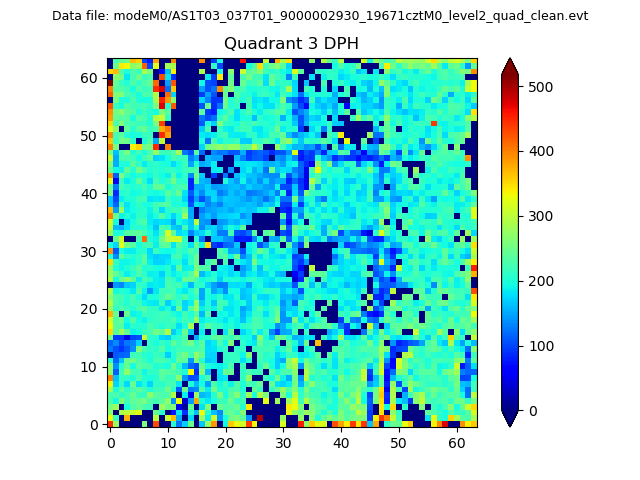 |
 |
Quadrant C |
| Plot type | Count rate plots | Images |
|---|---|---|
| Comparison with Poisson distribution Blue bars denote a histogram of data divided into 1 sec bins. Red curve is a Poisson curve with rate = median count rate of data. |
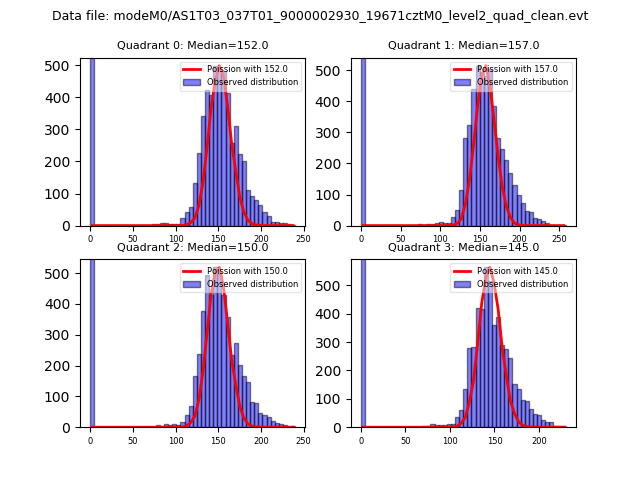 |
 |
| Quadrant-wise count rates Data is divided into 100 sec bins |
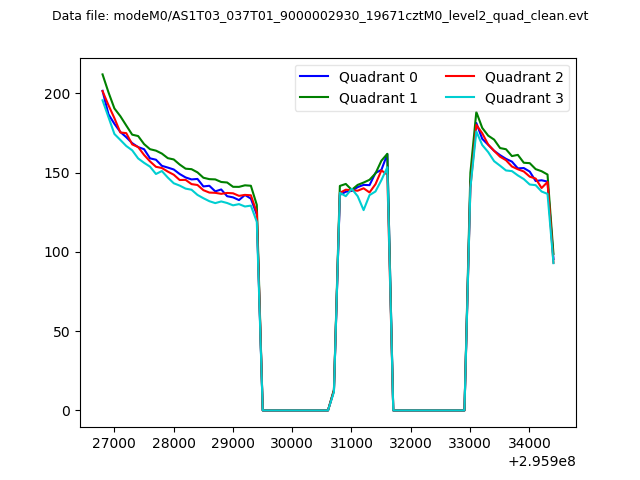 |
|
| Module-wise count rates for Quadrant A Data is divided into 100 sec bins |
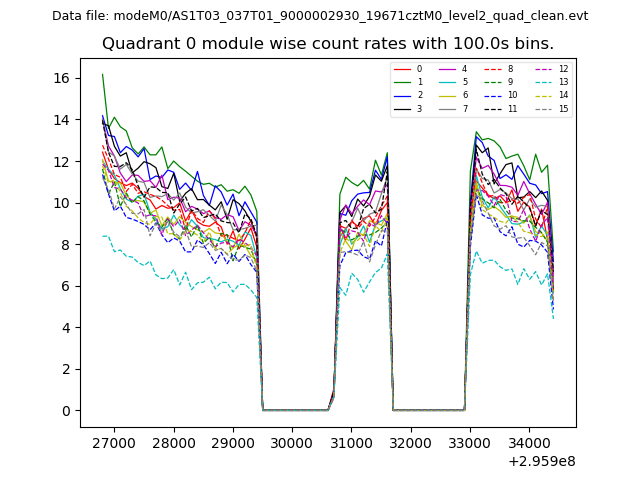 |
 |
| Module-wise count rates for Quadrant B Data is divided into 100 sec bins |
 |
 |
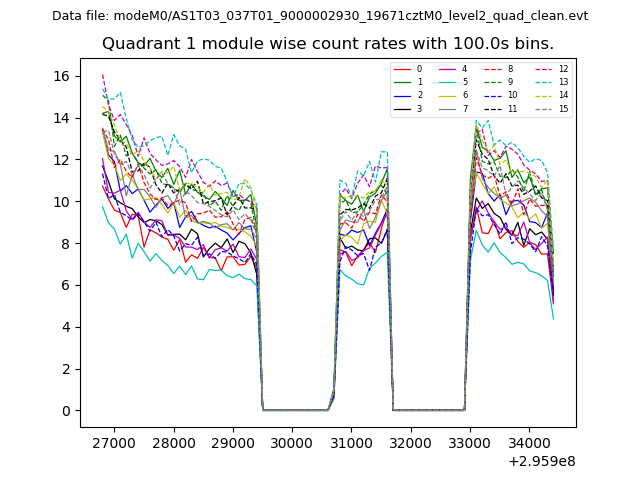
| Module-wise count rates for Quadrant C Data is divided into 100 sec bins |
 |
 |
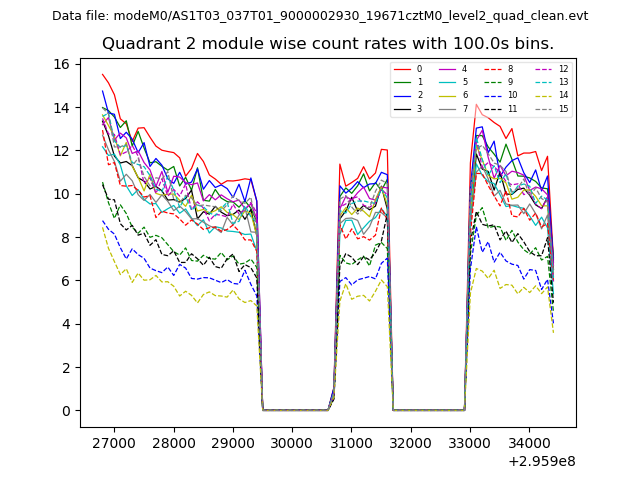
| Module-wise count rates for Quadrant D Data is divided into 100 sec bins |
 |
 |
| Parameter | Plot |
|---|---|
| CZT HV Monitor | 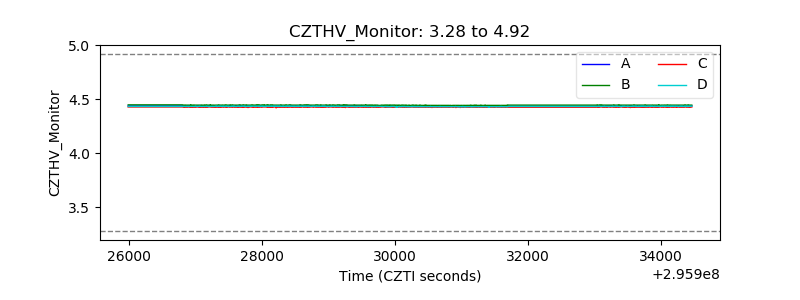 |
| D_VDD | 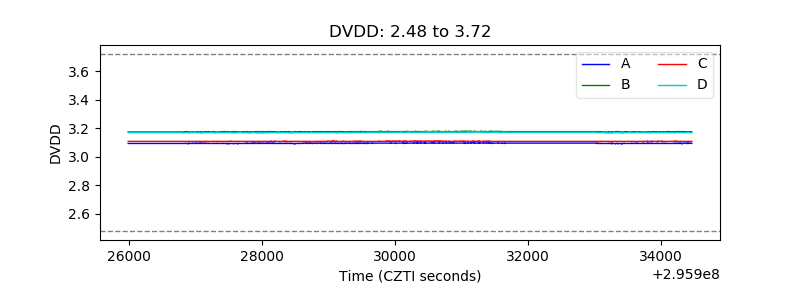 |
| Temperature 1 | 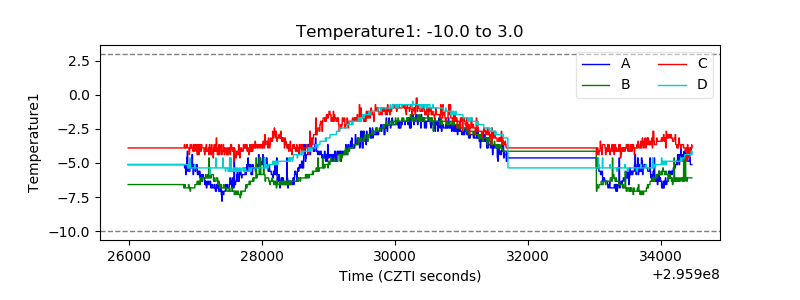 |
| Veto HV Monitor | 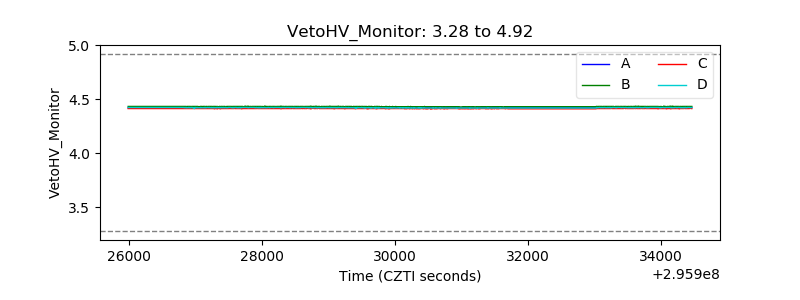 |
| Veto LLD | 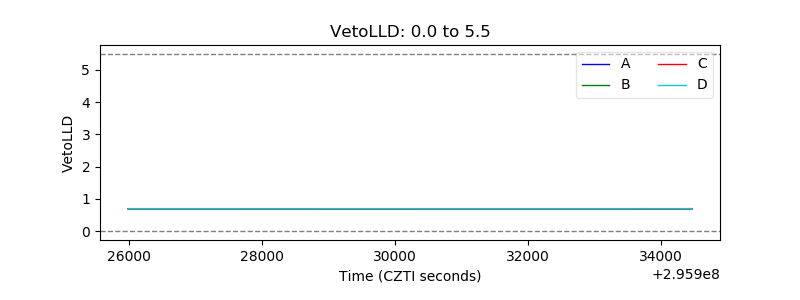 |
| Alpha Counter | 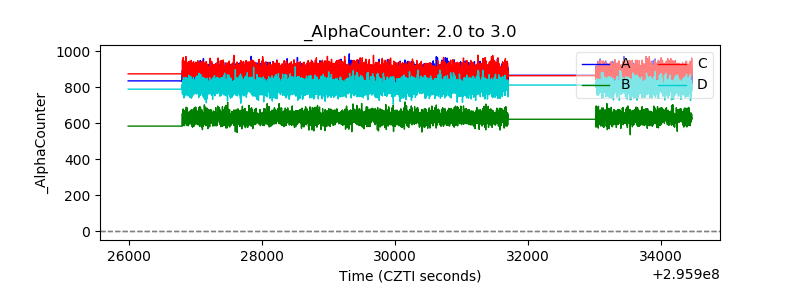 |
| _CPM_Rate | 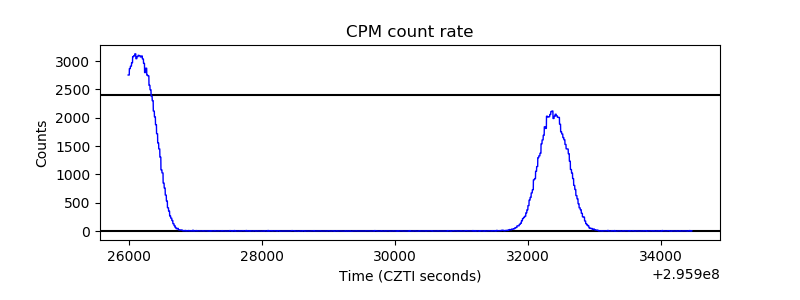 |
| CZT Counter | 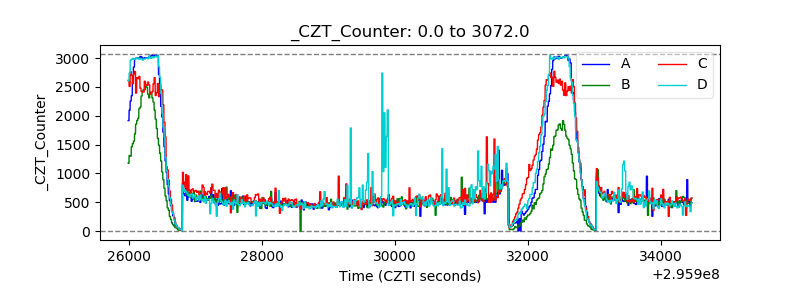 |
| +2.5 Volts monitor | 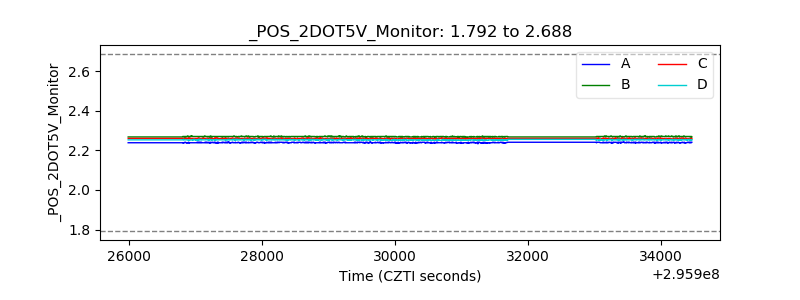 |
| +5 Volts monitor |  |
| _ROLL_ROT | 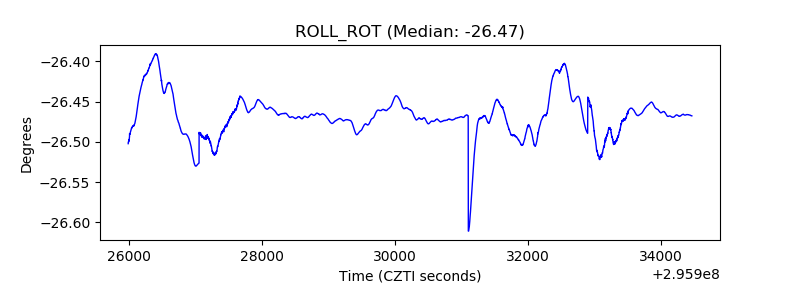 |
| _Roll_DEC | 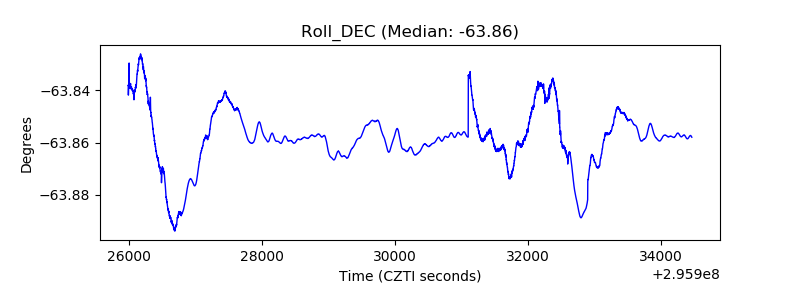 |
| _Roll_RA | 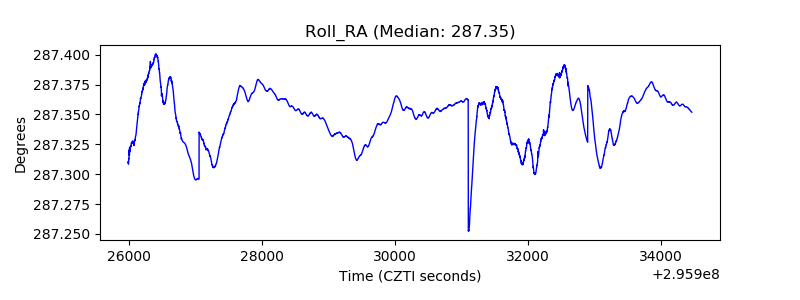 |
| Veto Counter | 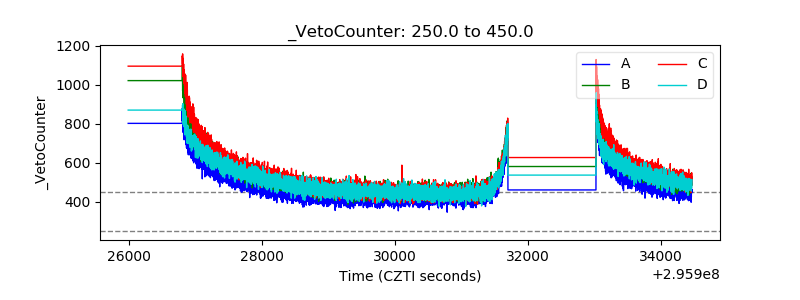 |