| Param | Original file | Final file |
|---|---|---|
| Filename | modeM0/AS1T03_037T01_9000002930_19672cztM0_level2.evt | modeM0/AS1T03_037T01_9000002930_19672cztM0_level2_quad_clean.evt |
| Size (bytes) | 455,486,400 | 110,243,520 |
| Size | 434.4 MB | 105.1 MB |
| Events in quadrant A | 3,206,422 | 729,121 |
| Events in quadrant B | 3,320,740 | 747,950 |
| Events in quadrant C | 3,374,171 | 721,236 |
| Events in quadrant D | 3,466,416 | 702,208 |
| Mode M0 | |||
|---|---|---|---|
| Quadrant | BADHDUFLAG | Total packets | Discarded packets |
| A | 0 | 13336 | 2 |
| B | 0 | 13585 | 2 |
| C | 0 | 13728 | 2 |
| D | 0 | 14368 | 2 |
| Mode M9 | |||
|---|---|---|---|
| Quadrant | BADHDUFLAG | Total packets | Discarded packets |
| A | 0 | 14 | 0 |
| B | 0 | 15 | 0 |
| C | 0 | 15 | 0 |
| D | 0 | 15 | 0 |
| Mode SS | |||
|---|---|---|---|
| Quadrant | BADHDUFLAG | Total packets | Discarded packets |
| A | 0 | 128 | 0 |
| B | 0 | 128 | 0 |
| C | 0 | 128 | 0 |
| D | 0 | 128 | 0 |
| Quadrant | Total seconds | Saturated seconds | Saturation percentage |
|---|---|---|---|
| A | 6279 | 35 | 0.557414% |
| B | 6279 | 63 | 1.003344% |
| C | 6279 | 99 | 1.576684% |
| D | 6279 | 49 | 0.780379% |
Noise dominated data is calculated using 1-second bins in cleaned event files. If a bin has >2000 counts, and if more than 50% of those come from <1% of pixels, then it is considered to be noise-dominated and hence unusable.
| Quadrant | # 1 sec bins | Bins with >0 counts | Bins with >2000 counts | High rate bins dominated by noise | Noise dominated (total time) | Noise dominated (detector-on time) | Marked lightcurve |
|---|---|---|---|---|---|---|---|
| A | 7549 | 6280 | 10 | 10 | 0.13% | 0.16% | 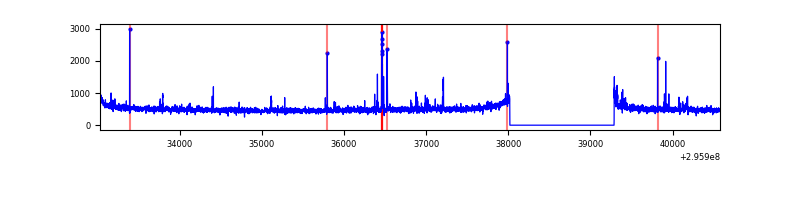 |
| B | 7549 | 6280 | 7 | 7 | 0.09% | 0.11% | 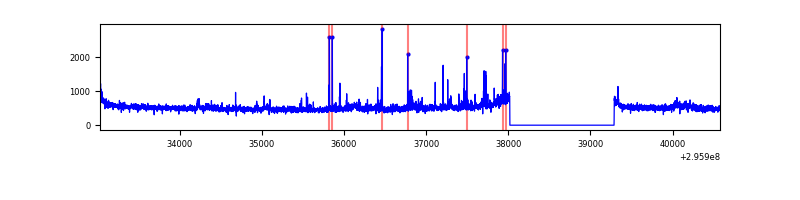 |
| C | 7549 | 6279 | 0 | 0 | 0.00% | 0.00% | 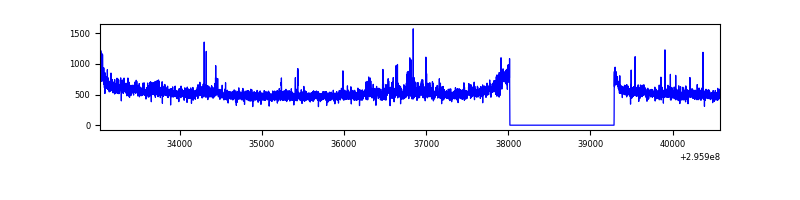 |
| D | 7549 | 6280 | 17 | 17 | 0.23% | 0.27% | 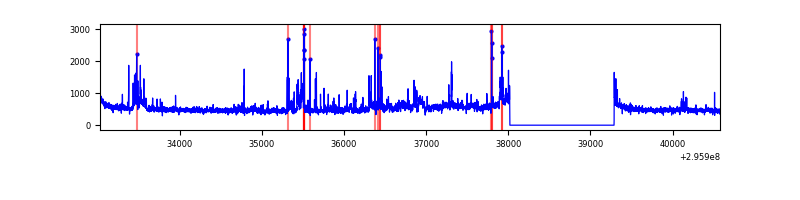 |
Top three noisy pixels from each quadrant. If the there are fewer than three noisy pixels in the level2.evt file, extra rows are filled as -1
| Pixel properties | Quadrant properties | ||||||
|---|---|---|---|---|---|---|---|
| Quadrant | DetID | PixID | Counts | Sigma | Mean | Median | Sigma |
| A | 5 | 16 | 103857 | 648.3 | 793 | 777 | 159.0 |
| A | 11 | 29 | 43513 | 268.78 | 793 | 777 | 159.0 |
| A | 13 | 252 | 6943 | 38.78 | 793 | 777 | 159.0 |
| B | 0 | 198 | 72226 | 480.6 | 795 | 775 | 148.7 |
| B | 3 | 112 | 41355 | 272.95 | 795 | 775 | 148.7 |
| B | 0 | 197 | 36705 | 241.68 | 795 | 775 | 148.7 |
| C | 14 | 238 | 124598 | 687.45 | 783 | 788 | 180.1 |
| C | 9 | 221 | 105425 | 580.99 | 783 | 788 | 180.1 |
| C | 3 | 233 | 85778 | 471.9 | 783 | 788 | 180.1 |
| D | 12 | 218 | 263830 | 1396.34 | 788 | 765 | 188.4 |
| D | 1 | 20 | 134618 | 710.48 | 788 | 765 | 188.4 |
| D | 1 | 52 | 91531 | 481.78 | 788 | 765 | 188.4 |
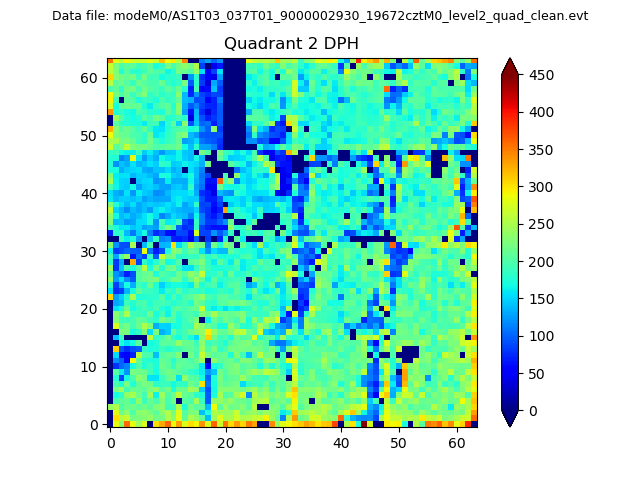
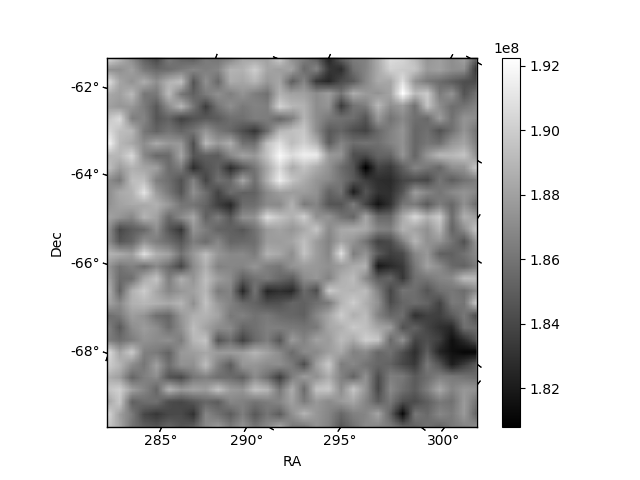
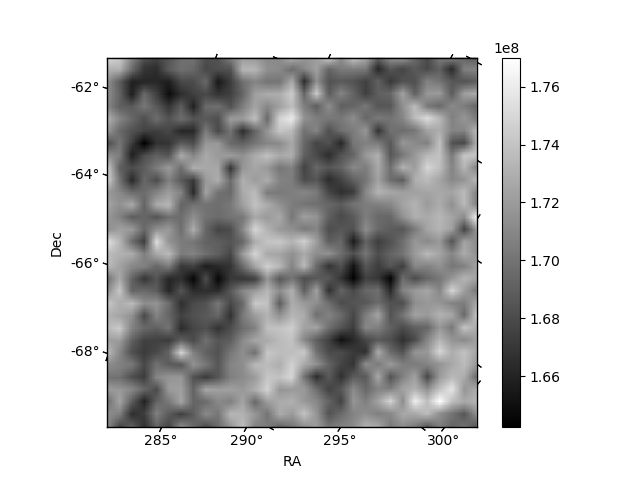
Histogram calculated using DETX and DETY for each event in the final _common_clean file
| Quadrant A | 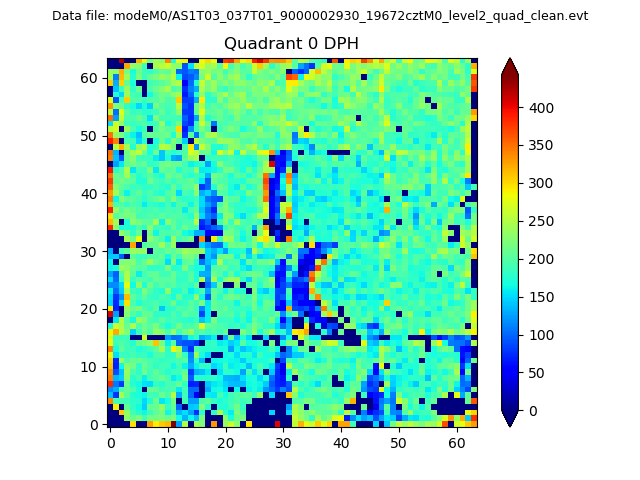 |
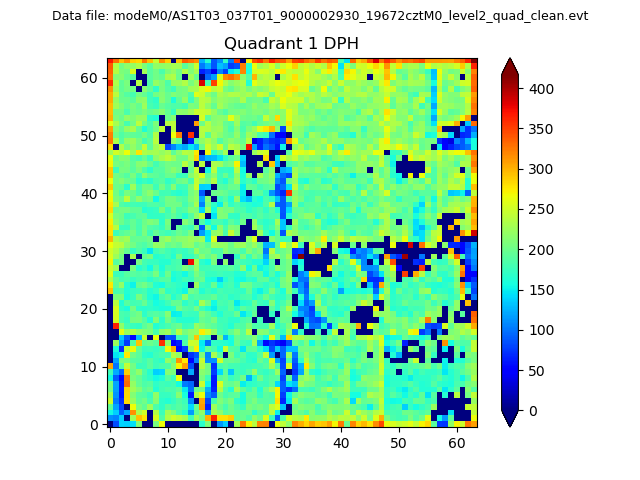 |
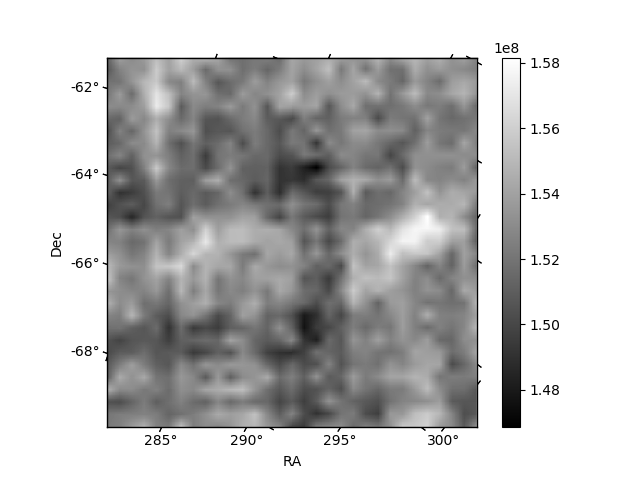
Quadrant B |
|---|---|---|---|
| Quadrant D | 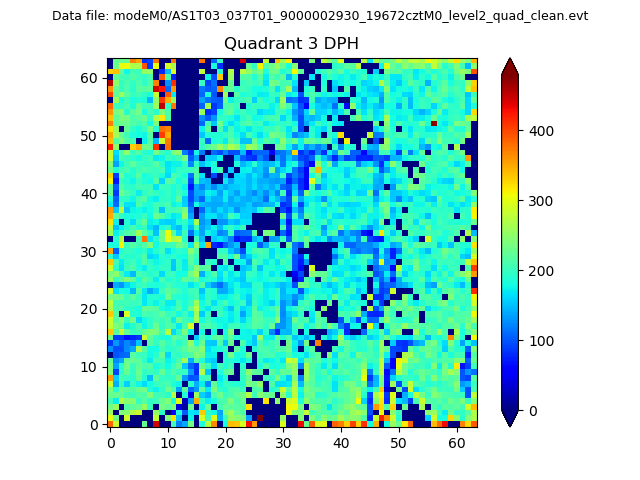 |
 |
Quadrant C |
| Plot type | Count rate plots | Images |
|---|---|---|
| Comparison with Poisson distribution Blue bars denote a histogram of data divided into 1 sec bins. Red curve is a Poisson curve with rate = median count rate of data. |
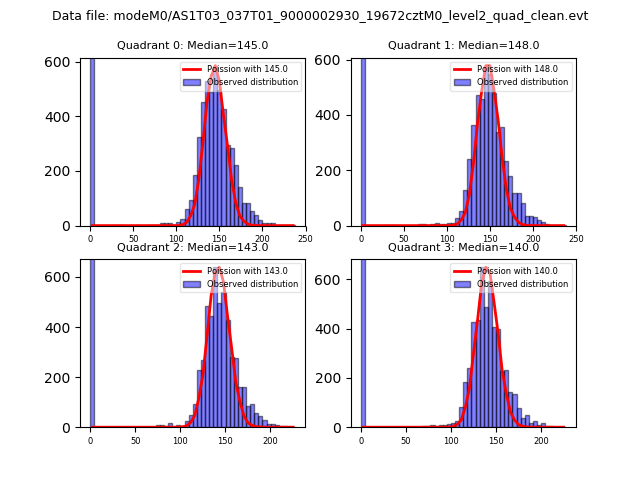 |
 |
| Quadrant-wise count rates Data is divided into 100 sec bins |
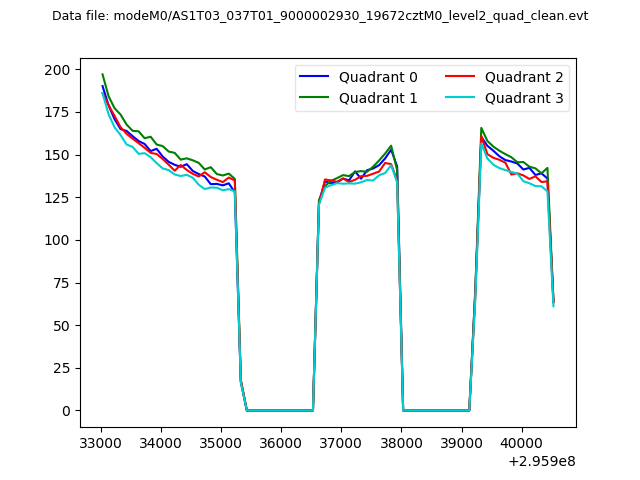 |
|
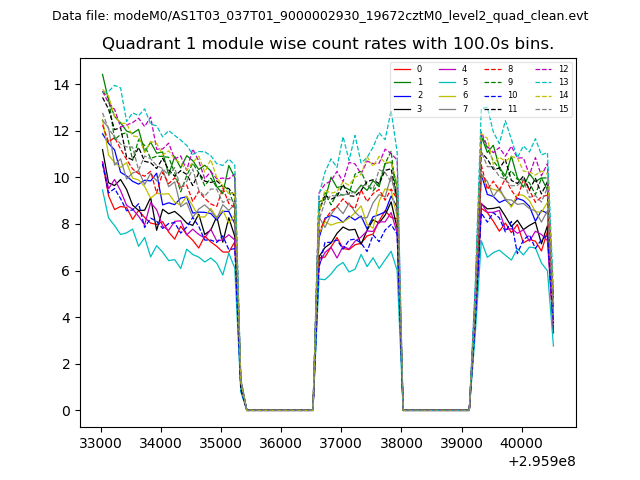
| Module-wise count rates for Quadrant A Data is divided into 100 sec bins |
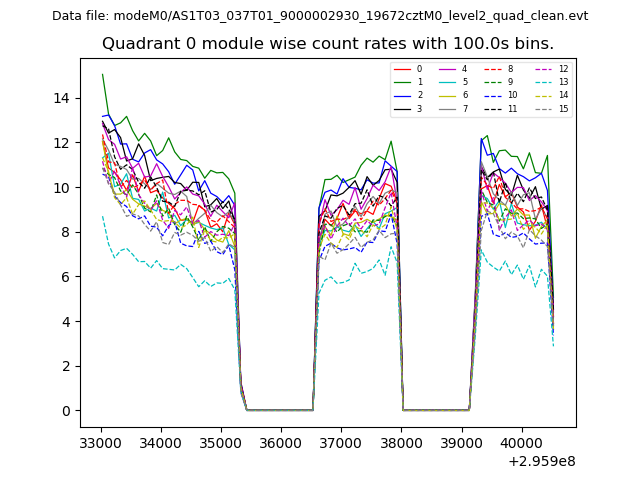 |
 |
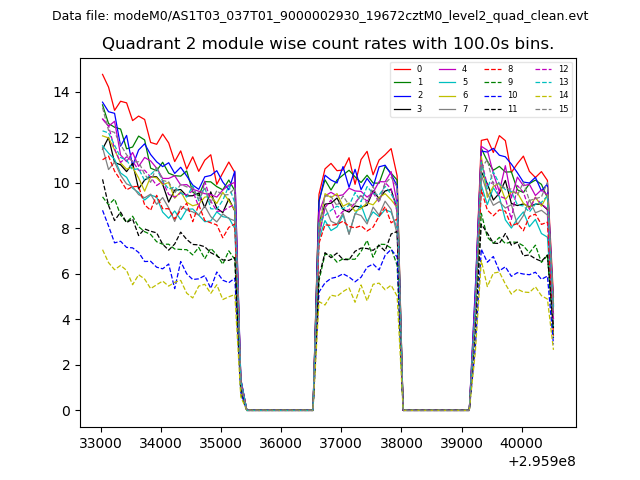
| Module-wise count rates for Quadrant B Data is divided into 100 sec bins |
 |
 |
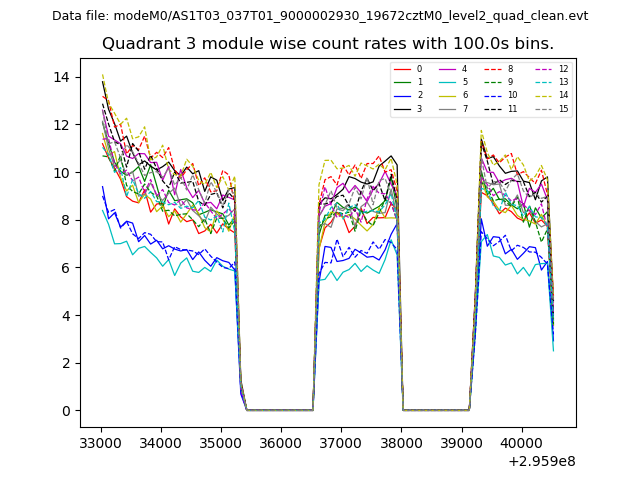
| Module-wise count rates for Quadrant C Data is divided into 100 sec bins |
 |
 |
| Module-wise count rates for Quadrant D Data is divided into 100 sec bins |
 |
 |
| Parameter | Plot |
|---|---|
| CZT HV Monitor | 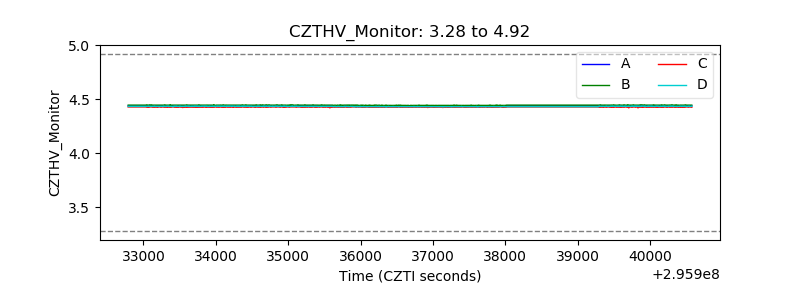 |
| D_VDD |  |
| Temperature 1 | 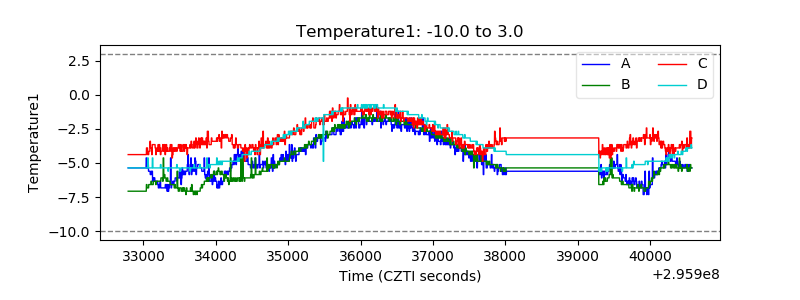 |
| Veto HV Monitor |  |
| Veto LLD | 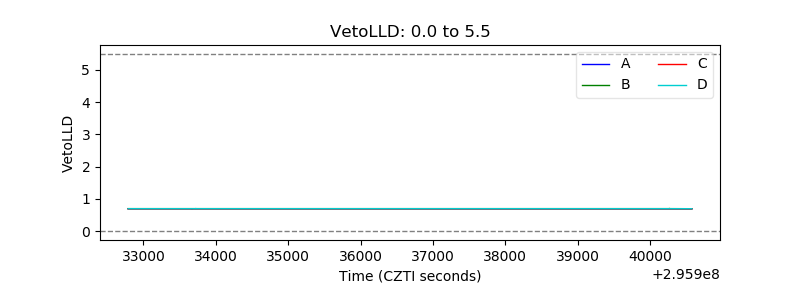 |
| Alpha Counter | 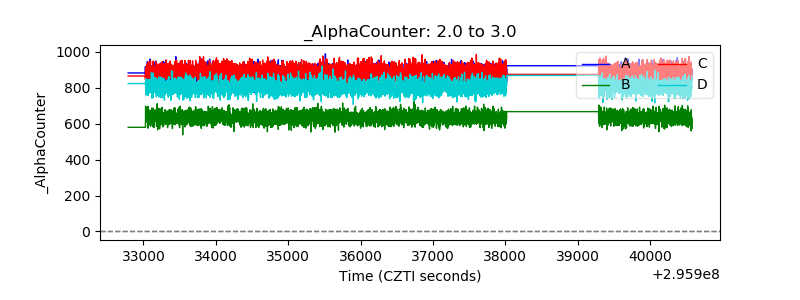 |
| _CPM_Rate | 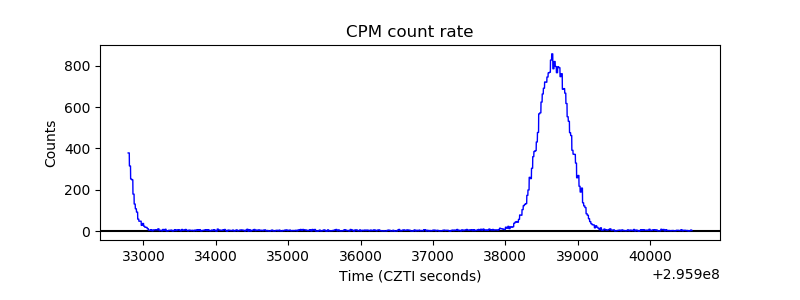 |
| CZT Counter | 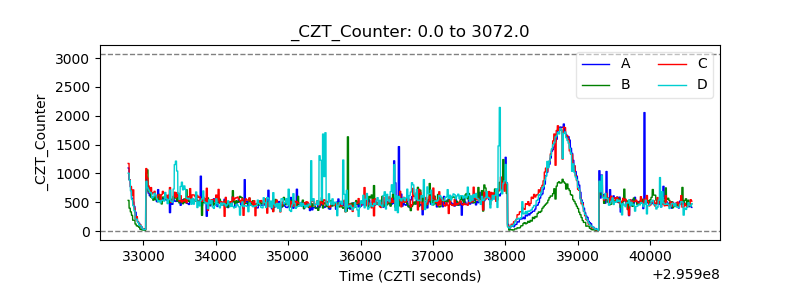 |
| +2.5 Volts monitor |  |
| +5 Volts monitor |  |
| _ROLL_ROT | 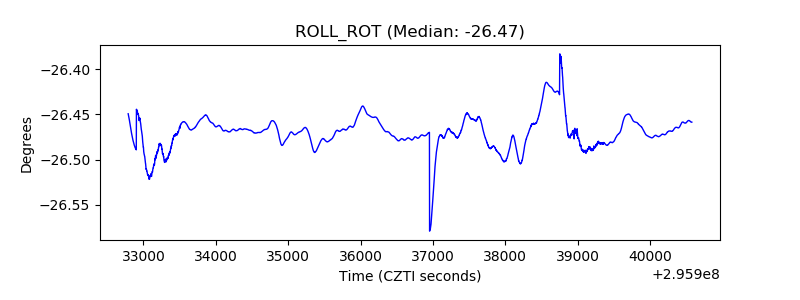 |
| _Roll_DEC | 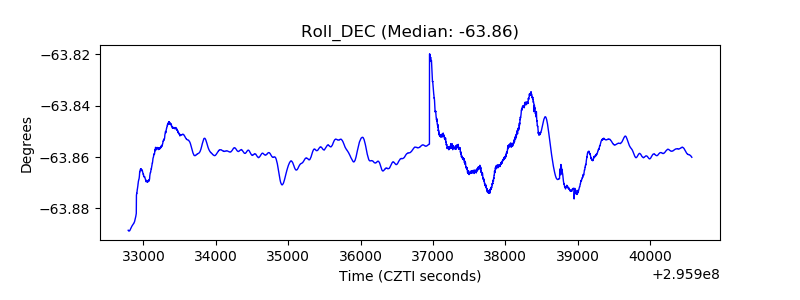 |
| _Roll_RA |  |
| Veto Counter | 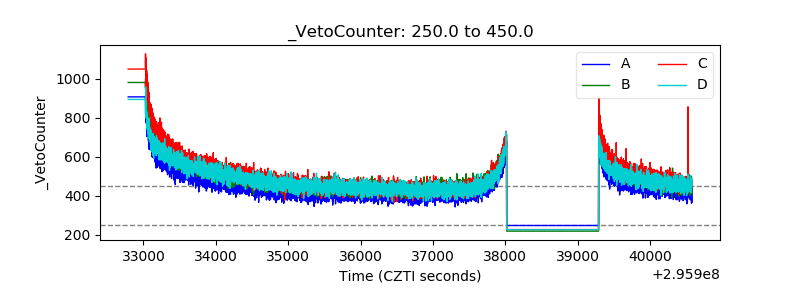 |