| Param | Original file | Final file |
|---|---|---|
| Filename | modeM0/AS1T03_037T01_9000002930_19674cztM0_level2.evt | modeM0/AS1T03_037T01_9000002930_19674cztM0_level2_quad_clean.evt |
| Size (bytes) | 494,772,480 | 105,986,880 |
| Size | 471.9 MB | 101.1 MB |
| Events in quadrant A | 3,365,940 | 690,311 |
| Events in quadrant B | 4,015,303 | 694,054 |
| Events in quadrant C | 3,463,604 | 675,729 |
| Events in quadrant D | 3,662,109 | 660,501 |
| Mode M0 | |||
|---|---|---|---|
| Quadrant | BADHDUFLAG | Total packets | Discarded packets |
| A | 0 | 14647 | 2 |
| B | 0 | 16551 | 2 |
| C | 0 | 14578 | 2 |
| D | 0 | 15647 | 2 |
| Mode M9 | |||
|---|---|---|---|
| Quadrant | BADHDUFLAG | Total packets | Discarded packets |
| A | 0 | 4 | 0 |
| B | 0 | 4 | 0 |
| C | 0 | 4 | 0 |
| D | 0 | 4 | 0 |
| Mode SS | |||
|---|---|---|---|
| Quadrant | BADHDUFLAG | Total packets | Discarded packets |
| A | 0 | 144 | 0 |
| B | 0 | 144 | 0 |
| C | 0 | 144 | 0 |
| D | 0 | 144 | 0 |
| Quadrant | Total seconds | Saturated seconds | Saturation percentage |
|---|---|---|---|
| A | 7015 | 147 | 2.095510% |
| B | 7015 | 312 | 4.447612% |
| C | 7015 | 177 | 2.523165% |
| D | 7015 | 199 | 2.836778% |
Noise dominated data is calculated using 1-second bins in cleaned event files. If a bin has >2000 counts, and if more than 50% of those come from <1% of pixels, then it is considered to be noise-dominated and hence unusable.
| Quadrant | # 1 sec bins | Bins with >0 counts | Bins with >2000 counts | High rate bins dominated by noise | Noise dominated (total time) | Noise dominated (detector-on time) | Marked lightcurve |
|---|---|---|---|---|---|---|---|
| A | 7485 | 7016 | 4 | 4 | 0.05% | 0.06% | 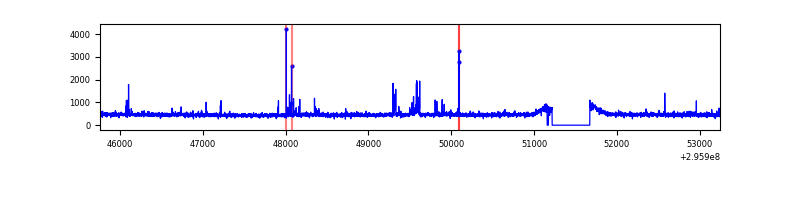 |
| B | 7485 | 7015 | 119 | 119 | 1.59% | 1.70% | 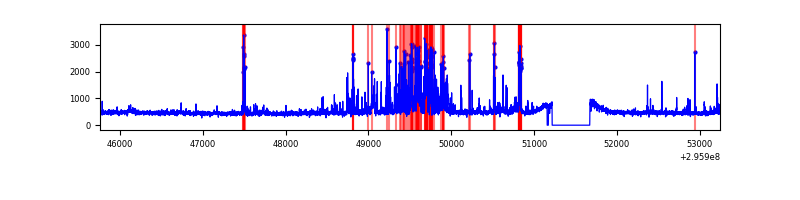 |
| C | 7485 | 7015 | 0 | 0 | 0.00% | 0.00% | 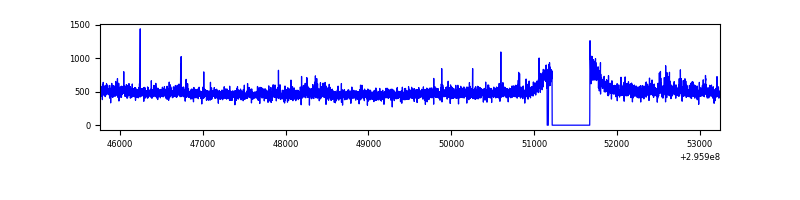 |
| D | 7485 | 7016 | 86 | 86 | 1.15% | 1.23% | 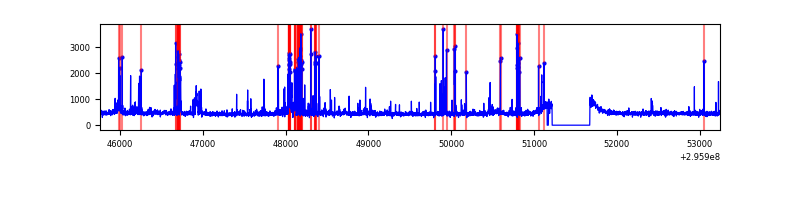 |
Top three noisy pixels from each quadrant. If the there are fewer than three noisy pixels in the level2.evt file, extra rows are filled as -1
| Pixel properties | Quadrant properties | ||||||
|---|---|---|---|---|---|---|---|
| Quadrant | DetID | PixID | Counts | Sigma | Mean | Median | Sigma |
| A | 5 | 16 | 113070 | 670.75 | 833 | 814 | 167.4 |
| A | 11 | 29 | 41680 | 244.18 | 833 | 814 | 167.4 |
| A | 0 | 226 | 7204 | 38.18 | 833 | 814 | 167.4 |
| B | 3 | 112 | 695817 | 4449.45 | 824 | 801 | 156.2 |
| B | 7 | 220 | 42482 | 266.84 | 824 | 801 | 156.2 |
| B | 12 | 111 | 18667 | 114.38 | 824 | 801 | 156.2 |
| C | 14 | 238 | 126835 | 665.82 | 810 | 813 | 189.3 |
| C | 3 | 233 | 112939 | 592.4 | 810 | 813 | 189.3 |
| C | 9 | 221 | 56942 | 296.55 | 810 | 813 | 189.3 |
| D | 1 | 52 | 313777 | 1590.22 | 819 | 795 | 196.8 |
| D | 7 | 38 | 92998 | 468.47 | 819 | 795 | 196.8 |
| D | 12 | 218 | 83607 | 420.76 | 819 | 795 | 196.8 |
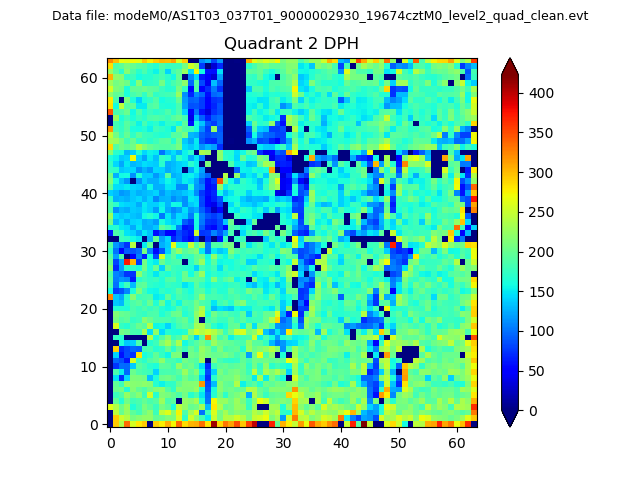
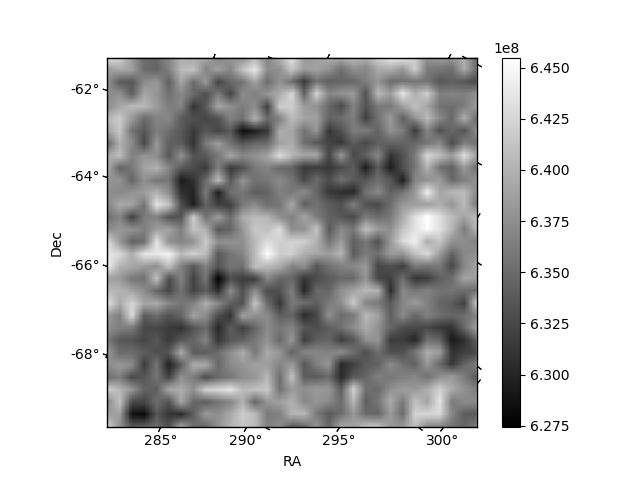
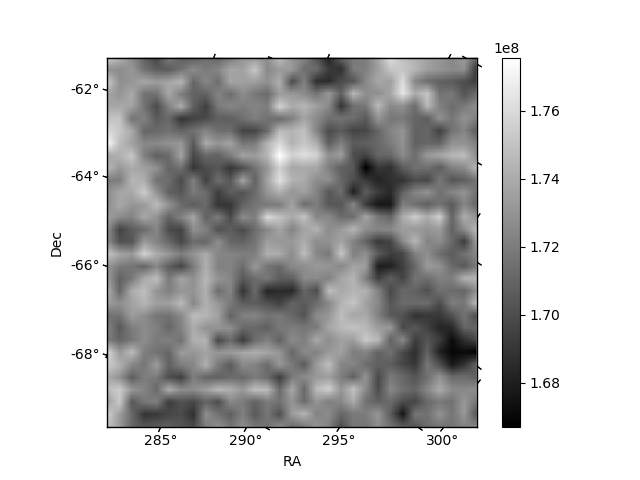
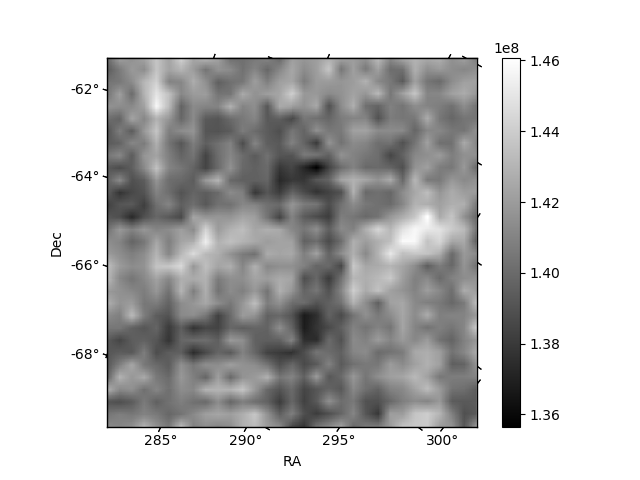
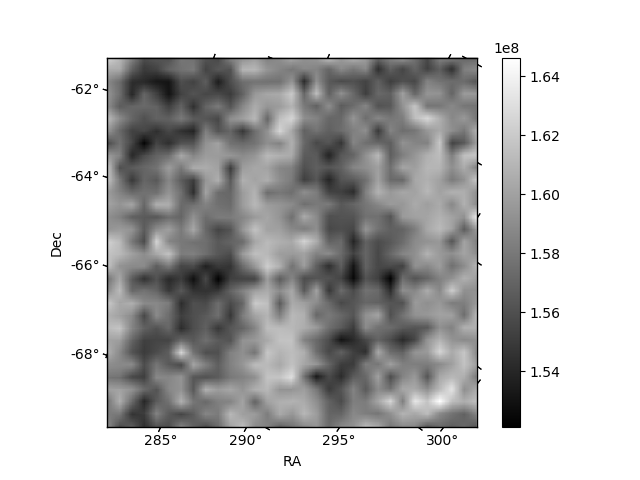
Histogram calculated using DETX and DETY for each event in the final _common_clean file
| Quadrant A | 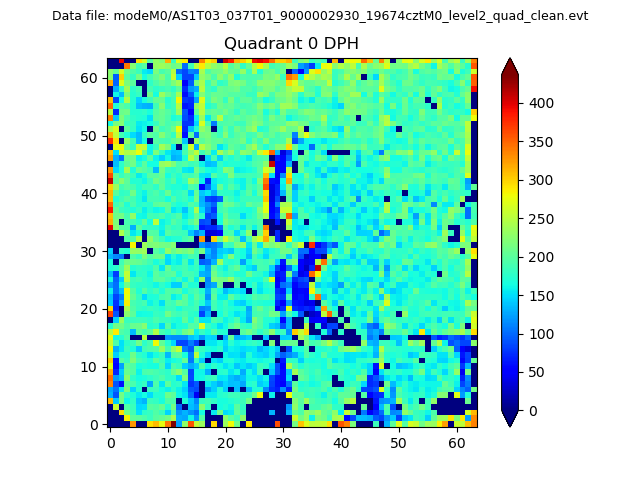 |
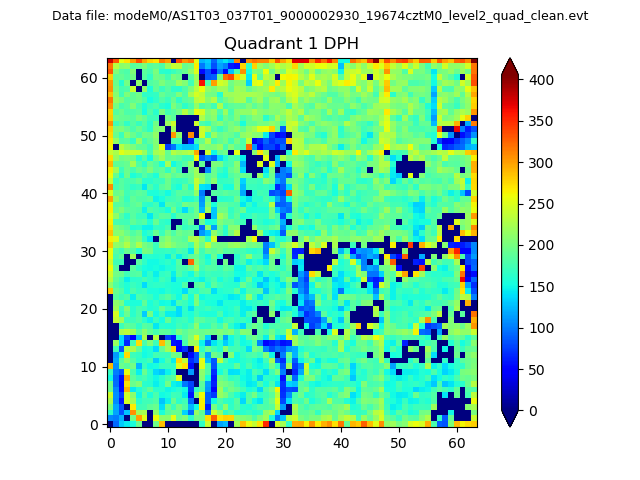 |
Quadrant B |
|---|---|---|---|
| Quadrant D | 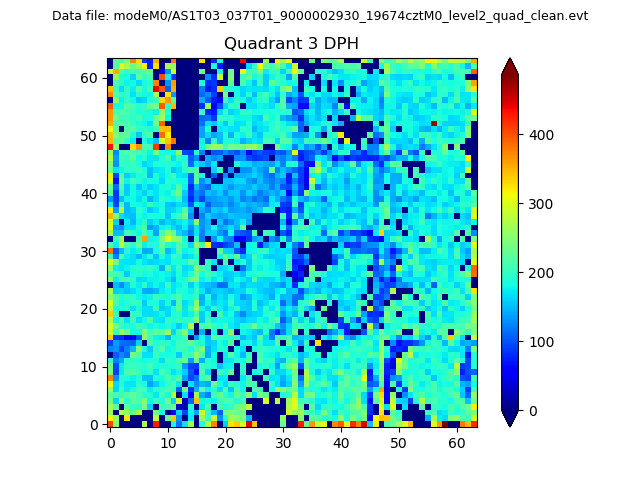 |
 |
Quadrant C |
| Plot type | Count rate plots | Images |
|---|---|---|
| Comparison with Poisson distribution Blue bars denote a histogram of data divided into 1 sec bins. Red curve is a Poisson curve with rate = median count rate of data. |
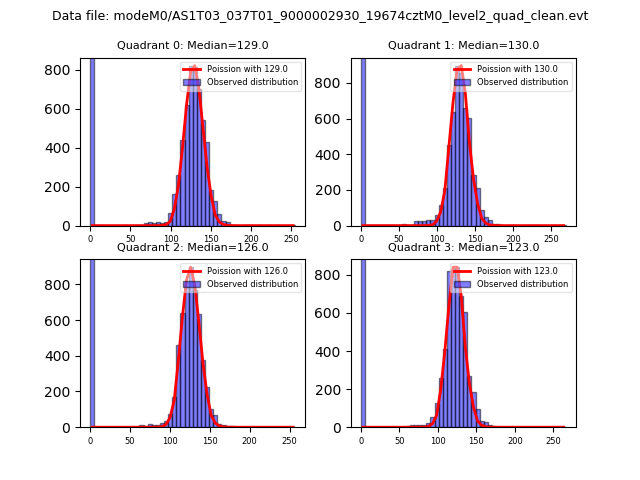 |
 |
| Quadrant-wise count rates Data is divided into 100 sec bins |
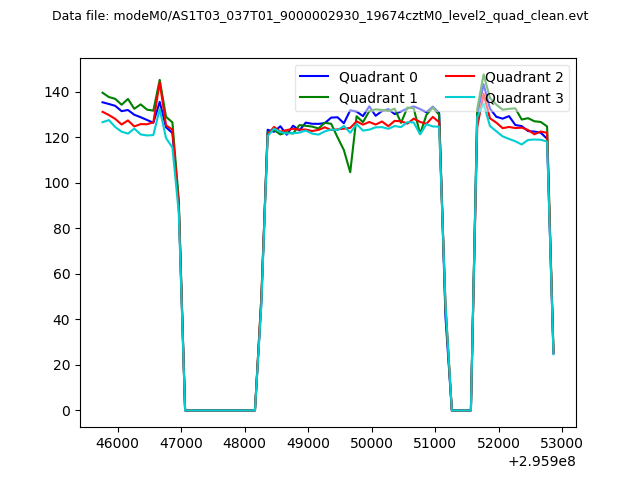 |
|
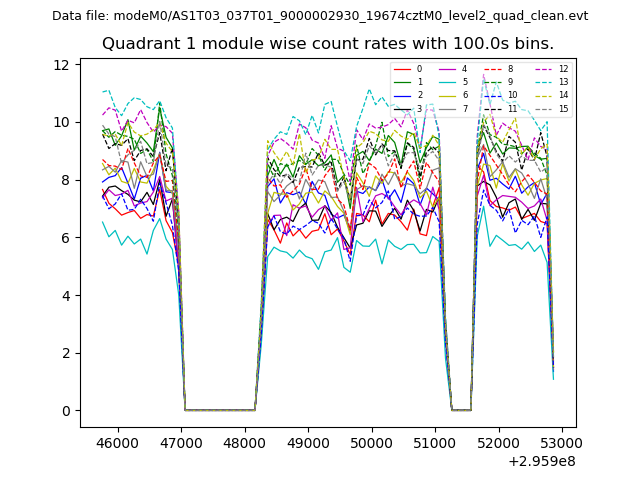
| Module-wise count rates for Quadrant A Data is divided into 100 sec bins |
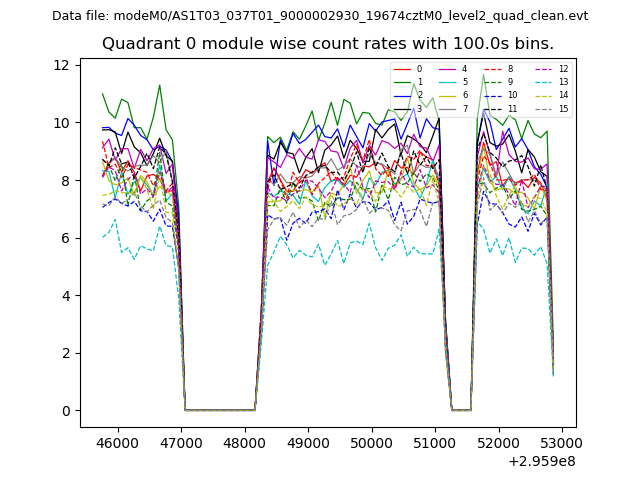 |
 |
| Module-wise count rates for Quadrant B Data is divided into 100 sec bins |
 |
 |
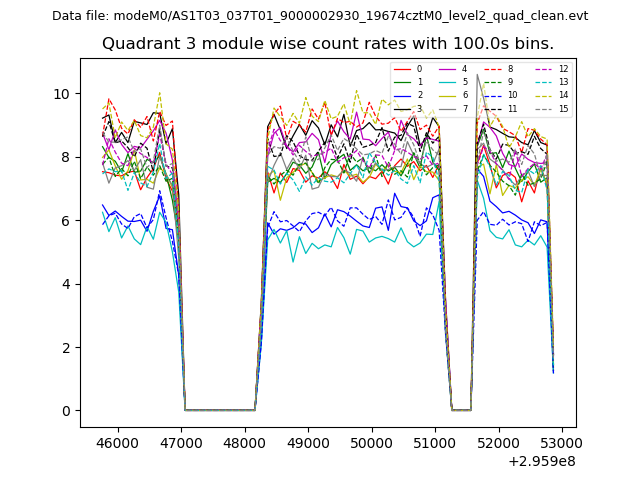
| Module-wise count rates for Quadrant C Data is divided into 100 sec bins |
 |
 |
| Module-wise count rates for Quadrant D Data is divided into 100 sec bins |
 |
 |
| Parameter | Plot |
|---|---|
| CZT HV Monitor | 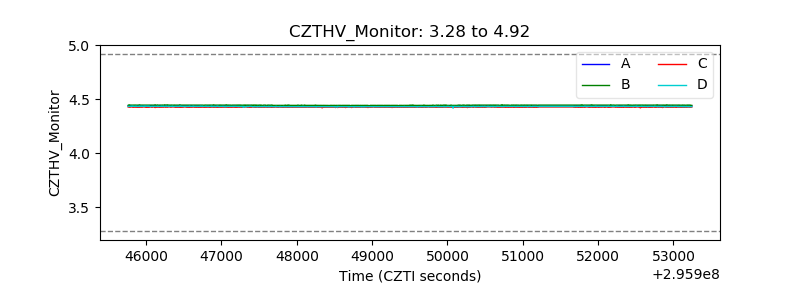 |
| D_VDD | 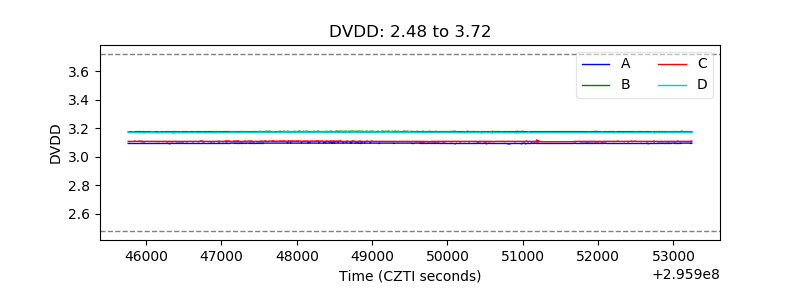 |
| Temperature 1 | 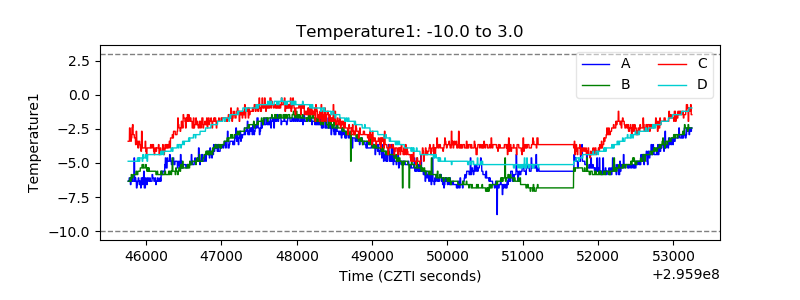 |
| Veto HV Monitor | 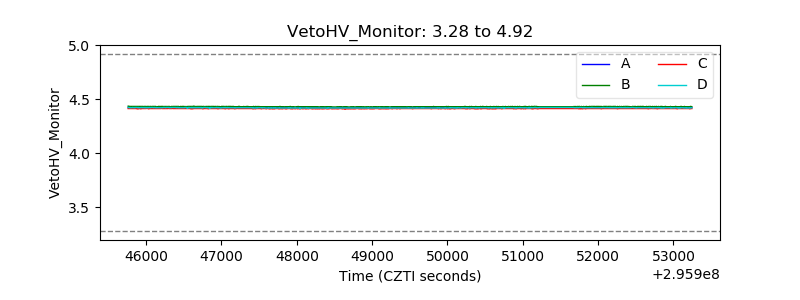 |
| Veto LLD | 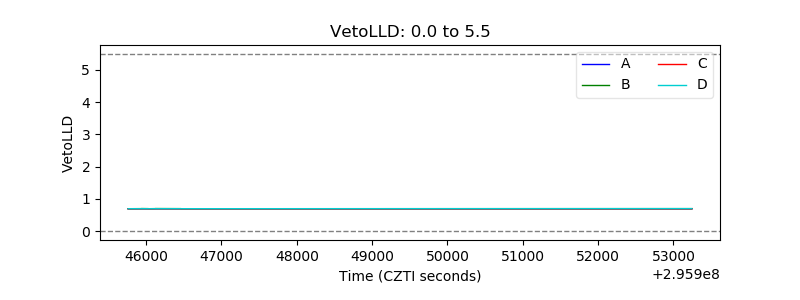 |
| Alpha Counter | 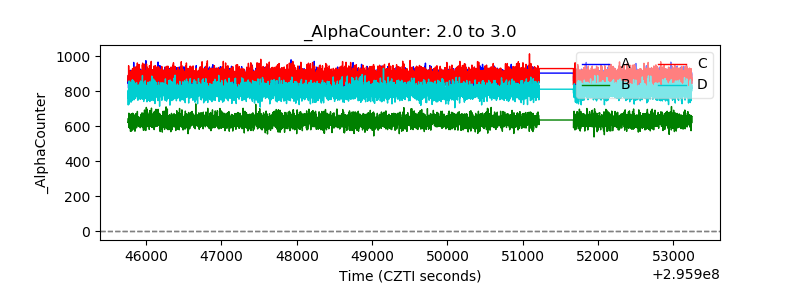 |
| _CPM_Rate | 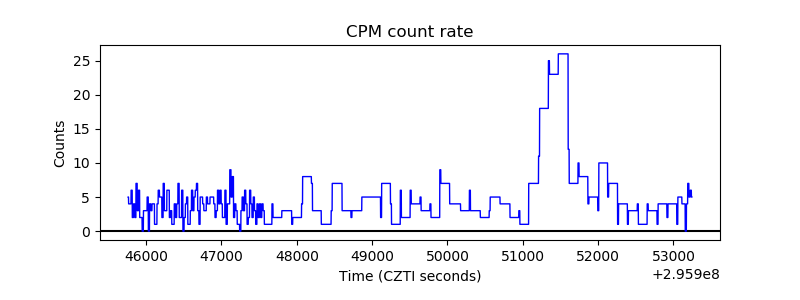 |
| CZT Counter | 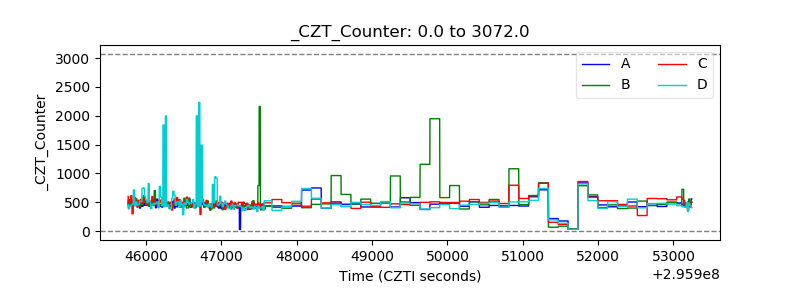 |
| +2.5 Volts monitor | 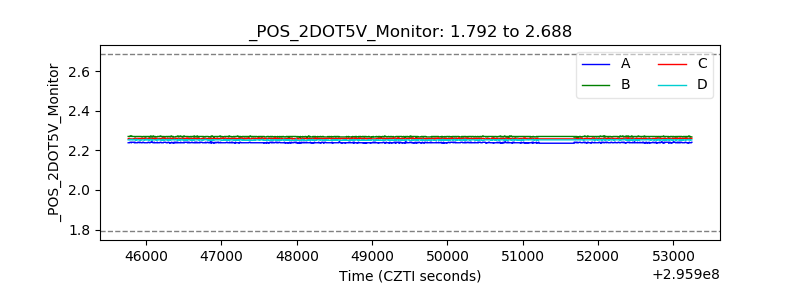 |
| +5 Volts monitor |  |
| _ROLL_ROT | 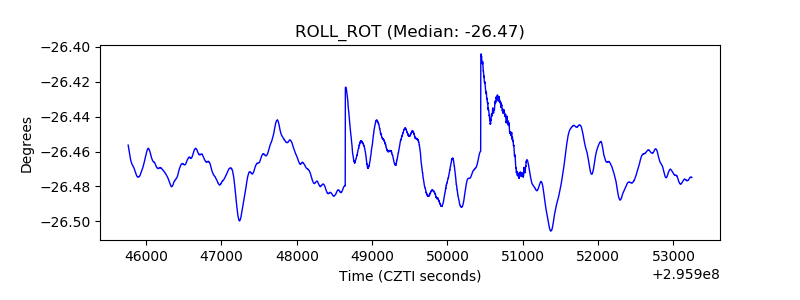 |
| _Roll_DEC |  |
| _Roll_RA | 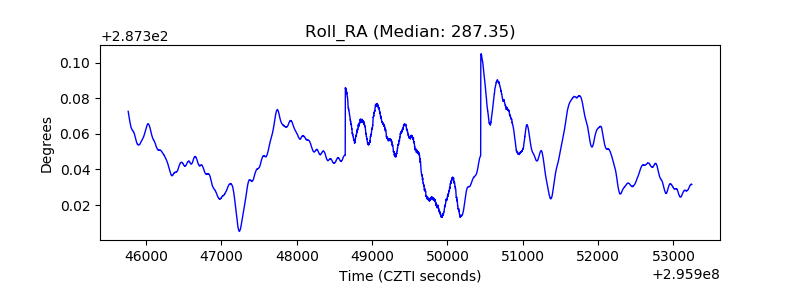 |
| Veto Counter |  |