| Param | Original file | Final file |
|---|---|---|
| Filename | modeM0/AS1T03_037T01_9000002930_19675cztM0_level2.evt | modeM0/AS1T03_037T01_9000002930_19675cztM0_level2_quad_clean.evt |
| Size (bytes) | 226,627,200 | 39,709,440 |
| Size | 216.1 MB | 37.9 MB |
| Events in quadrant A | 1,439,812 | 245,197 |
| Events in quadrant B | 1,867,673 | 244,683 |
| Events in quadrant C | 1,578,074 | 240,978 |
| Events in quadrant D | 1,752,125 | 237,257 |
| Mode M0 | |||
|---|---|---|---|
| Quadrant | BADHDUFLAG | Total packets | Discarded packets |
| A | 0 | 6609 | 0 |
| B | 0 | 7768 | 0 |
| C | 0 | 6723 | 0 |
| D | 0 | 7448 | 0 |
| Mode SS | |||
|---|---|---|---|
| Quadrant | BADHDUFLAG | Total packets | Discarded packets |
| A | 0 | 66 | 0 |
| B | 0 | 66 | 0 |
| C | 0 | 66 | 0 |
| D | 0 | 66 | 0 |
| Quadrant | Total seconds | Saturated seconds | Saturation percentage |
|---|---|---|---|
| A | 3292 | 3 | 0.091130% |
| B | 3293 | 72 | 2.186456% |
| C | 3293 | 10 | 0.303674% |
| D | 3293 | 35 | 1.062861% |
Noise dominated data is calculated using 1-second bins in cleaned event files. If a bin has >2000 counts, and if more than 50% of those come from <1% of pixels, then it is considered to be noise-dominated and hence unusable.
| Quadrant | # 1 sec bins | Bins with >0 counts | Bins with >2000 counts | High rate bins dominated by noise | Noise dominated (total time) | Noise dominated (detector-on time) | Marked lightcurve |
|---|---|---|---|---|---|---|---|
| A | 3292 | 3292 | 0 | 0 | 0.00% | 0.00% | 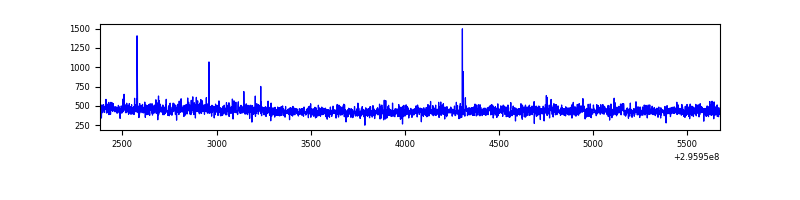 |
| B | 3293 | 3293 | 51 | 51 | 1.55% | 1.55% | 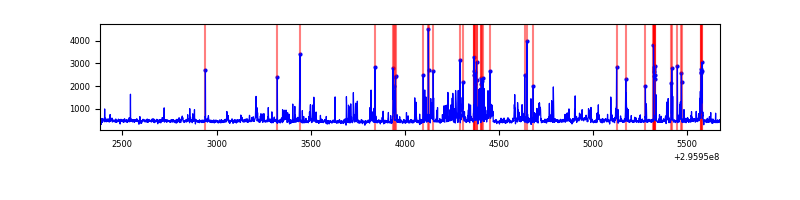 |
| C | 3293 | 3293 | 0 | 0 | 0.00% | 0.00% | 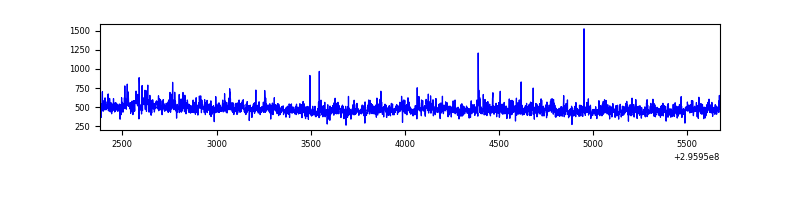 |
| D | 3293 | 3293 | 34 | 34 | 1.03% | 1.03% | 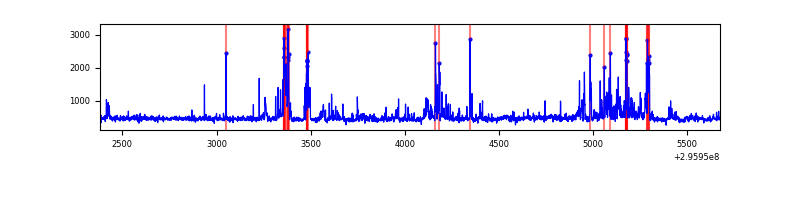 |
Top three noisy pixels from each quadrant. If the there are fewer than three noisy pixels in the level2.evt file, extra rows are filled as -1
| Pixel properties | Quadrant properties | ||||||
|---|---|---|---|---|---|---|---|
| Quadrant | DetID | PixID | Counts | Sigma | Mean | Median | Sigma |
| A | 11 | 29 | 15531 | 201.51 | 367 | 360 | 75.3 |
| A | 5 | 16 | 8209 | 104.26 | 367 | 360 | 75.3 |
| A | 0 | 226 | 3164 | 37.25 | 367 | 360 | 75.3 |
| B | 3 | 112 | 385598 | 5552.54 | 361 | 351 | 69.4 |
| B | 7 | 220 | 29368 | 418.22 | 361 | 351 | 69.4 |
| B | 6 | 36 | 10710 | 149.3 | 361 | 351 | 69.4 |
| C | 3 | 233 | 100691 | 1206.06 | 351 | 352 | 83.2 |
| C | 14 | 238 | 55133 | 658.46 | 351 | 352 | 83.2 |
| C | 9 | 221 | 49397 | 589.51 | 351 | 352 | 83.2 |
| D | 9 | 1 | 166261 | 1887.38 | 358 | 346 | 87.9 |
| D | 12 | 218 | 110767 | 1256.11 | 358 | 346 | 87.9 |
| D | 1 | 52 | 56922 | 643.59 | 358 | 346 | 87.9 |
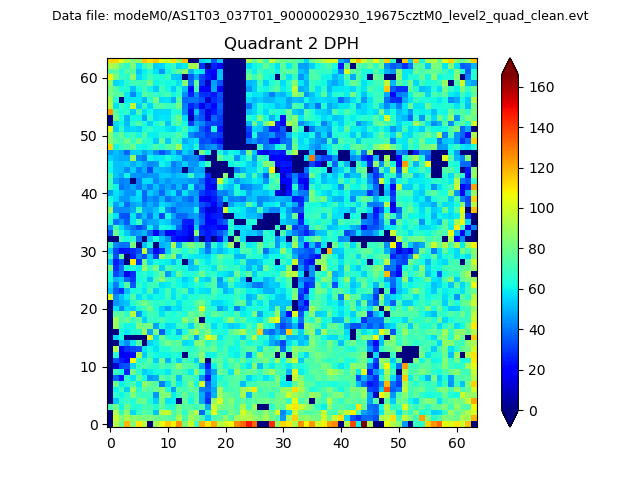
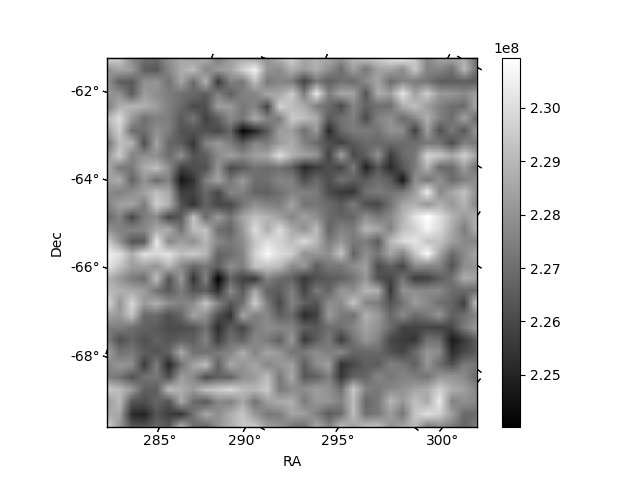
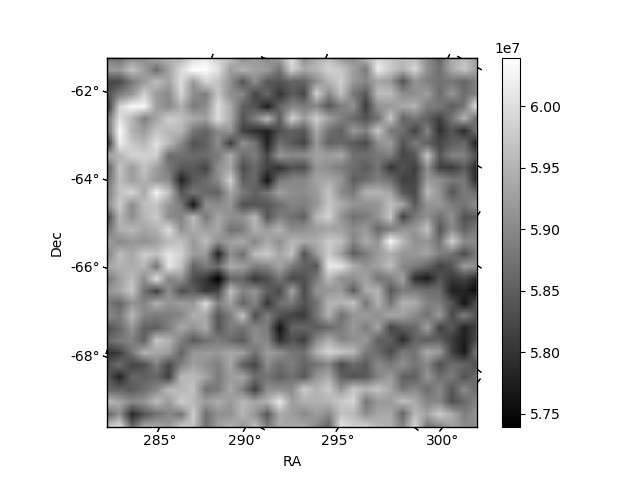
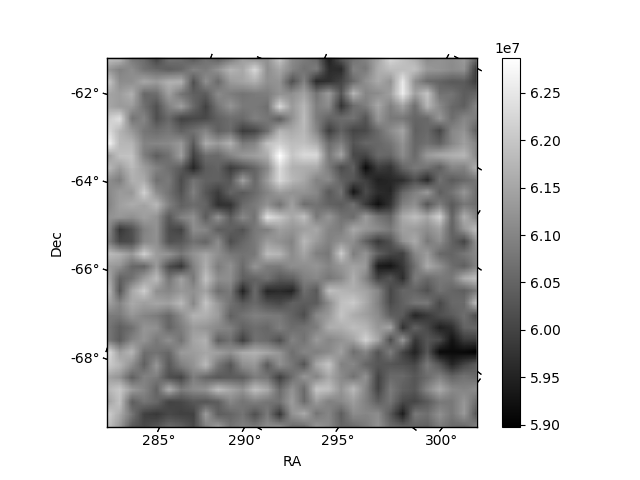
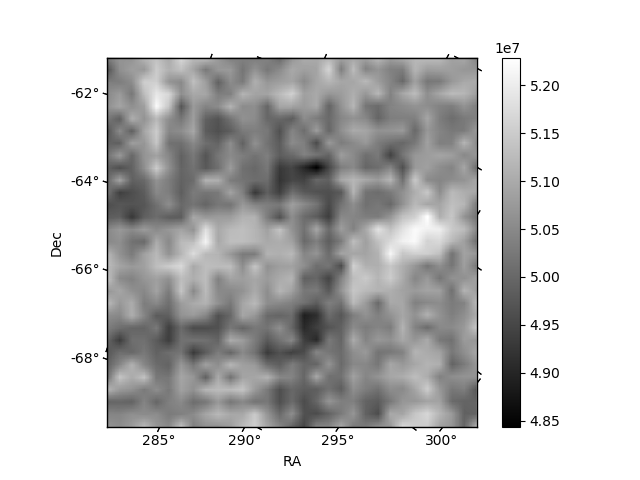
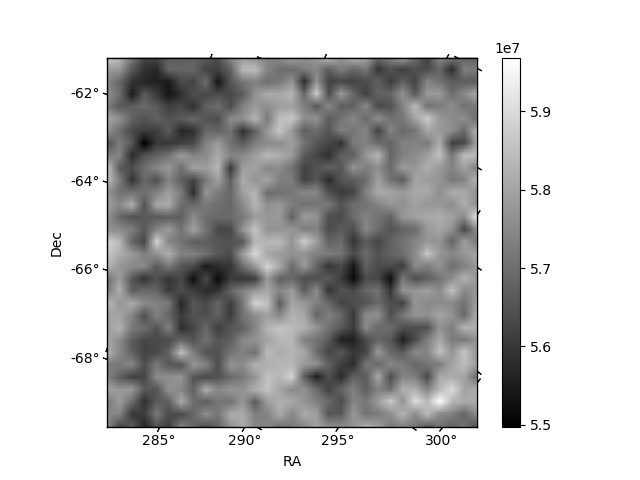
Histogram calculated using DETX and DETY for each event in the final _common_clean file
| Quadrant A | 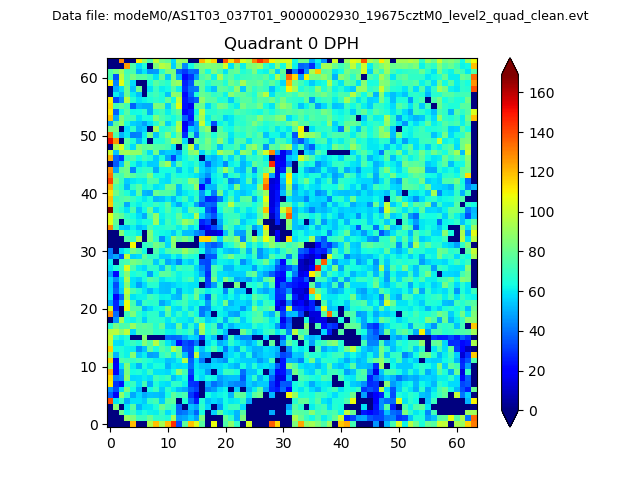 |
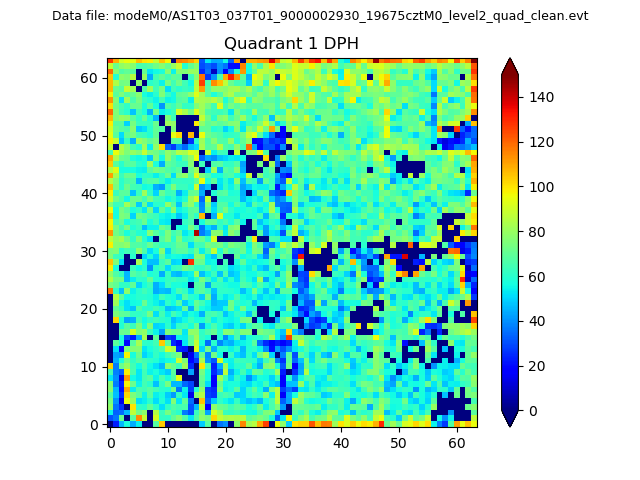 |
Quadrant B |
|---|---|---|---|
| Quadrant D | 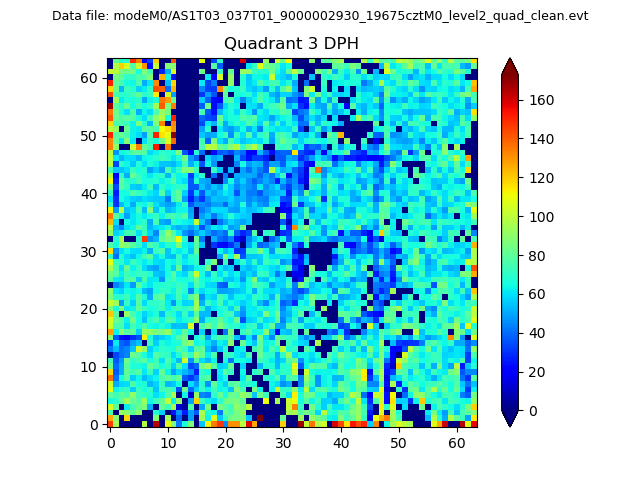 |
 |
Quadrant C |
| Plot type | Count rate plots | Images |
|---|---|---|
| Comparison with Poisson distribution Blue bars denote a histogram of data divided into 1 sec bins. Red curve is a Poisson curve with rate = median count rate of data. |
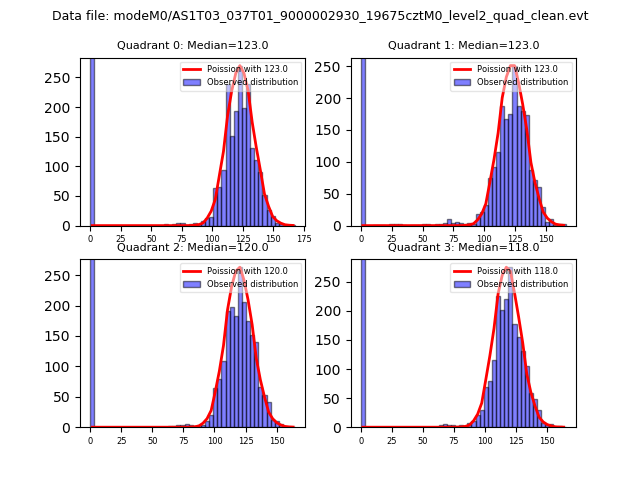 |
 |
| Quadrant-wise count rates Data is divided into 100 sec bins |
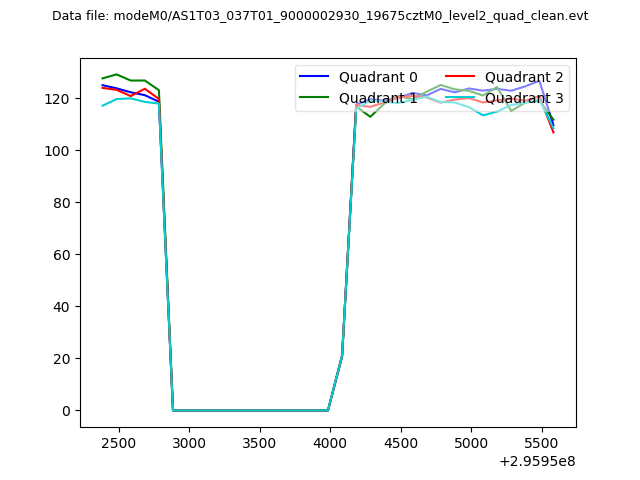 |
|
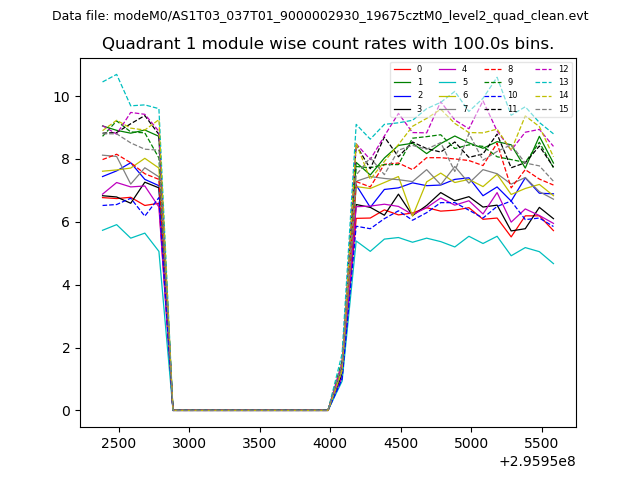
| Module-wise count rates for Quadrant A Data is divided into 100 sec bins |
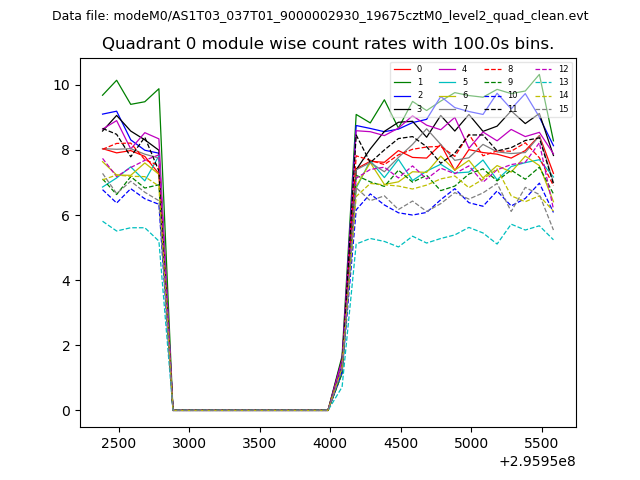 |
 |
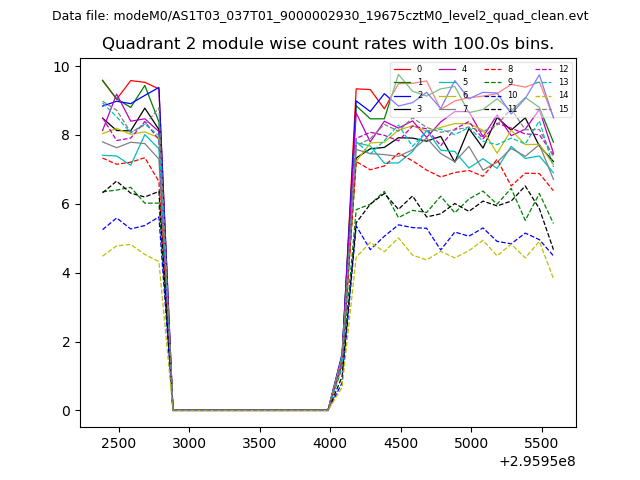
| Module-wise count rates for Quadrant B Data is divided into 100 sec bins |
 |
 |
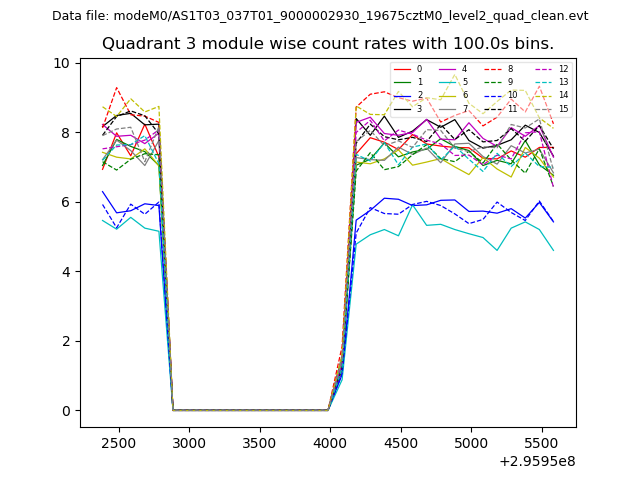
| Module-wise count rates for Quadrant C Data is divided into 100 sec bins |
 |
 |
| Module-wise count rates for Quadrant D Data is divided into 100 sec bins |
 |
 |
| Parameter | Plot |
|---|---|
| CZT HV Monitor | 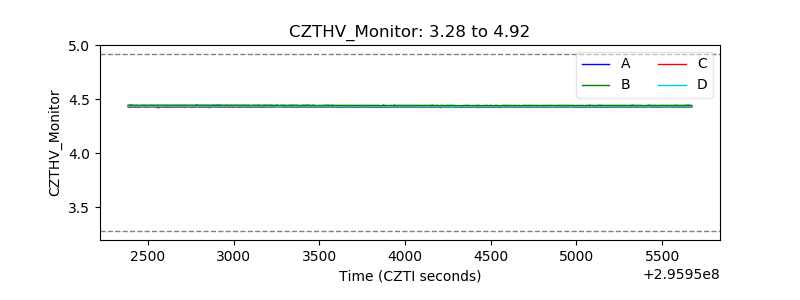 |
| D_VDD | 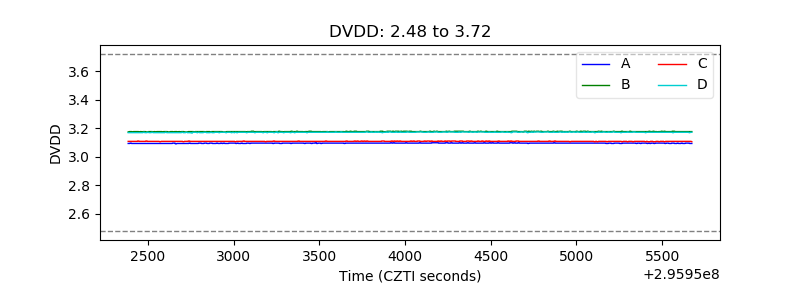 |
| Temperature 1 | 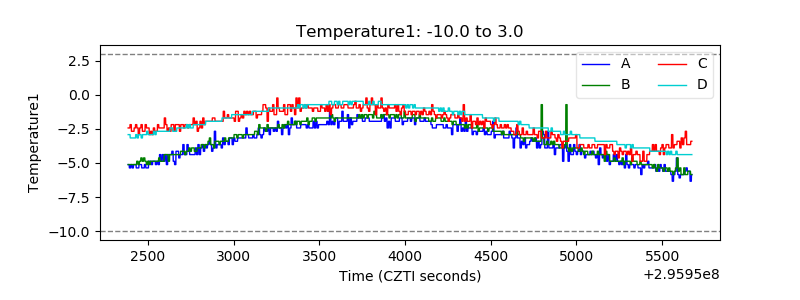 |
| Veto HV Monitor | 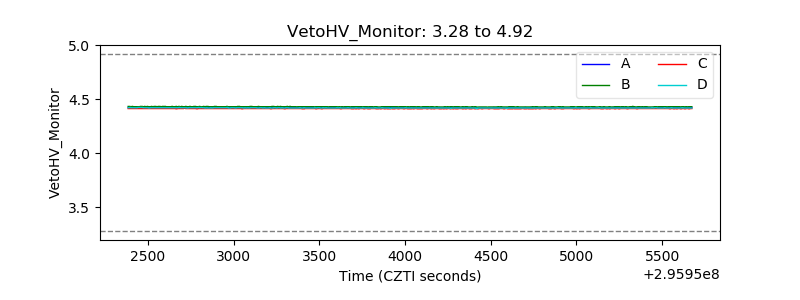 |
| Veto LLD | 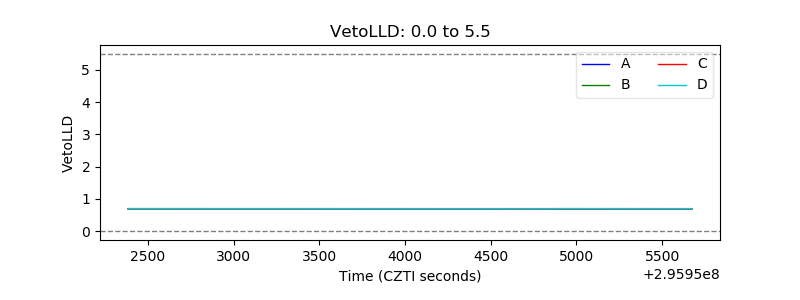 |
| Alpha Counter | 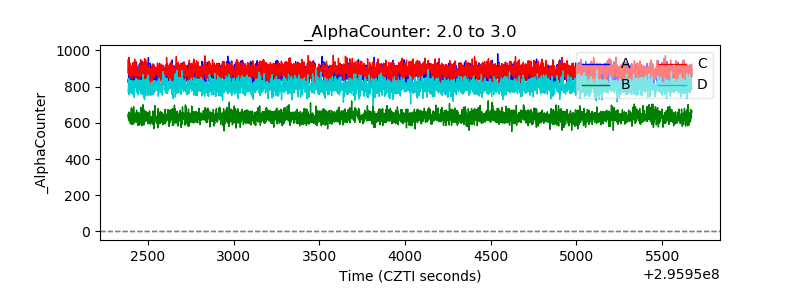 |
| _CPM_Rate | 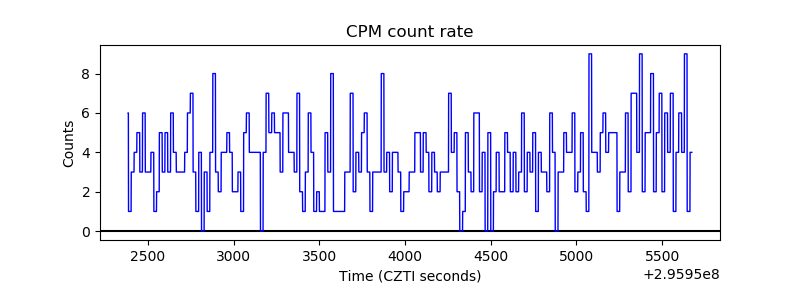 |
| CZT Counter | 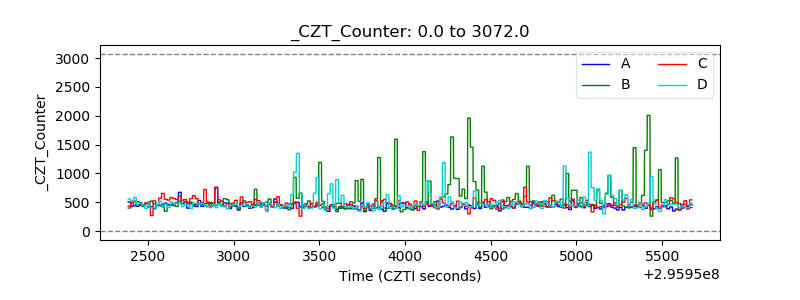 |
| +2.5 Volts monitor |  |
| +5 Volts monitor | 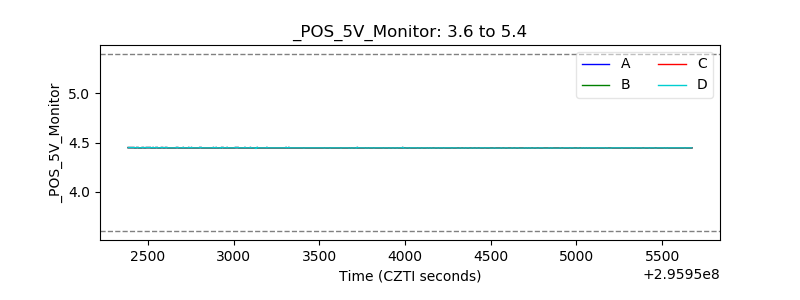 |
| _ROLL_ROT | 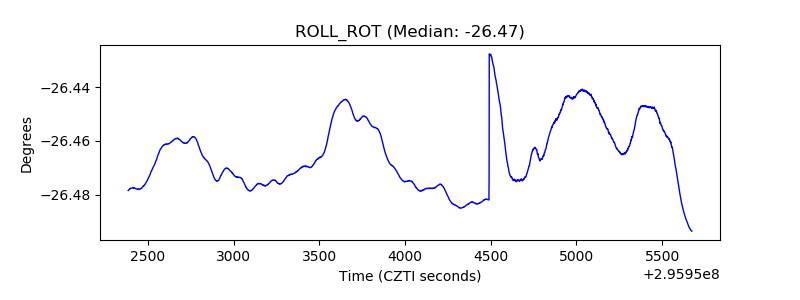 |
| _Roll_DEC | 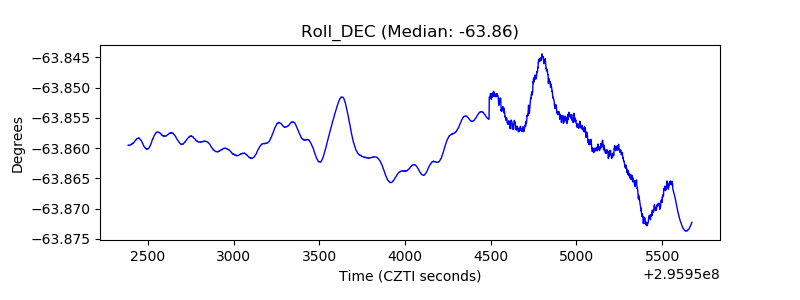 |
| _Roll_RA | 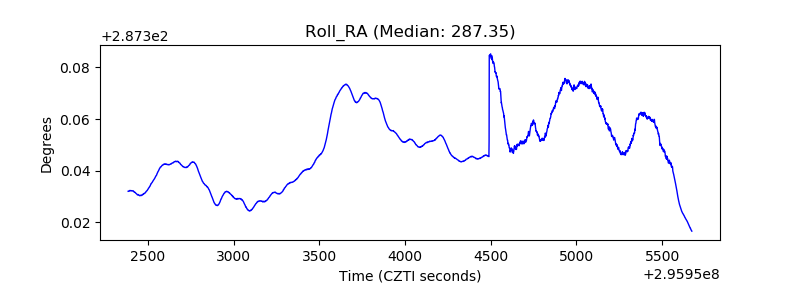 |
| Veto Counter | 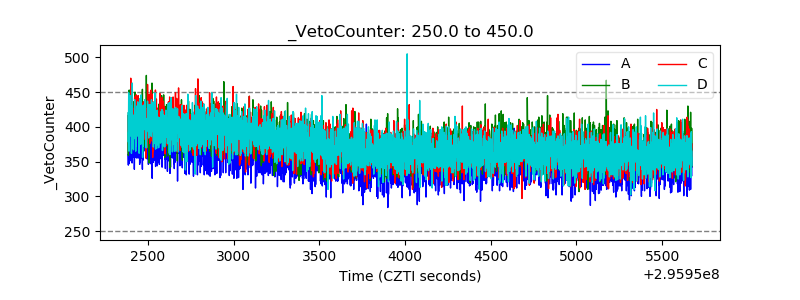 |