| Param | Original file | Final file |
|---|---|---|
| Filename | modeM0/AS1A05_013T01_9000002944cztM0_level2.fits | modeM0/AS1A05_013T01_9000002944cztM0_level2_quad_clean.evt |
| Size (bytes) | 1,968,405,120 | 1,645,110,720 |
| Size | 1.8 GB | 1.5 GB |
| Events in quadrant A | 12,055,736 | 9,470,270 |
| Events in quadrant B | 11,695,818 | 9,496,164 |
| Events in quadrant C | 11,841,856 | 8,926,620 |
| Events in quadrant D | 10,206,834 | 8,116,360 |
| Mode SS | |||
|---|---|---|---|
| Quadrant | BADHDUFLAG | Total packets | Discarded packets |
| A | 0 | 4106 | 0 |
| B | 0 | 4106 | 0 |
| C | 0 | 4106 | 0 |
| D | 0 | 4106 | 0 |
| Mode M0 | |||
|---|---|---|---|
| Quadrant | BADHDUFLAG | Total packets | Discarded packets |
| A | 0 | 419866 | 0 |
| B | 0 | 432985 | 0 |
| C | 0 | 455216 | 0 |
| D | 0 | 489199 | 0 |
| Mode M9 | |||
|---|---|---|---|
| Quadrant | BADHDUFLAG | Total packets | Discarded packets |
| A | 0 | 309 | 0 |
| B | 0 | 310 | 0 |
| C | 0 | 311 | 0 |
| D | 0 | 311 | 0 |
| Quadrant | Total seconds | Saturated seconds | Saturation percentage |
|---|---|---|---|
| A | 201614 | 2766 | 1.371929% |
| B | 201614 | 3528 | 1.749878% |
| C | 201613 | 4838 | 2.399647% |
| D | 201613 | 6785 | 3.365358% |
Noise dominated data is calculated using 1-second bins in cleaned event files. If a bin has >2000 counts, and if more than 50% of those come from <1% of pixels, then it is considered to be noise-dominated and hence unusable.
| Quadrant | # 1 sec bins | Bins with >0 counts | Bins with >2000 counts | High rate bins dominated by noise | Noise dominated (total time) | Noise dominated (detector-on time) | Marked lightcurve |
|---|---|---|---|---|---|---|---|
| A | 234119 | 201599 | 0 | 0 | 0.00% | 0.00% |  |
| B | 234119 | 201593 | 0 | 0 | 0.00% | 0.00% |  |
| C | 234119 | 201594 | 0 | 0 | 0.00% | 0.00% |  |
| D | 234118 | 201547 | 0 | 0 | 0.00% | 0.00% | 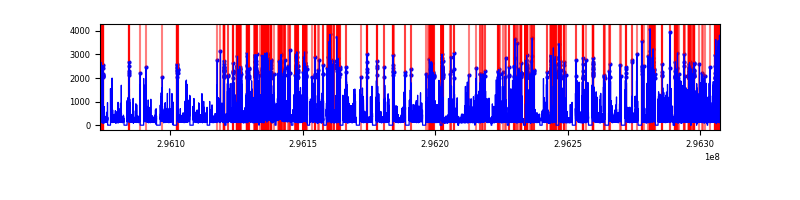 |
Top three noisy pixels from each quadrant. If the there are fewer than three noisy pixels in the level2.evt file, extra rows are filled as -1
| Pixel properties | Quadrant properties | ||||||
|---|---|---|---|---|---|---|---|
| Quadrant | DetID | PixID | Counts | Sigma | Mean | Median | Sigma |
| A | 0 | 29 | 11734 | 11.36 | 3141 | 2946 | 773.5 |
| A | 7 | 110 | 9726 | 8.77 | 3141 | 2946 | 773.5 |
| A | 0 | 30 | 9245 | 8.14 | 3141 | 2946 | 773.5 |
| B | 2 | 9 | 9550 | 10.99 | 3088 | 2944 | 600.8 |
| B | 2 | 8 | 7960 | 8.35 | 3088 | 2944 | 600.8 |
| B | 5 | 225 | 7635 | 7.81 | 3088 | 2944 | 600.8 |
| C | 1 | 80 | 9054 | 7.69 | 3126 | 2921 | 797.6 |
| C | 1 | 81 | 8844 | 7.43 | 3126 | 2921 | 797.6 |
| C | 12 | 241 | 8339 | 6.79 | 3126 | 2921 | 797.6 |
| D | 3 | 14 | 7369 | 6.11 | 2921 | 2658 | 771.4 |
| D | 10 | 189 | 7284 | 6.0 | 2921 | 2658 | 771.4 |
| D | 6 | 231 | 7217 | 5.91 | 2921 | 2658 | 771.4 |
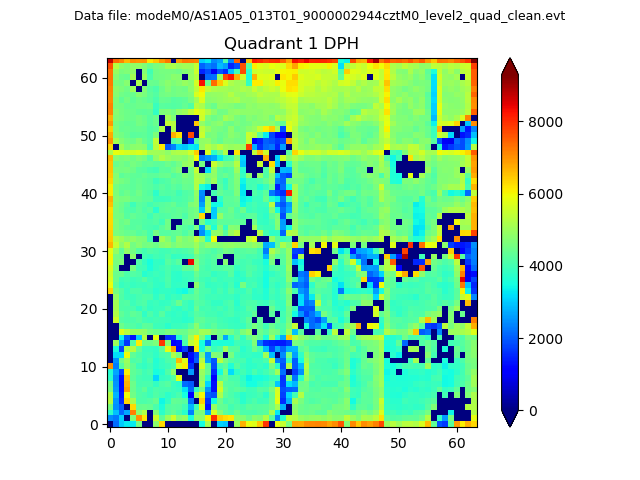
Histogram calculated using DETX and DETY for each event in the final _common_clean file
| Quadrant A |  |
 |
Quadrant B |
|---|---|---|---|
| Quadrant D | 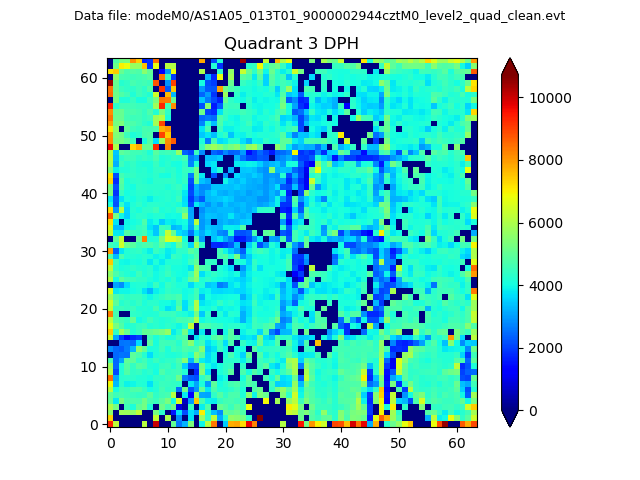 |
 |
Quadrant C |
| Plot type | Count rate plots | Images |
|---|---|---|
| Comparison with Poisson distribution Blue bars denote a histogram of data divided into 1 sec bins. Red curve is a Poisson curve with rate = median count rate of data. |
 |
 |
| Quadrant-wise count rates Data is divided into 100 sec bins |
 |
|
| Module-wise count rates for Quadrant A Data is divided into 100 sec bins |
 |
 |
| Module-wise count rates for Quadrant B Data is divided into 100 sec bins |
 |
 |
| Module-wise count rates for Quadrant C Data is divided into 100 sec bins |
 |
 |
| Module-wise count rates for Quadrant D Data is divided into 100 sec bins |
 |
 |
| Parameter | Plot |
|---|---|
| CZT HV Monitor |  |
| D_VDD |  |
| Temperature 1 |  |
| Veto HV Monitor |  |
| Veto LLD | 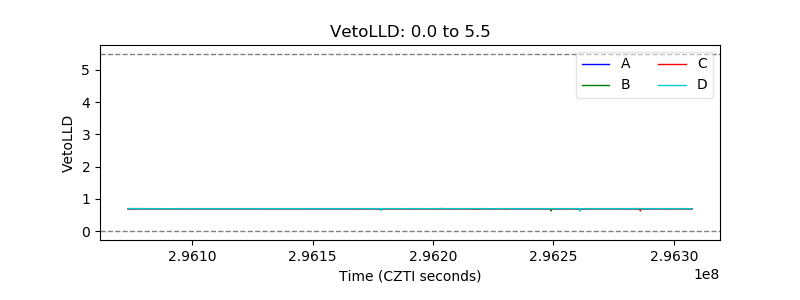 |
| Alpha Counter |  |
| _CPM_Rate |  |
| CZT Counter |  |
| +2.5 Volts monitor |  |
| +5 Volts monitor |  |
| _ROLL_ROT |  |
| _Roll_DEC |  |
| _Roll_RA | 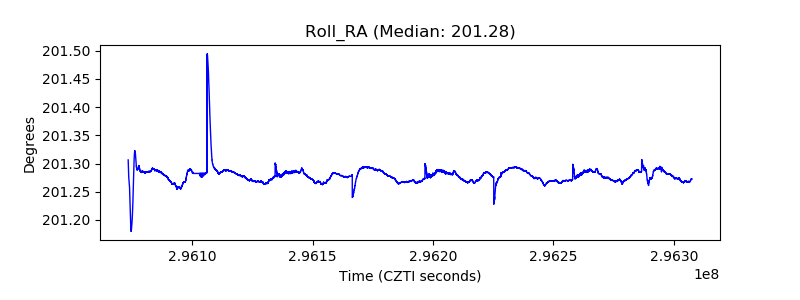 |
| Veto Counter |  |