| Param | Original file | Final file |
|---|---|---|
| Filename | modeM0/AS1A05_013T01_9000002944_19695cztM0_level2.evt | modeM0/AS1A05_013T01_9000002944_19695cztM0_level2_quad_clean.evt |
| Size (bytes) | 304,234,560 | 49,734,720 |
| Size | 290.1 MB | 47.4 MB |
| Events in quadrant A | 2,081,132 | 309,018 |
| Events in quadrant B | 2,210,583 | 314,654 |
| Events in quadrant C | 2,233,630 | 293,284 |
| Events in quadrant D | 2,391,066 | 281,983 |
| Mode SS | |||
|---|---|---|---|
| Quadrant | BADHDUFLAG | Total packets | Discarded packets |
| A | 0 | 90 | 0 |
| B | 0 | 90 | 0 |
| C | 0 | 90 | 0 |
| D | 0 | 90 | 0 |
| Mode M0 | |||
|---|---|---|---|
| Quadrant | BADHDUFLAG | Total packets | Discarded packets |
| A | 0 | 9006 | 1 |
| B | 0 | 9397 | 1 |
| C | 0 | 9369 | 1 |
| D | 0 | 10043 | 1 |
| Mode M9 | |||
|---|---|---|---|
| Quadrant | BADHDUFLAG | Total packets | Discarded packets |
| A | 0 | 10 | 0 |
| B | 0 | 10 | 0 |
| C | 0 | 10 | 0 |
| D | 0 | 10 | 0 |
| Quadrant | Total seconds | Saturated seconds | Saturation percentage |
|---|---|---|---|
| A | 4355 | 25 | 0.574053% |
| B | 4354 | 39 | 0.895728% |
| C | 4354 | 46 | 1.056500% |
| D | 4354 | 117 | 2.687184% |
Noise dominated data is calculated using 1-second bins in cleaned event files. If a bin has >2000 counts, and if more than 50% of those come from <1% of pixels, then it is considered to be noise-dominated and hence unusable.
| Quadrant | # 1 sec bins | Bins with >0 counts | Bins with >2000 counts | High rate bins dominated by noise | Noise dominated (total time) | Noise dominated (detector-on time) | Marked lightcurve |
|---|---|---|---|---|---|---|---|
| A | 5420 | 4356 | 0 | 0 | 0.00% | 0.00% | 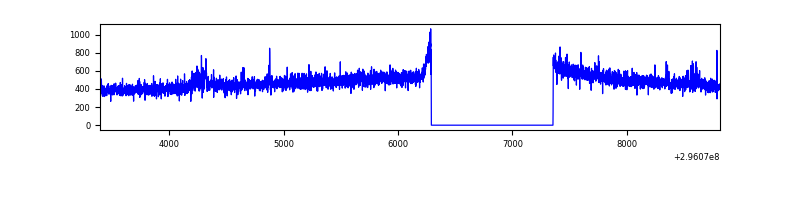 |
| B | 5419 | 4354 | 2 | 2 | 0.04% | 0.05% | 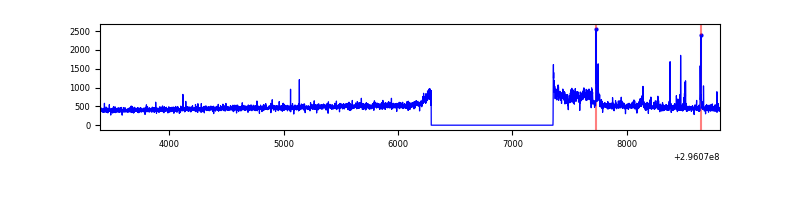 |
| C | 5419 | 4354 | 1 | 1 | 0.02% | 0.02% | 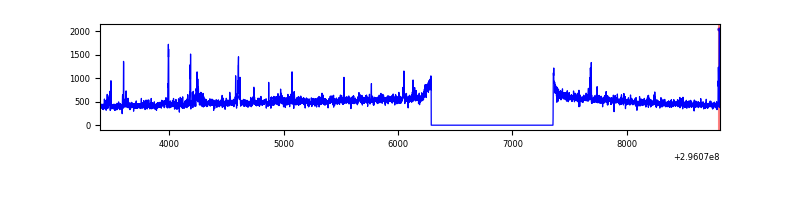 |
| D | 5419 | 4355 | 107 | 107 | 1.97% | 2.46% | 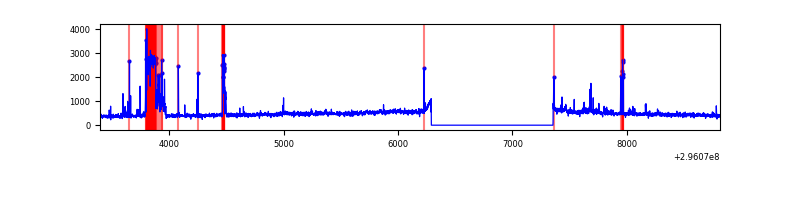 |
Top three noisy pixels from each quadrant. If the there are fewer than three noisy pixels in the level2.evt file, extra rows are filled as -1
| Pixel properties | Quadrant properties | ||||||
|---|---|---|---|---|---|---|---|
| Quadrant | DetID | PixID | Counts | Sigma | Mean | Median | Sigma |
| A | 13 | 252 | 16246 | 144.54 | 533 | 523 | 108.8 |
| A | 10 | 253 | 9763 | 84.94 | 533 | 523 | 108.8 |
| A | 0 | 226 | 4626 | 37.72 | 533 | 523 | 108.8 |
| B | 4 | 216 | 69668 | 669.7 | 534 | 520 | 103.3 |
| B | 0 | 189 | 28023 | 266.37 | 534 | 520 | 103.3 |
| B | 0 | 197 | 13313 | 123.9 | 534 | 520 | 103.3 |
| C | 14 | 238 | 80767 | 671.4 | 509 | 512 | 119.5 |
| C | 3 | 233 | 74208 | 616.53 | 509 | 512 | 119.5 |
| C | 7 | 247 | 39752 | 328.28 | 509 | 512 | 119.5 |
| D | 7 | 238 | 375582 | 3012.68 | 509 | 494 | 124.5 |
| D | 12 | 227 | 46567 | 370.06 | 509 | 494 | 124.5 |
| D | 2 | 16 | 16885 | 131.65 | 509 | 494 | 124.5 |
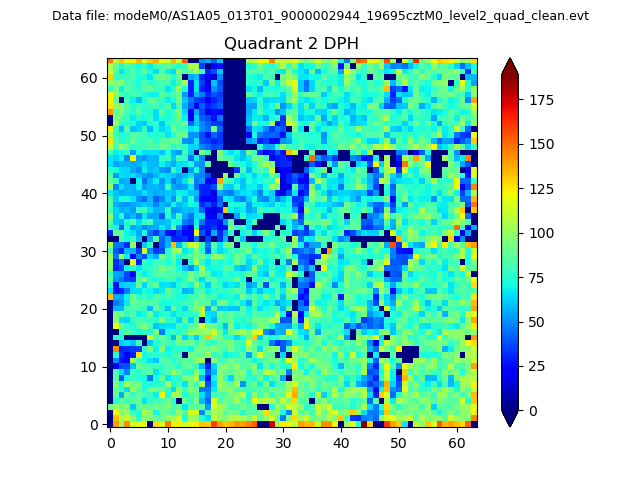
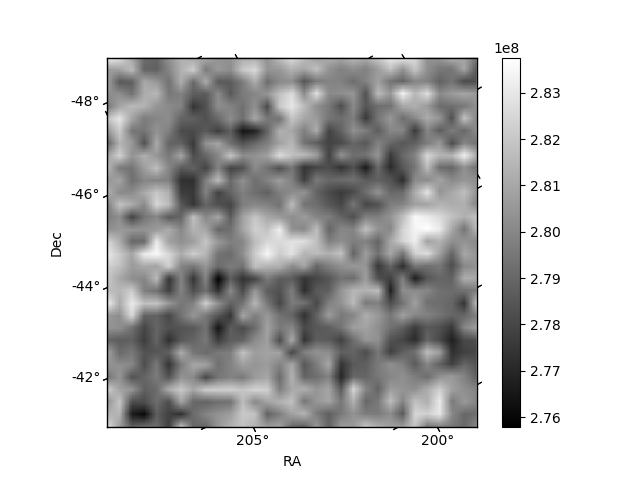
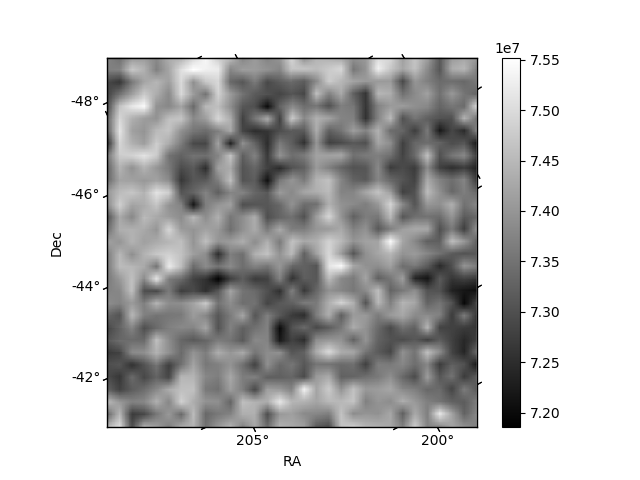
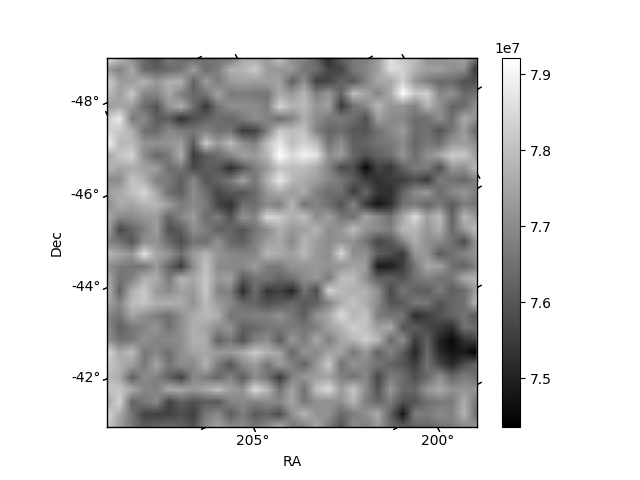
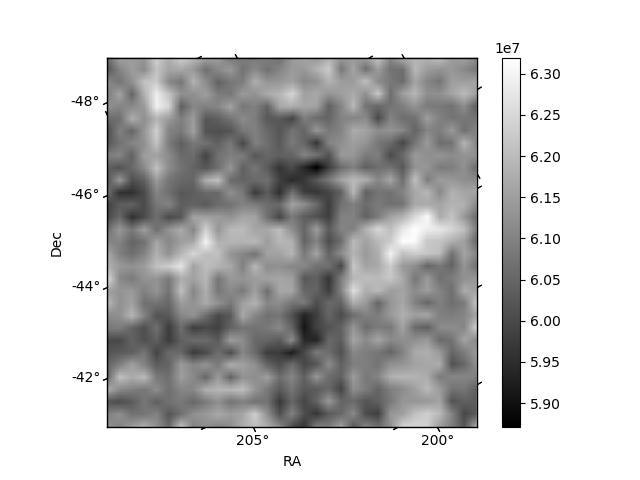
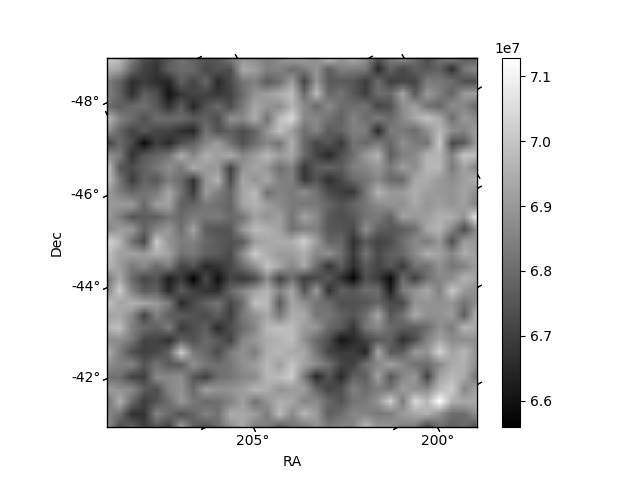
Histogram calculated using DETX and DETY for each event in the final _common_clean file
| Quadrant A | 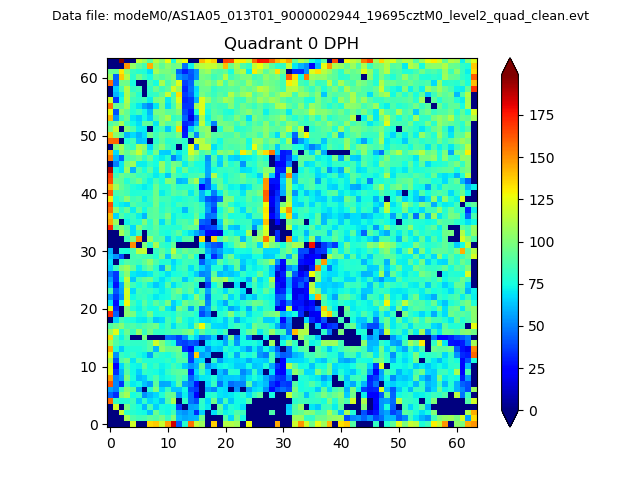 |
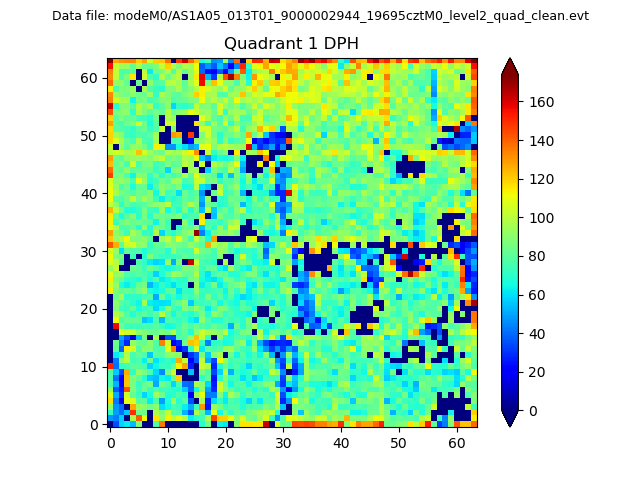 |
Quadrant B |
|---|---|---|---|
| Quadrant D | 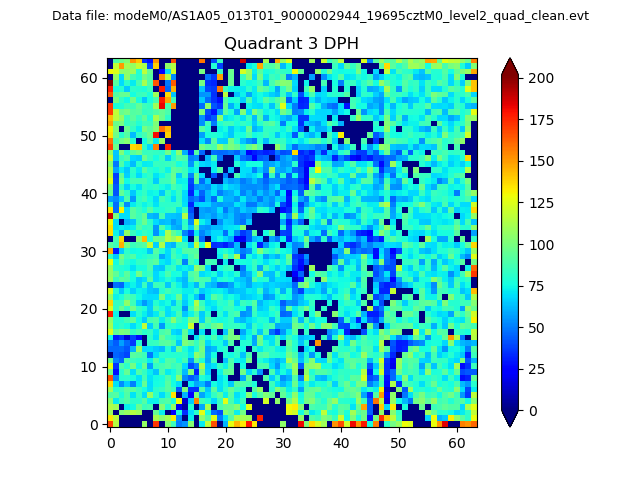 |
 |
Quadrant C |
| Plot type | Count rate plots | Images |
|---|---|---|
| Comparison with Poisson distribution Blue bars denote a histogram of data divided into 1 sec bins. Red curve is a Poisson curve with rate = median count rate of data. |
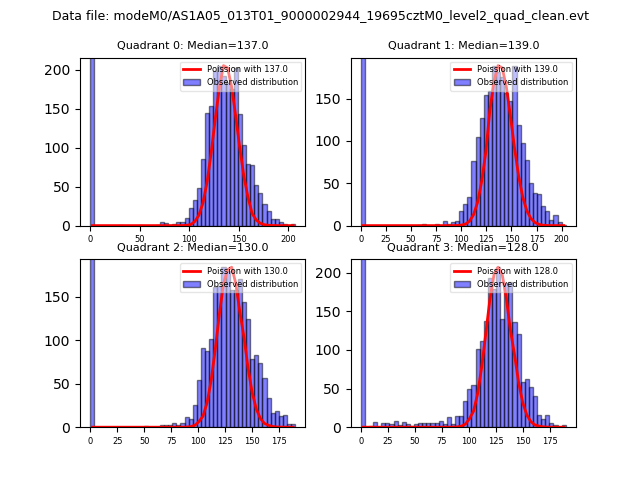 |
 |
| Quadrant-wise count rates Data is divided into 100 sec bins |
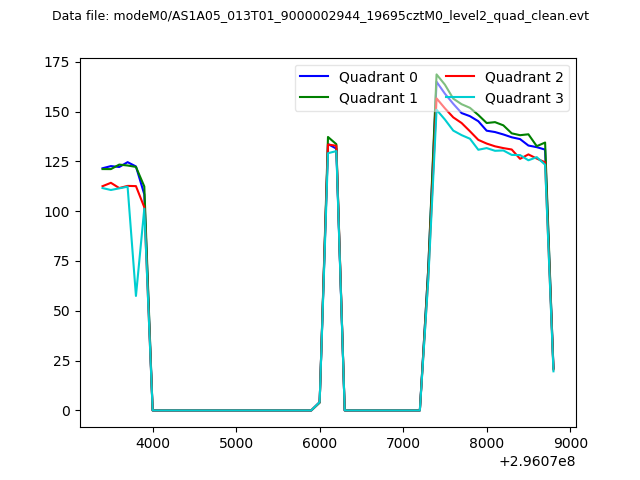 |
|
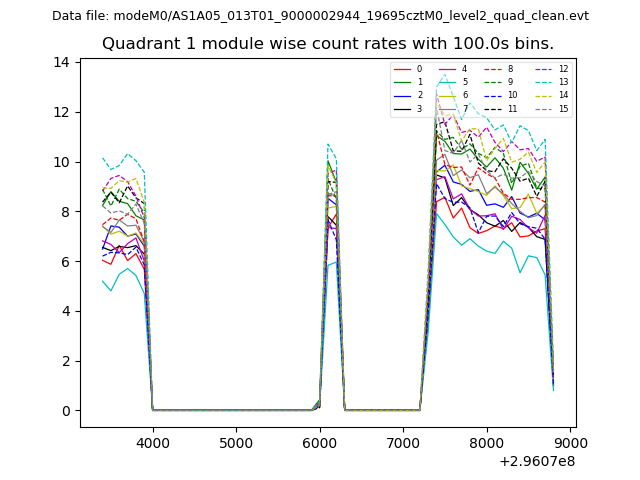
| Module-wise count rates for Quadrant A Data is divided into 100 sec bins |
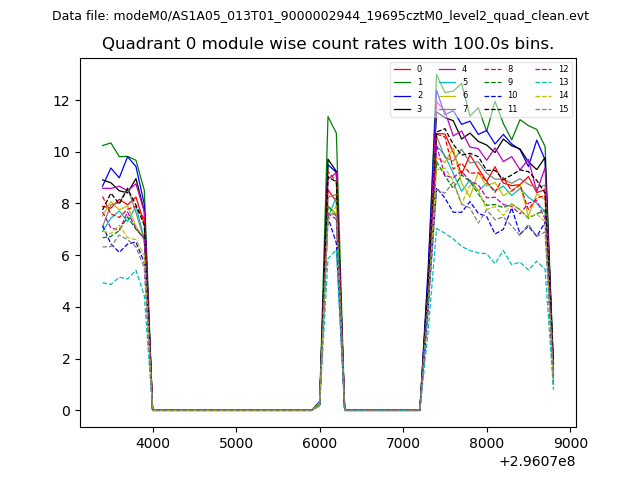 |
 |
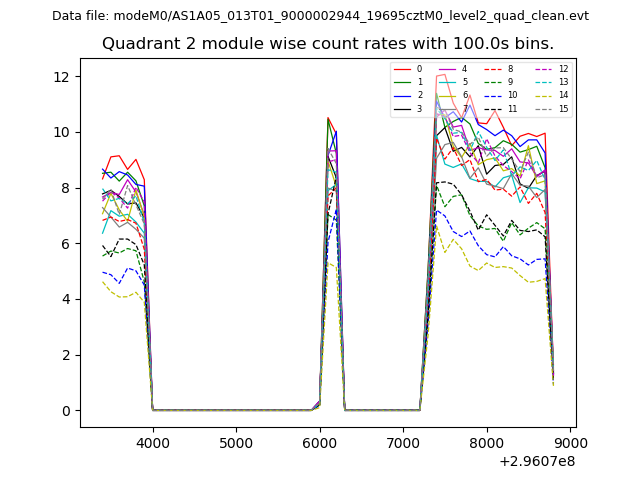
| Module-wise count rates for Quadrant B Data is divided into 100 sec bins |
 |
 |
| Module-wise count rates for Quadrant C Data is divided into 100 sec bins |
 |
 |
| Module-wise count rates for Quadrant D Data is divided into 100 sec bins |
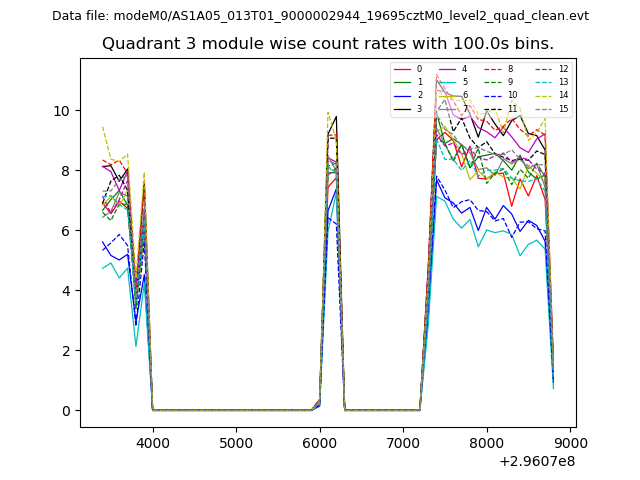 |
 |
| Parameter | Plot |
|---|---|
| CZT HV Monitor | 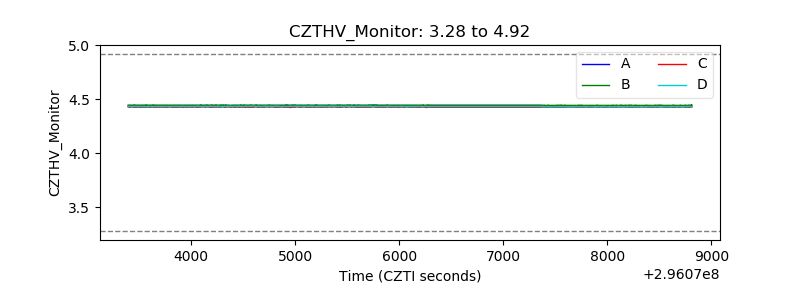 |
| D_VDD | 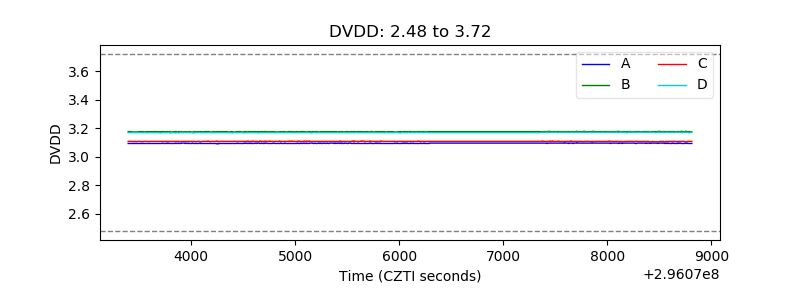 |
| Temperature 1 | 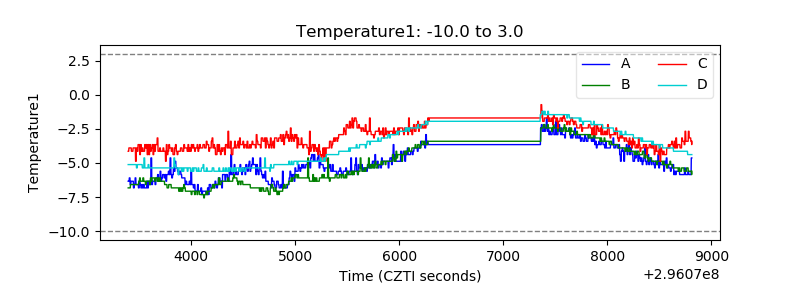 |
| Veto HV Monitor | 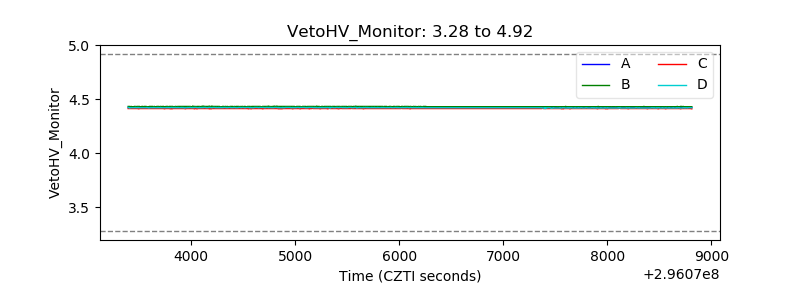 |
| Veto LLD | 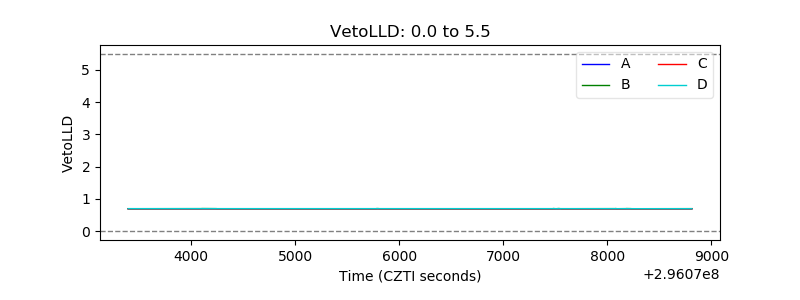 |
| Alpha Counter | 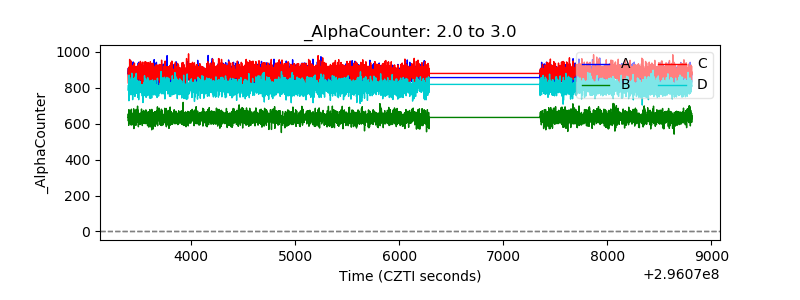 |
| _CPM_Rate | 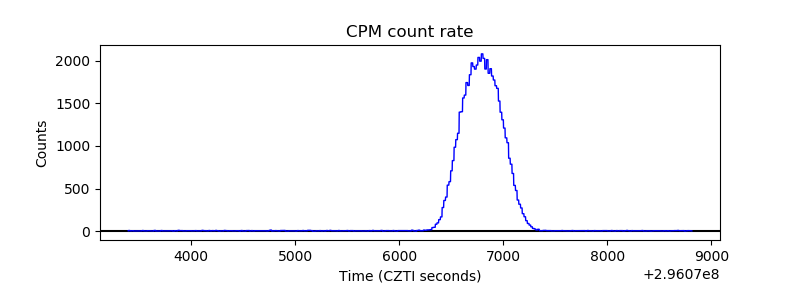 |
| CZT Counter | 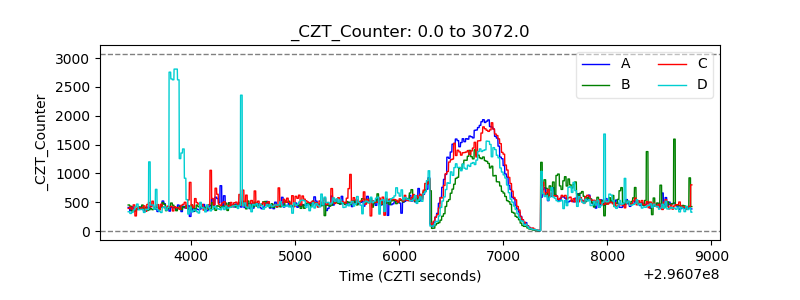 |
| +2.5 Volts monitor |  |
| +5 Volts monitor |  |
| _ROLL_ROT | 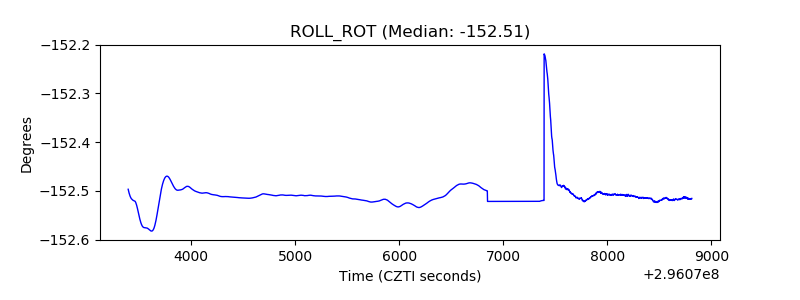 |
| _Roll_DEC | 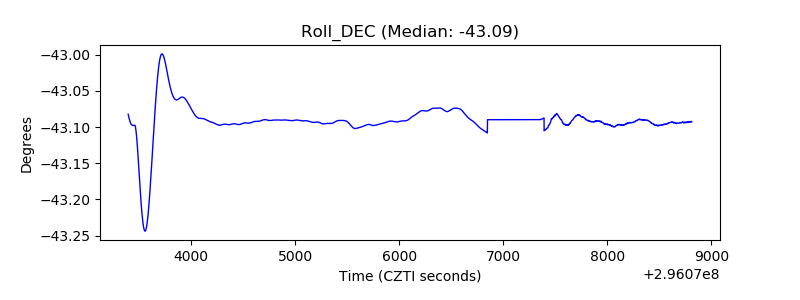 |
| _Roll_RA |  |
| Veto Counter | 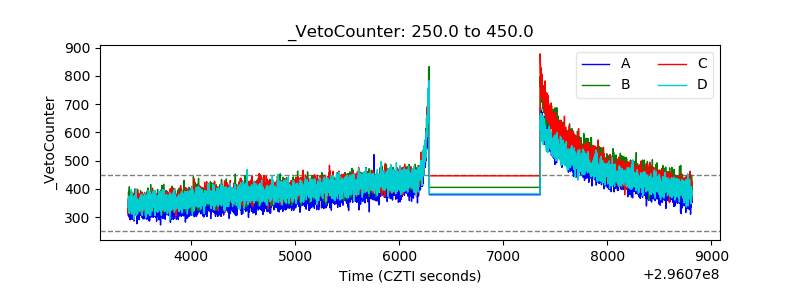 |