| Param | Original file | Final file |
|---|---|---|
| Filename | modeM0/AS1A05_013T01_9000002944_19697cztM0_level2.evt | modeM0/AS1A05_013T01_9000002944_19697cztM0_level2_quad_clean.evt |
| Size (bytes) | 437,207,040 | 93,087,360 |
| Size | 417.0 MB | 88.8 MB |
| Events in quadrant A | 3,055,053 | 607,756 |
| Events in quadrant B | 3,270,768 | 622,696 |
| Events in quadrant C | 3,297,870 | 578,977 |
| Events in quadrant D | 3,184,274 | 565,253 |
| Mode SS | |||
|---|---|---|---|
| Quadrant | BADHDUFLAG | Total packets | Discarded packets |
| A | 0 | 130 | 0 |
| B | 0 | 130 | 0 |
| C | 0 | 130 | 0 |
| D | 0 | 130 | 0 |
| Mode M0 | |||
|---|---|---|---|
| Quadrant | BADHDUFLAG | Total packets | Discarded packets |
| A | 0 | 13233 | 2 |
| B | 0 | 13831 | 2 |
| C | 0 | 13791 | 2 |
| D | 0 | 13823 | 2 |
| Mode M9 | |||
|---|---|---|---|
| Quadrant | BADHDUFLAG | Total packets | Discarded packets |
| A | 0 | 13 | 0 |
| B | 0 | 14 | 0 |
| C | 0 | 14 | 0 |
| D | 0 | 14 | 0 |
| Quadrant | Total seconds | Saturated seconds | Saturation percentage |
|---|---|---|---|
| A | 6367 | 15 | 0.235590% |
| B | 6367 | 34 | 0.534003% |
| C | 6367 | 50 | 0.785299% |
| D | 6367 | 23 | 0.361238% |
Noise dominated data is calculated using 1-second bins in cleaned event files. If a bin has >2000 counts, and if more than 50% of those come from <1% of pixels, then it is considered to be noise-dominated and hence unusable.
| Quadrant | # 1 sec bins | Bins with >0 counts | Bins with >2000 counts | High rate bins dominated by noise | Noise dominated (total time) | Noise dominated (detector-on time) | Marked lightcurve |
|---|---|---|---|---|---|---|---|
| A | 7557 | 6368 | 0 | 0 | 0.00% | 0.00% | 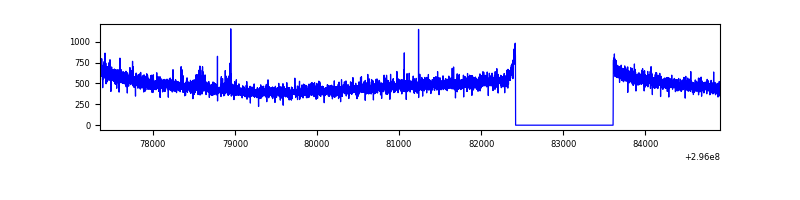 |
| B | 7557 | 6368 | 2 | 2 | 0.03% | 0.03% | 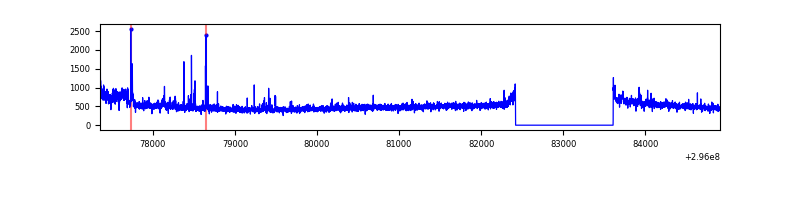 |
| C | 7557 | 6368 | 4 | 4 | 0.05% | 0.06% | 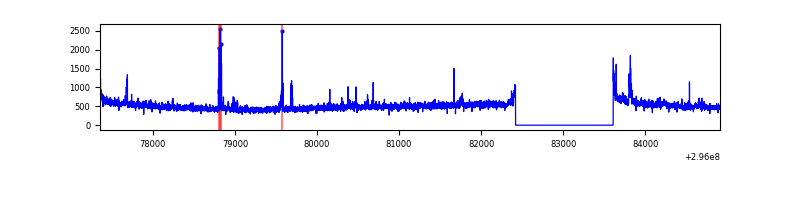 |
| D | 7557 | 6368 | 23 | 23 | 0.30% | 0.36% | 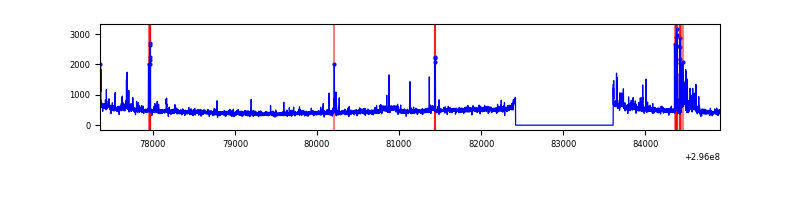 |
Top three noisy pixels from each quadrant. If the there are fewer than three noisy pixels in the level2.evt file, extra rows are filled as -1
| Pixel properties | Quadrant properties | ||||||
|---|---|---|---|---|---|---|---|
| Quadrant | DetID | PixID | Counts | Sigma | Mean | Median | Sigma |
| A | 10 | 253 | 16246 | 97.91 | 789 | 774 | 158.0 |
| A | 0 | 226 | 7015 | 39.49 | 789 | 774 | 158.0 |
| A | 3 | 137 | 6275 | 34.81 | 789 | 774 | 158.0 |
| B | 4 | 216 | 71174 | 470.26 | 791 | 772 | 149.7 |
| B | 0 | 189 | 40113 | 262.78 | 791 | 772 | 149.7 |
| B | 0 | 197 | 21082 | 135.66 | 791 | 772 | 149.7 |
| C | 3 | 233 | 193763 | 1107.67 | 748 | 753 | 174.2 |
| C | 14 | 238 | 120080 | 684.81 | 748 | 753 | 174.2 |
| C | 0 | 207 | 58666 | 332.36 | 748 | 753 | 174.2 |
| D | 1 | 52 | 83015 | 448.12 | 752 | 729 | 183.6 |
| D | 10 | 230 | 72096 | 388.66 | 752 | 729 | 183.6 |
| D | 7 | 96 | 51582 | 276.94 | 752 | 729 | 183.6 |
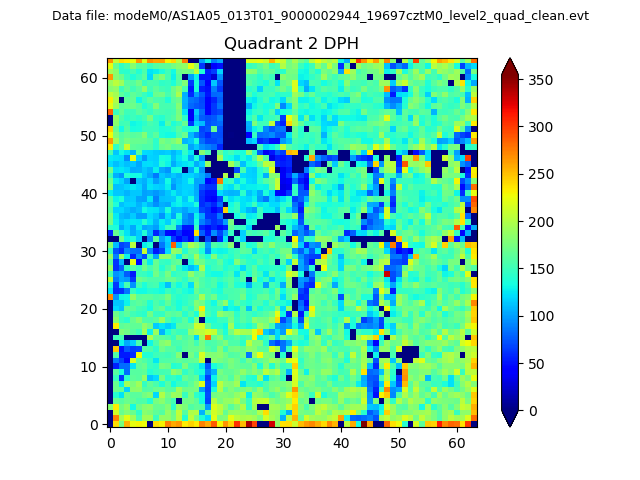
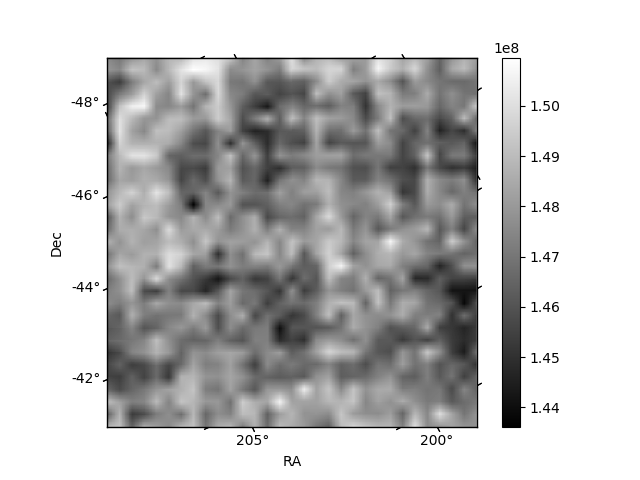
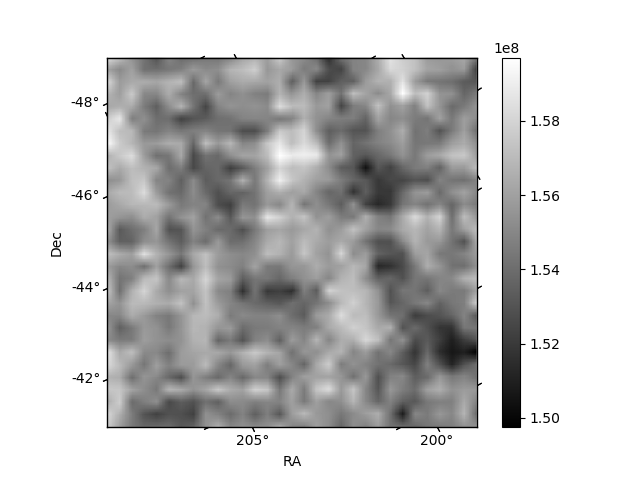
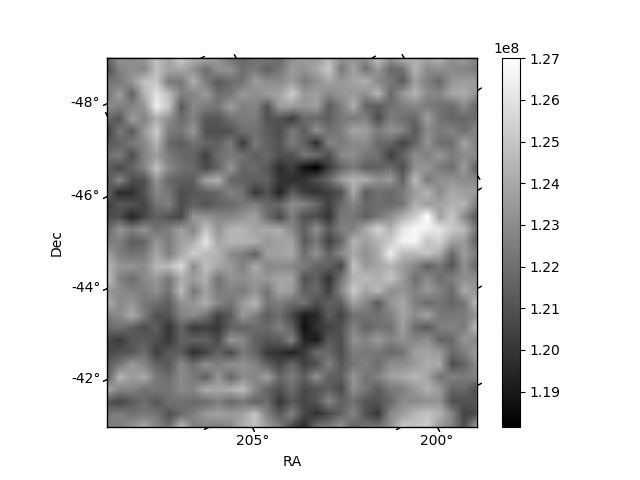
Histogram calculated using DETX and DETY for each event in the final _common_clean file
| Quadrant A | 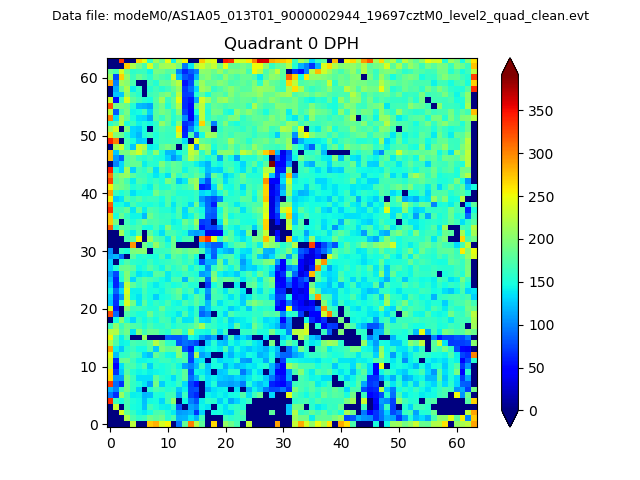 |
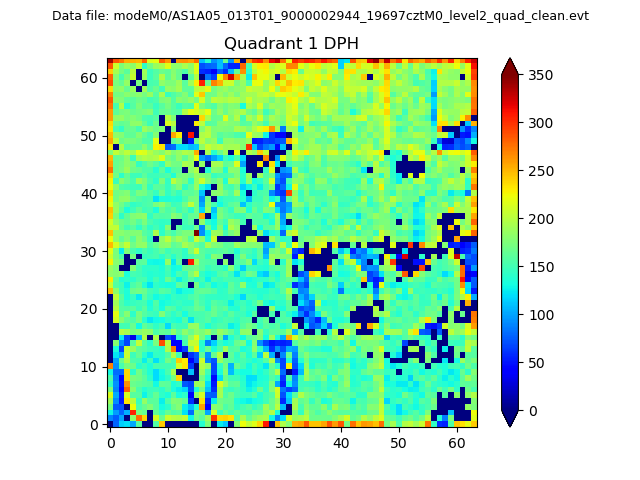 |
Quadrant B |
|---|---|---|---|
| Quadrant D | 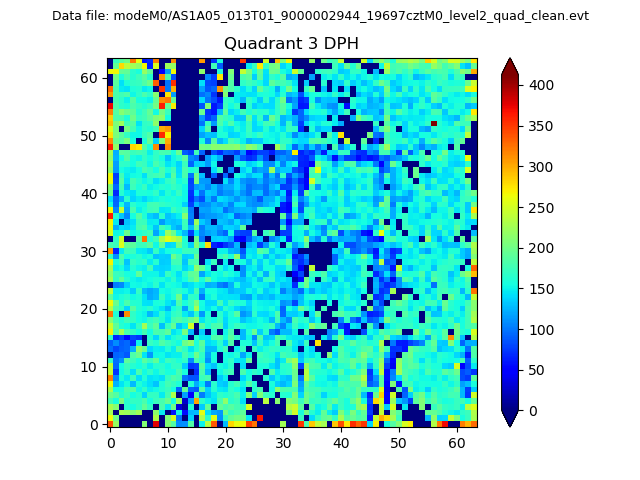 |
 |
Quadrant C |
| Plot type | Count rate plots | Images |
|---|---|---|
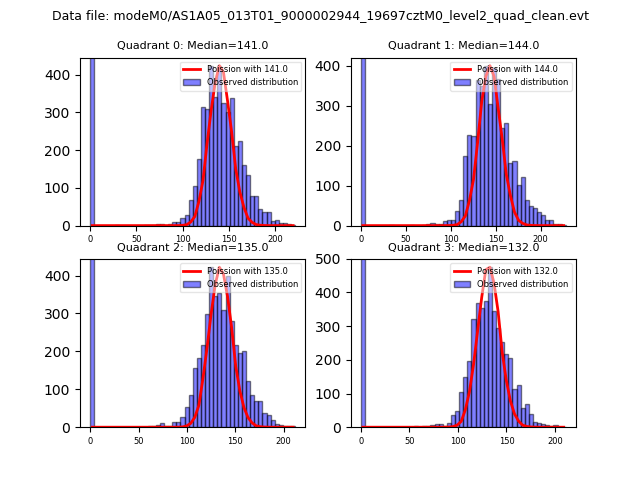
| Comparison with Poisson distribution Blue bars denote a histogram of data divided into 1 sec bins. Red curve is a Poisson curve with rate = median count rate of data. |
 |
 |
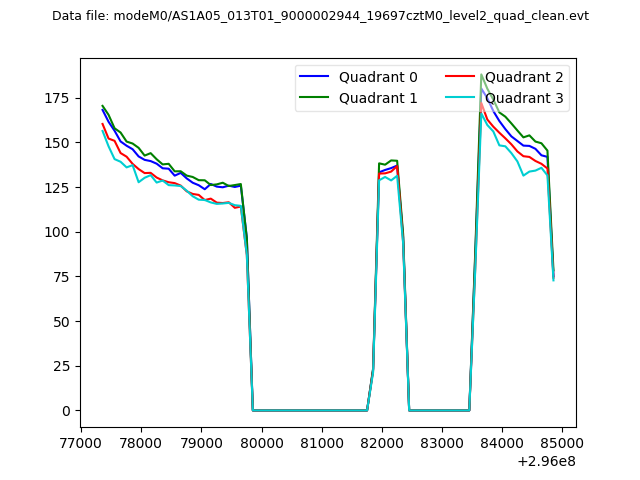
| Quadrant-wise count rates Data is divided into 100 sec bins |
 |
|
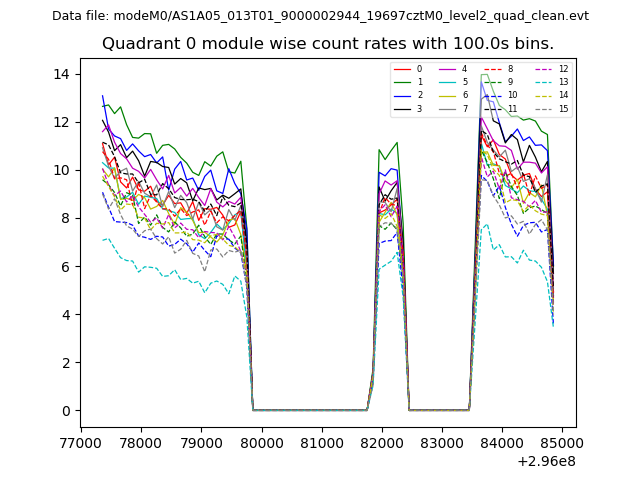
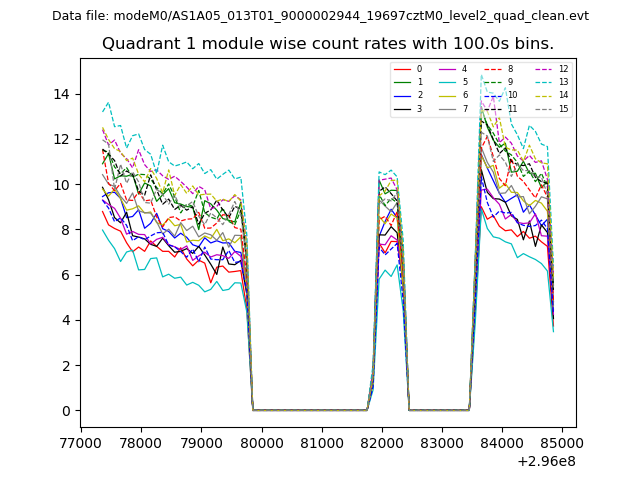
| Module-wise count rates for Quadrant A Data is divided into 100 sec bins |
 |
 |
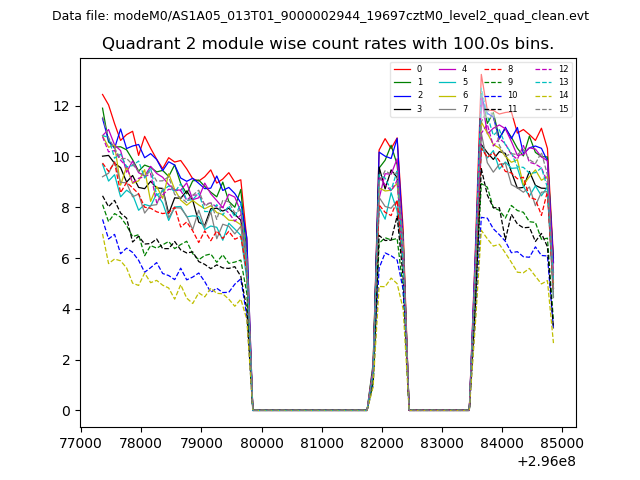
| Module-wise count rates for Quadrant B Data is divided into 100 sec bins |
 |
 |
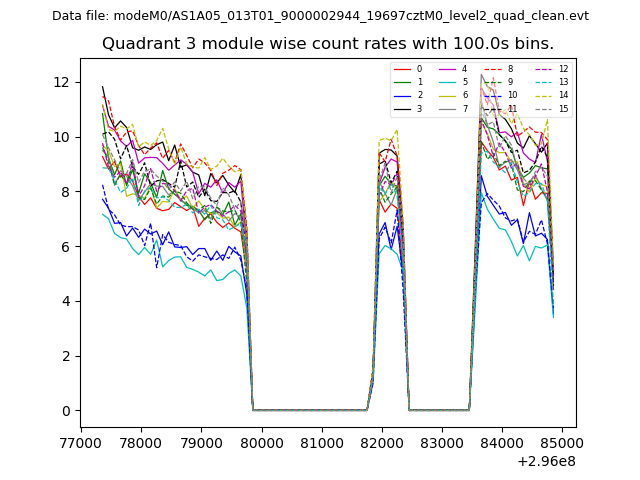
| Module-wise count rates for Quadrant C Data is divided into 100 sec bins |
 |
 |
| Module-wise count rates for Quadrant D Data is divided into 100 sec bins |
 |
 |
| Parameter | Plot |
|---|---|
| CZT HV Monitor | 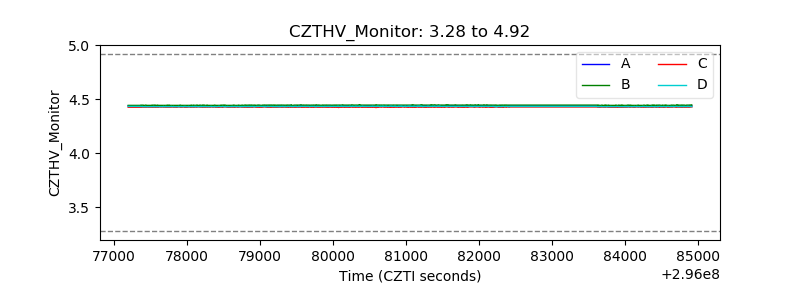 |
| D_VDD | 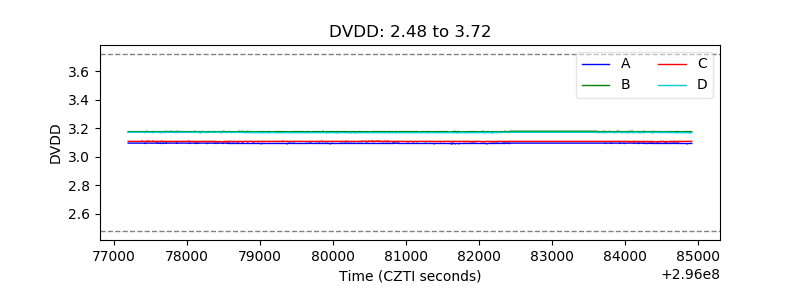 |
| Temperature 1 | 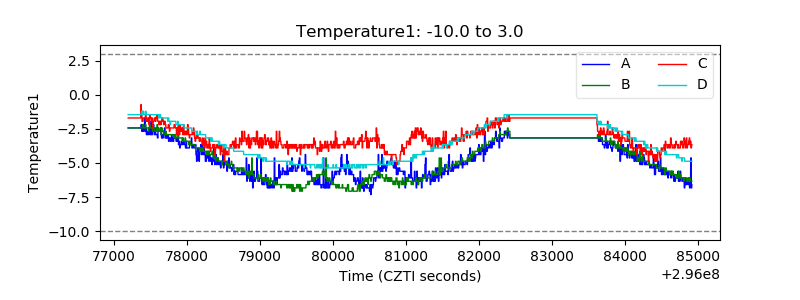 |
| Veto HV Monitor | 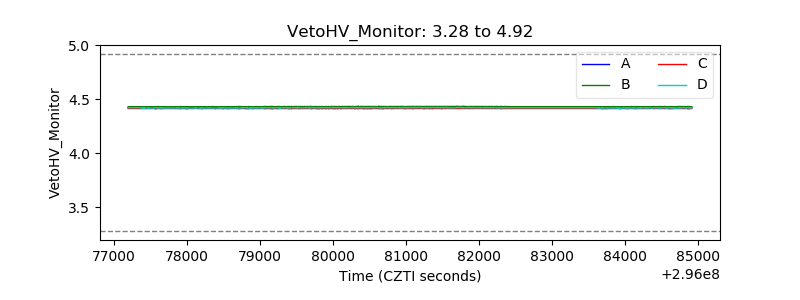 |
| Veto LLD | 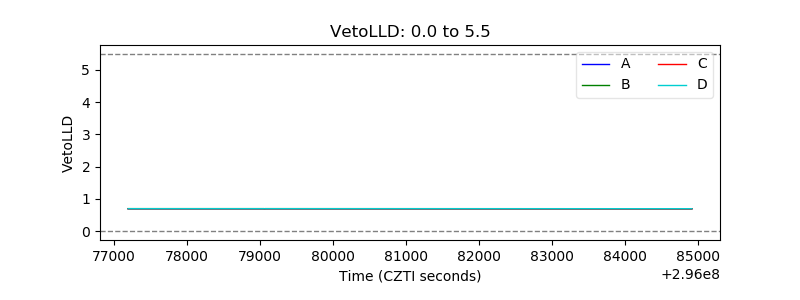 |
| Alpha Counter | 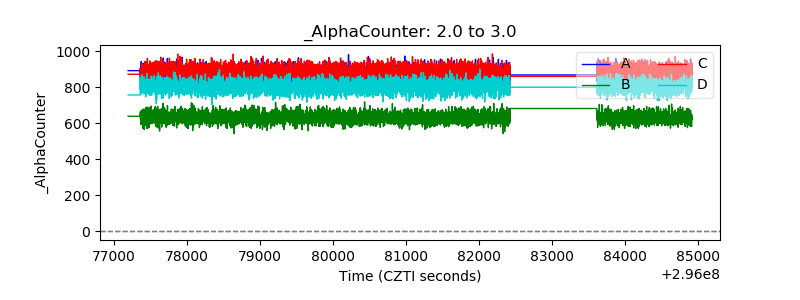 |
| _CPM_Rate | 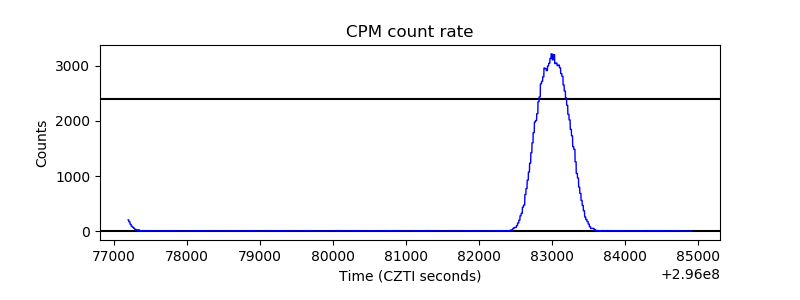 |
| CZT Counter | 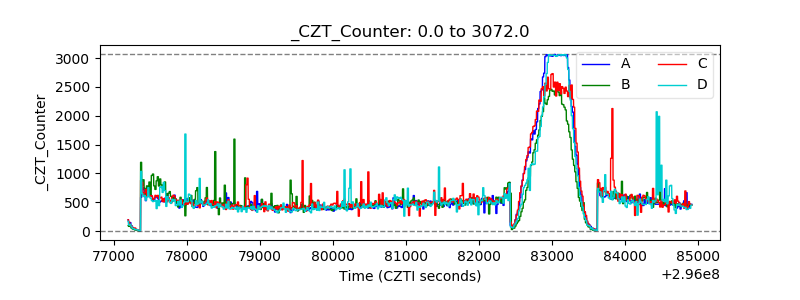 |
| +2.5 Volts monitor |  |
| +5 Volts monitor |  |
| _ROLL_ROT |  |
| _Roll_DEC |  |
| _Roll_RA | 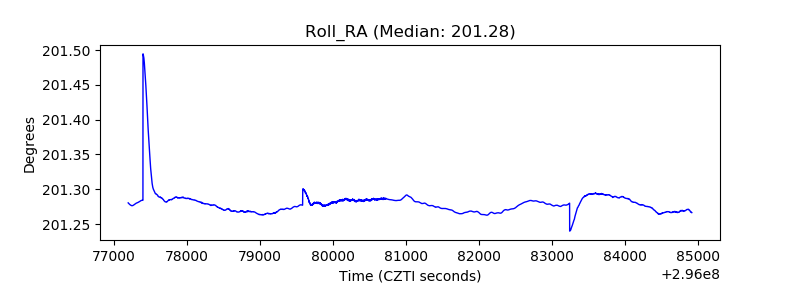 |
| Veto Counter | 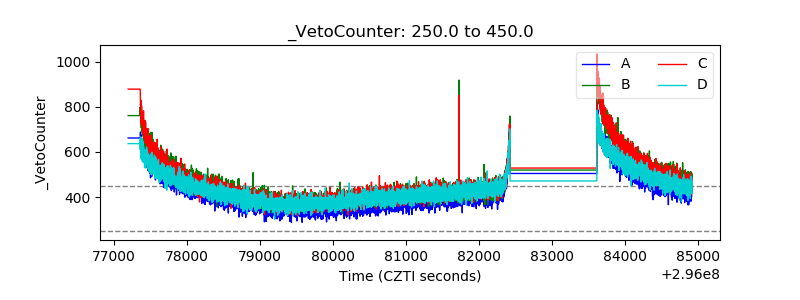 |