| Param | Original file | Final file |
|---|---|---|
| Filename | modeM0/AS1A05_013T01_9000002944_19698cztM0_level2.evt | modeM0/AS1A05_013T01_9000002944_19698cztM0_level2_quad_clean.evt |
| Size (bytes) | 442,823,040 | 96,851,520 |
| Size | 422.3 MB | 92.4 MB |
| Events in quadrant A | 3,098,651 | 633,944 |
| Events in quadrant B | 3,343,259 | 656,297 |
| Events in quadrant C | 3,264,173 | 613,153 |
| Events in quadrant D | 3,277,374 | 590,789 |
| Mode SS | |||
|---|---|---|---|
| Quadrant | BADHDUFLAG | Total packets | Discarded packets |
| A | 0 | 128 | 0 |
| B | 0 | 128 | 0 |
| C | 0 | 128 | 0 |
| D | 0 | 128 | 0 |
| Mode M0 | |||
|---|---|---|---|
| Quadrant | BADHDUFLAG | Total packets | Discarded packets |
| A | 0 | 13187 | 2 |
| B | 0 | 13882 | 2 |
| C | 0 | 13482 | 2 |
| D | 0 | 13820 | 2 |
| Quadrant | Total seconds | Saturated seconds | Saturation percentage |
|---|---|---|---|
| A | 6289 | 19 | 0.302115% |
| B | 6289 | 61 | 0.969948% |
| C | 6289 | 48 | 0.763237% |
| D | 6289 | 47 | 0.747337% |
Noise dominated data is calculated using 1-second bins in cleaned event files. If a bin has >2000 counts, and if more than 50% of those come from <1% of pixels, then it is considered to be noise-dominated and hence unusable.
| Quadrant | # 1 sec bins | Bins with >0 counts | Bins with >2000 counts | High rate bins dominated by noise | Noise dominated (total time) | Noise dominated (detector-on time) | Marked lightcurve |
|---|---|---|---|---|---|---|---|
| A | 7589 | 6290 | 3 | 3 | 0.04% | 0.05% | 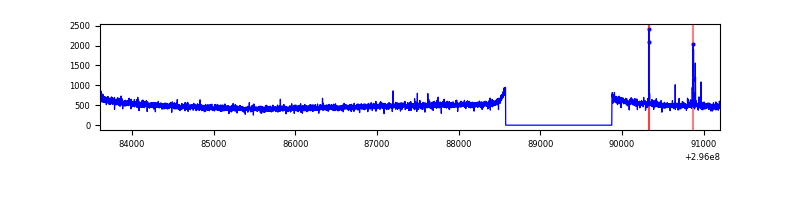 |
| B | 7589 | 6290 | 19 | 19 | 0.25% | 0.30% | 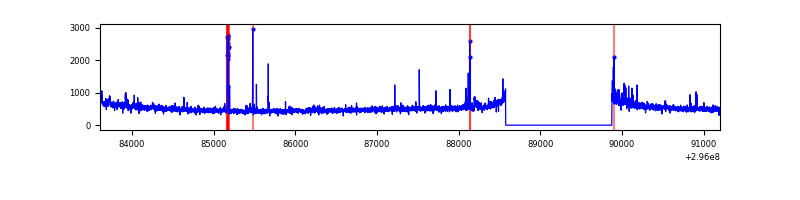 |
| C | 7589 | 6290 | 0 | 0 | 0.00% | 0.00% | 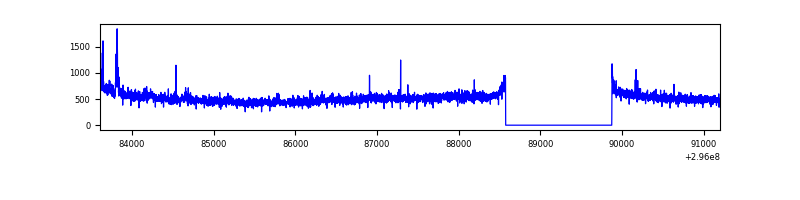 |
| D | 7589 | 6290 | 32 | 32 | 0.42% | 0.51% | 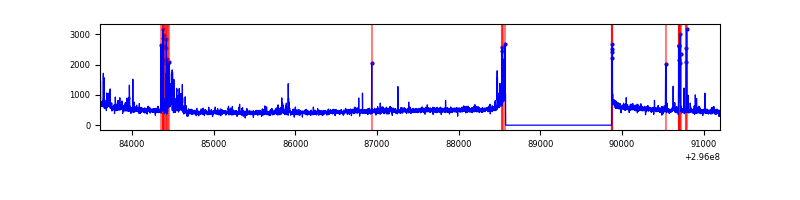 |
Top three noisy pixels from each quadrant. If the there are fewer than three noisy pixels in the level2.evt file, extra rows are filled as -1
| Pixel properties | Quadrant properties | ||||||
|---|---|---|---|---|---|---|---|
| Quadrant | DetID | PixID | Counts | Sigma | Mean | Median | Sigma |
| A | 5 | 16 | 26301 | 159.71 | 798 | 783 | 159.8 |
| A | 0 | 226 | 7064 | 39.31 | 798 | 783 | 159.8 |
| A | 13 | 254 | 6658 | 36.77 | 798 | 783 | 159.8 |
| B | 0 | 189 | 58975 | 387.74 | 806 | 790 | 150.1 |
| B | 0 | 230 | 48714 | 319.36 | 806 | 790 | 150.1 |
| B | 3 | 64 | 23395 | 150.64 | 806 | 790 | 150.1 |
| C | 3 | 233 | 140121 | 781.42 | 767 | 775 | 178.3 |
| C | 14 | 238 | 122663 | 683.52 | 767 | 775 | 178.3 |
| C | 9 | 221 | 5720 | 27.73 | 767 | 775 | 178.3 |
| D | 12 | 218 | 105469 | 560.35 | 766 | 743 | 186.9 |
| D | 10 | 230 | 93024 | 493.77 | 766 | 743 | 186.9 |
| D | 2 | 16 | 59782 | 315.9 | 766 | 743 | 186.9 |
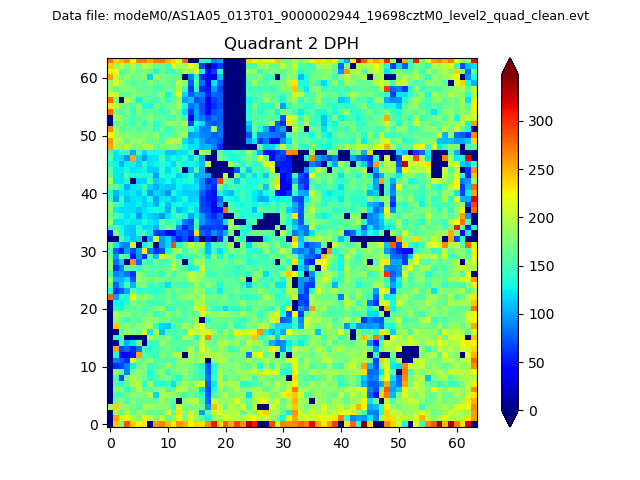
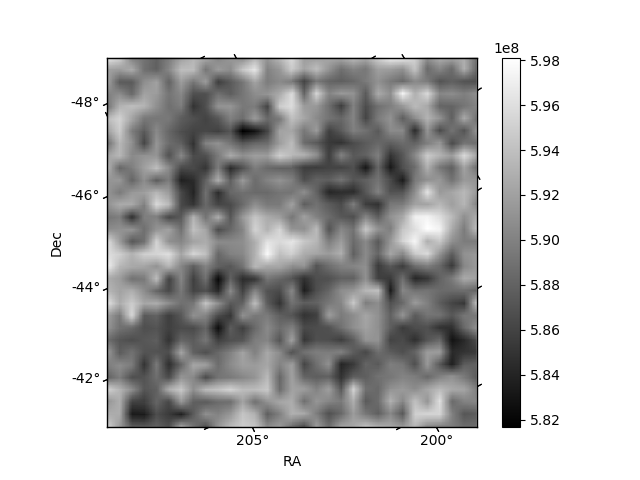
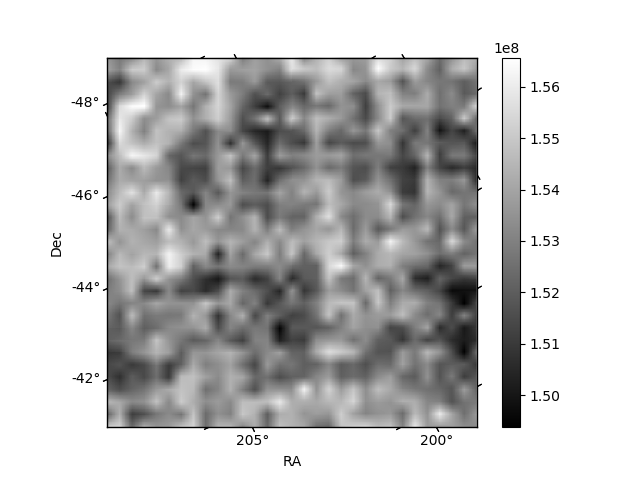
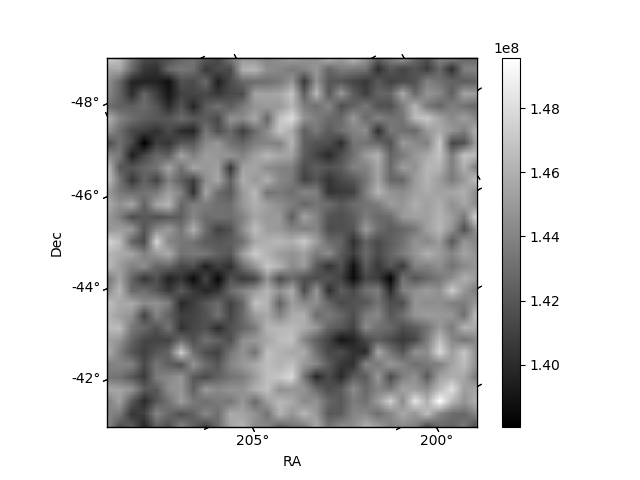
Histogram calculated using DETX and DETY for each event in the final _common_clean file
| Quadrant A | 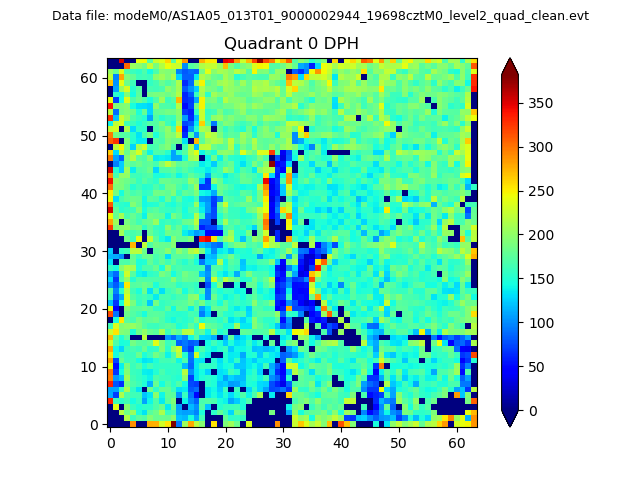 |
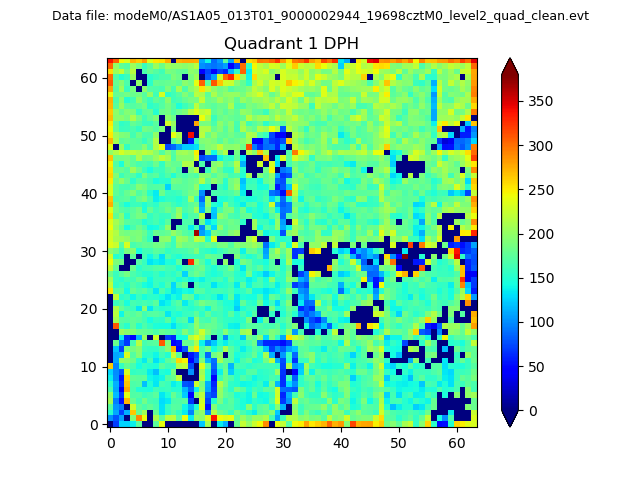 |
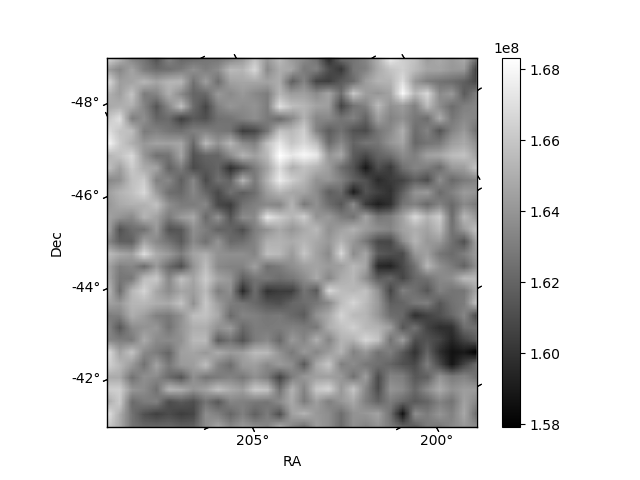
Quadrant B |
|---|---|---|---|
| Quadrant D | 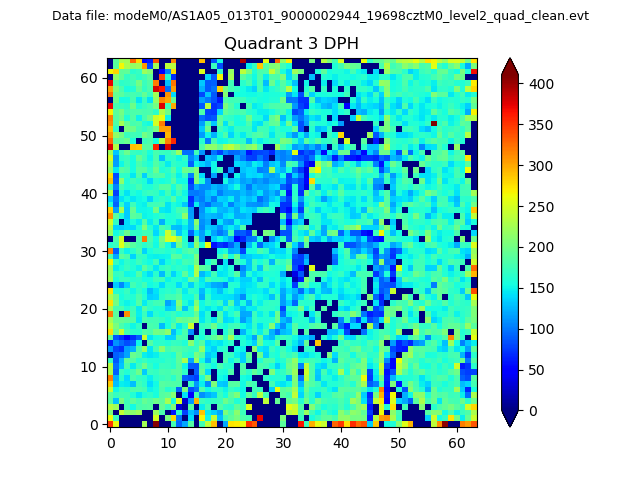 |
 |
Quadrant C |
| Plot type | Count rate plots | Images |
|---|---|---|
| Comparison with Poisson distribution Blue bars denote a histogram of data divided into 1 sec bins. Red curve is a Poisson curve with rate = median count rate of data. |
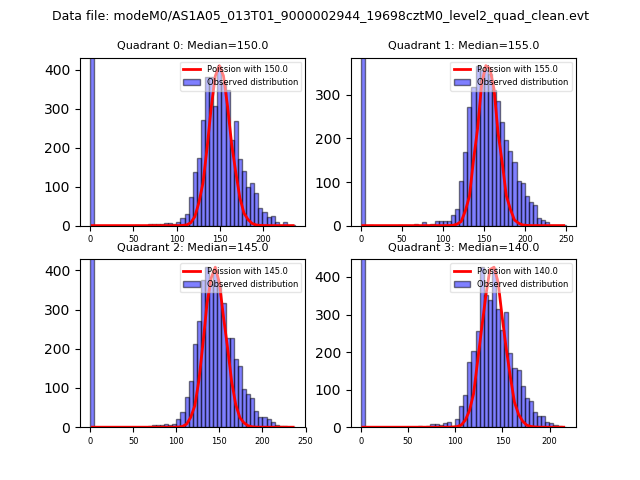 |
 |
| Quadrant-wise count rates Data is divided into 100 sec bins |
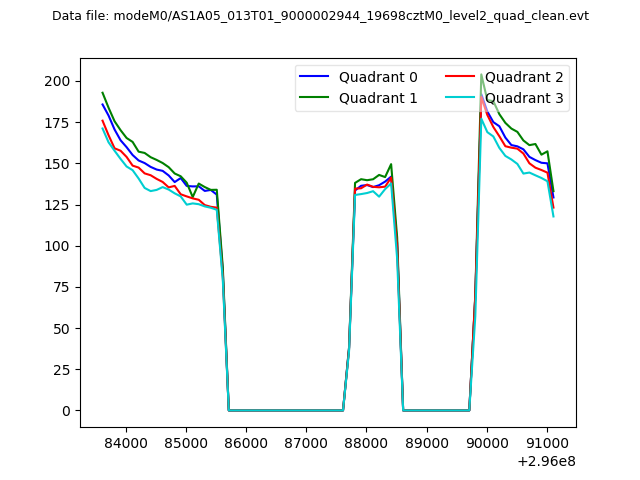 |
|
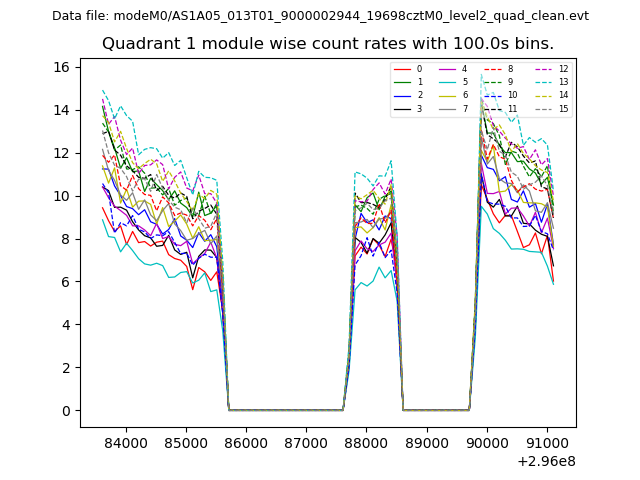
| Module-wise count rates for Quadrant A Data is divided into 100 sec bins |
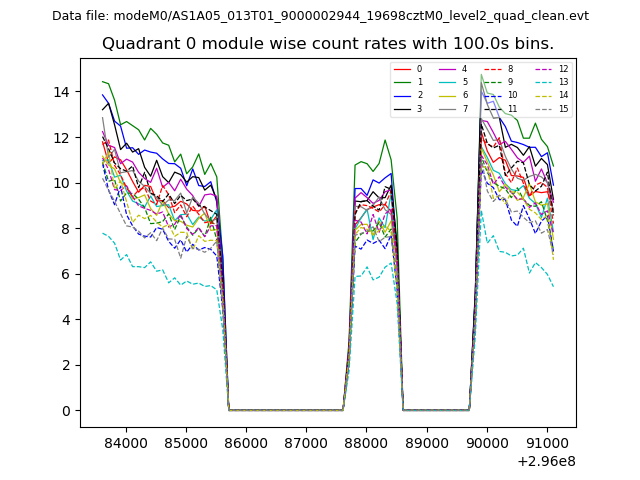 |
 |
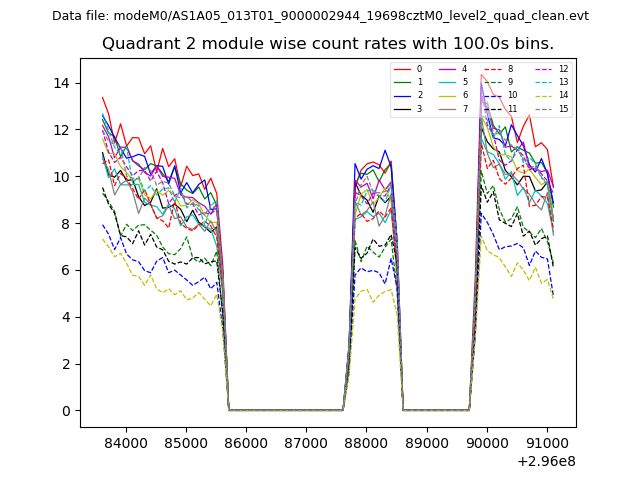
| Module-wise count rates for Quadrant B Data is divided into 100 sec bins |
 |
 |
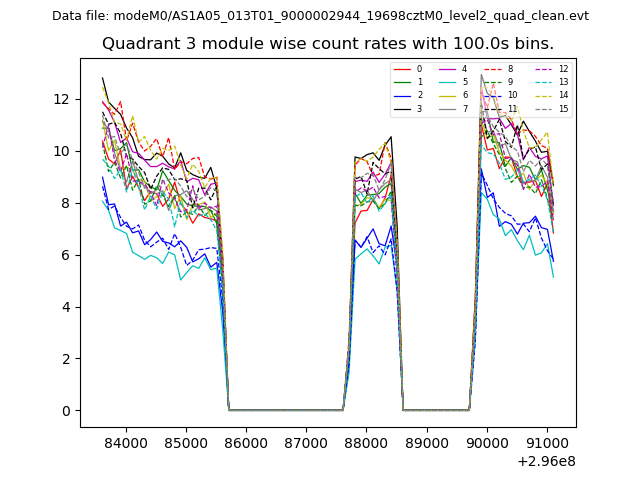
| Module-wise count rates for Quadrant C Data is divided into 100 sec bins |
 |
 |
| Module-wise count rates for Quadrant D Data is divided into 100 sec bins |
 |
 |
| Parameter | Plot |
|---|---|
| CZT HV Monitor | 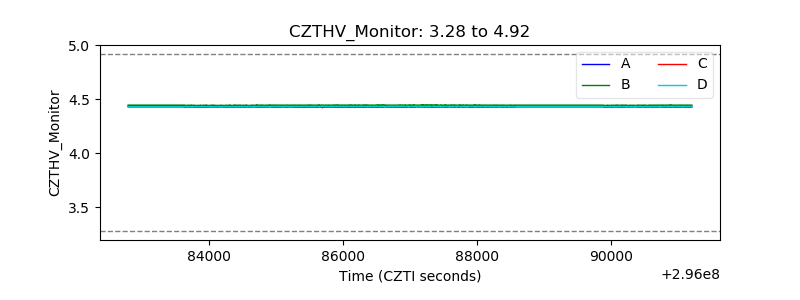 |
| D_VDD | 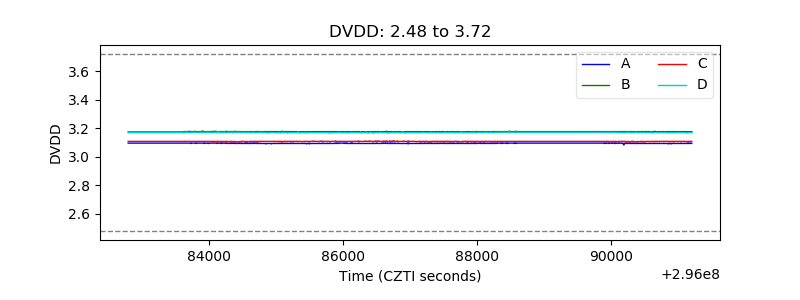 |
| Temperature 1 |  |
| Veto HV Monitor | 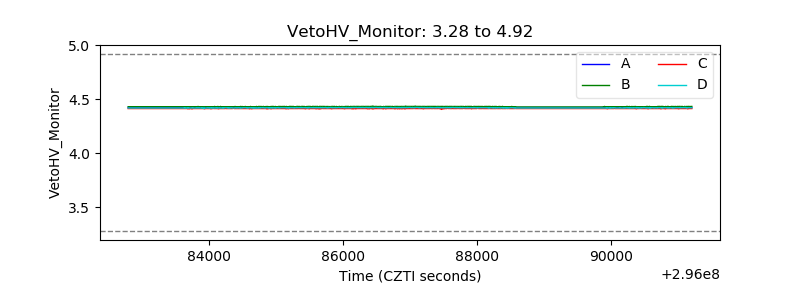 |
| Veto LLD | 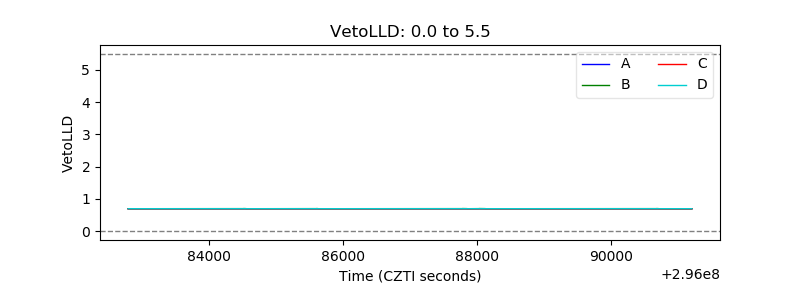 |
| Alpha Counter | 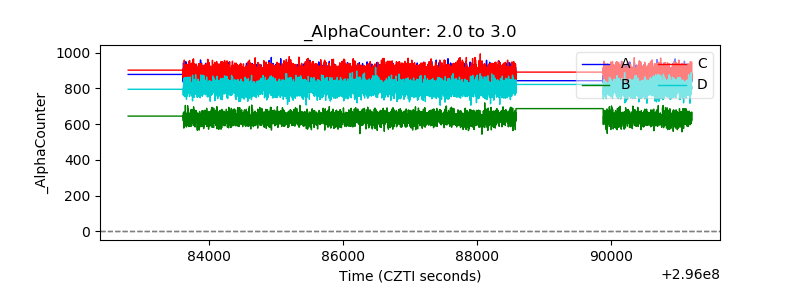 |
| _CPM_Rate | 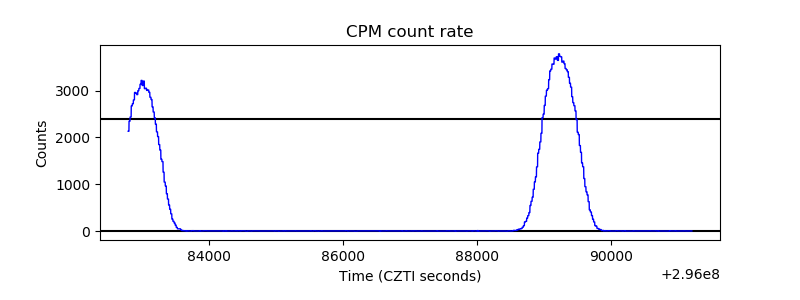 |
| CZT Counter | 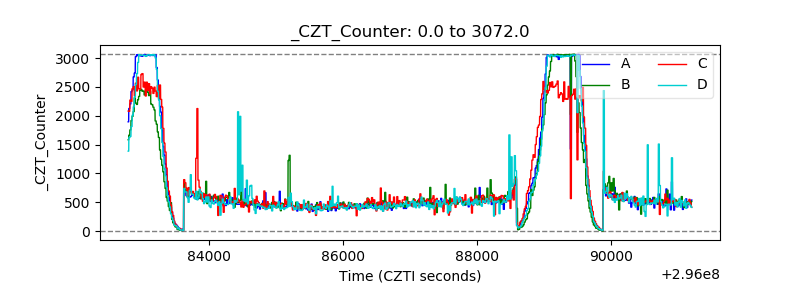 |
| +2.5 Volts monitor |  |
| +5 Volts monitor |  |
| _ROLL_ROT |  |
| _Roll_DEC | 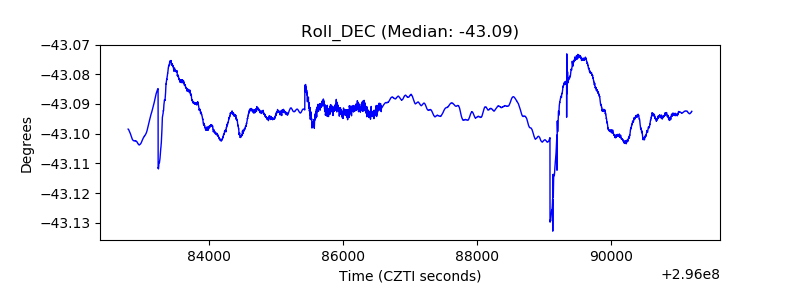 |
| _Roll_RA | 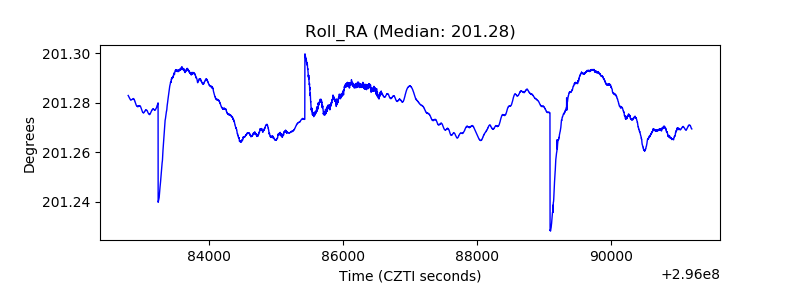 |
| Veto Counter | 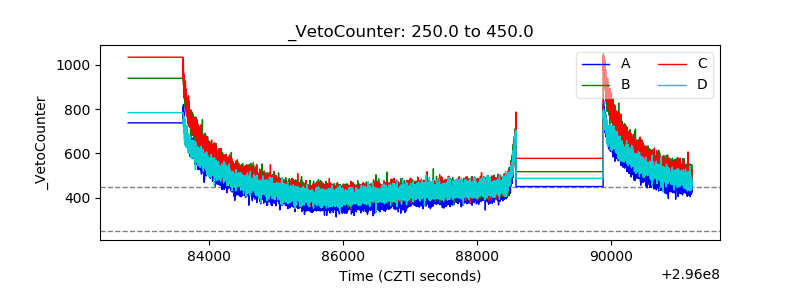 |