| Param | Original file | Final file |
|---|---|---|
| Filename | modeM0/AS1A05_013T01_9000002944_19700cztM0_level2.evt | modeM0/AS1A05_013T01_9000002944_19700cztM0_level2_quad_clean.evt |
| Size (bytes) | 465,762,240 | 88,297,920 |
| Size | 444.2 MB | 84.2 MB |
| Events in quadrant A | 3,229,646 | 563,223 |
| Events in quadrant B | 3,396,485 | 585,548 |
| Events in quadrant C | 3,440,750 | 552,462 |
| Events in quadrant D | 3,611,858 | 533,905 |
| Mode SS | |||
|---|---|---|---|
| Quadrant | BADHDUFLAG | Total packets | Discarded packets |
| A | 0 | 128 | 0 |
| B | 0 | 128 | 0 |
| C | 0 | 128 | 0 |
| D | 0 | 128 | 0 |
| Mode M0 | |||
|---|---|---|---|
| Quadrant | BADHDUFLAG | Total packets | Discarded packets |
| A | 0 | 13349 | 2 |
| B | 0 | 13771 | 2 |
| C | 0 | 13881 | 2 |
| D | 0 | 14695 | 2 |
| Mode M9 | |||
|---|---|---|---|
| Quadrant | BADHDUFLAG | Total packets | Discarded packets |
| A | 0 | 19 | 0 |
| B | 0 | 20 | 0 |
| C | 0 | 20 | 0 |
| D | 0 | 20 | 0 |
| Quadrant | Total seconds | Saturated seconds | Saturation percentage |
|---|---|---|---|
| A | 6286 | 31 | 0.493159% |
| B | 6286 | 53 | 0.843143% |
| C | 6286 | 72 | 1.145402% |
| D | 6286 | 42 | 0.668151% |
Noise dominated data is calculated using 1-second bins in cleaned event files. If a bin has >2000 counts, and if more than 50% of those come from <1% of pixels, then it is considered to be noise-dominated and hence unusable.
| Quadrant | # 1 sec bins | Bins with >0 counts | Bins with >2000 counts | High rate bins dominated by noise | Noise dominated (total time) | Noise dominated (detector-on time) | Marked lightcurve |
|---|---|---|---|---|---|---|---|
| A | 7666 | 6287 | 7 | 7 | 0.09% | 0.11% | 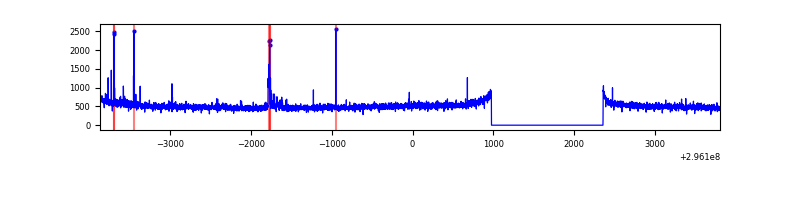 |
| B | 7666 | 6287 | 6 | 6 | 0.08% | 0.10% | 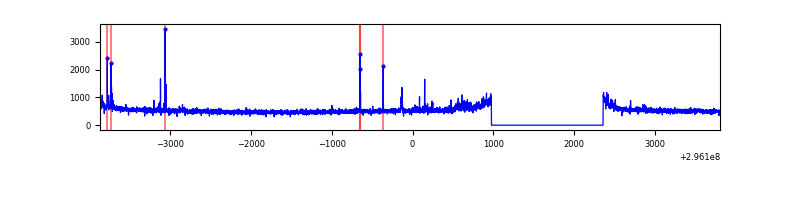 |
| C | 7666 | 6286 | 11 | 11 | 0.14% | 0.17% | 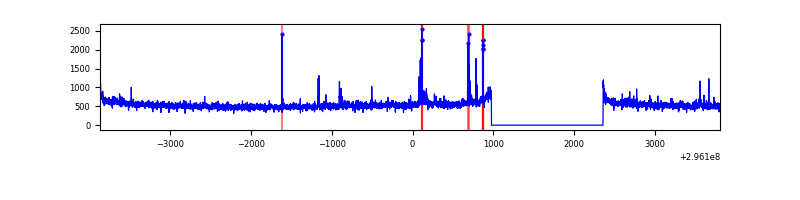 |
| D | 7666 | 6287 | 43 | 43 | 0.56% | 0.68% | 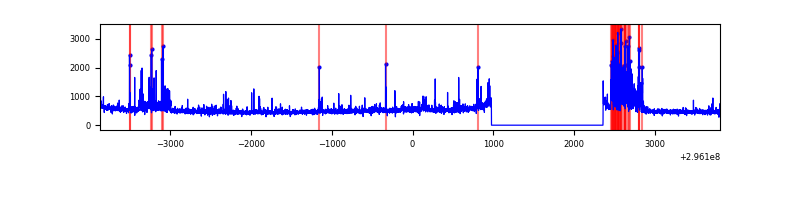 |
Top three noisy pixels from each quadrant. If the there are fewer than three noisy pixels in the level2.evt file, extra rows are filled as -1
| Pixel properties | Quadrant properties | ||||||
|---|---|---|---|---|---|---|---|
| Quadrant | DetID | PixID | Counts | Sigma | Mean | Median | Sigma |
| A | 13 | 252 | 53398 | 320.44 | 817 | 805 | 164.1 |
| A | 5 | 16 | 26839 | 158.62 | 817 | 805 | 164.1 |
| A | 0 | 226 | 7085 | 38.26 | 817 | 805 | 164.1 |
| B | 0 | 189 | 96966 | 620.12 | 830 | 813 | 155.1 |
| B | 0 | 230 | 18748 | 115.67 | 830 | 813 | 155.1 |
| B | 12 | 111 | 17780 | 109.43 | 830 | 813 | 155.1 |
| C | 3 | 233 | 182943 | 985.69 | 801 | 811 | 184.8 |
| C | 14 | 238 | 127481 | 685.53 | 801 | 811 | 184.8 |
| C | 13 | 61 | 5701 | 26.46 | 801 | 811 | 184.8 |
| D | 2 | 16 | 497082 | 2596.54 | 798 | 777 | 191.1 |
| D | 1 | 52 | 67343 | 348.26 | 798 | 777 | 191.1 |
| D | 2 | 234 | 22670 | 114.54 | 798 | 777 | 191.1 |
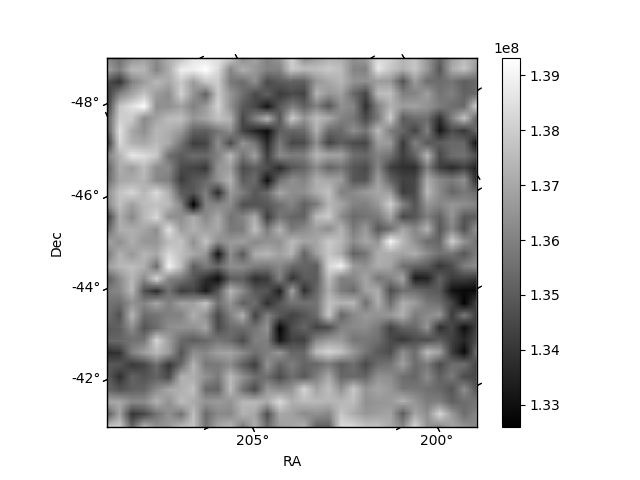
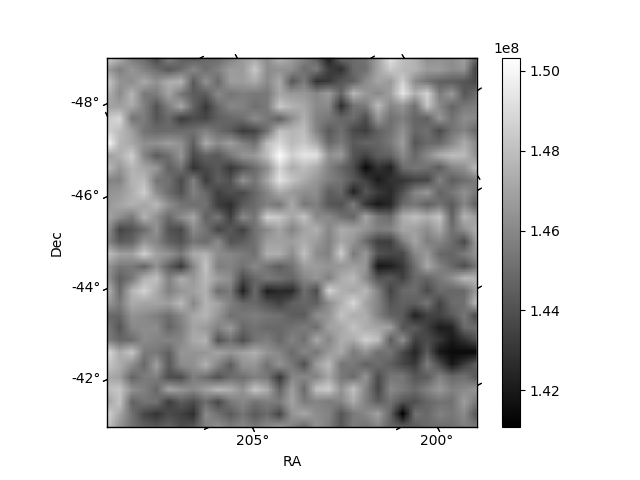
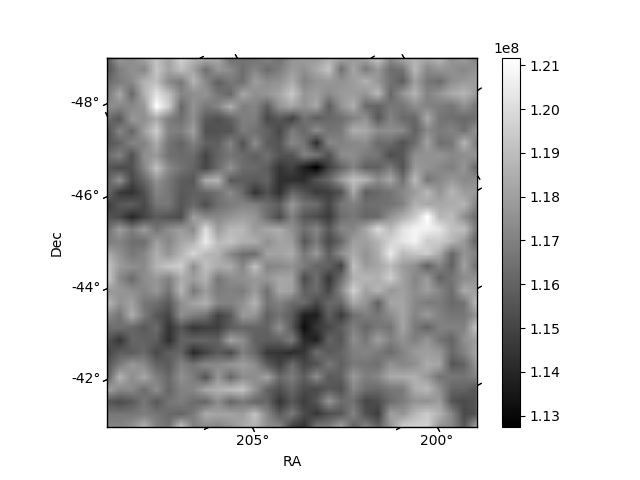
Histogram calculated using DETX and DETY for each event in the final _common_clean file
| Quadrant A | 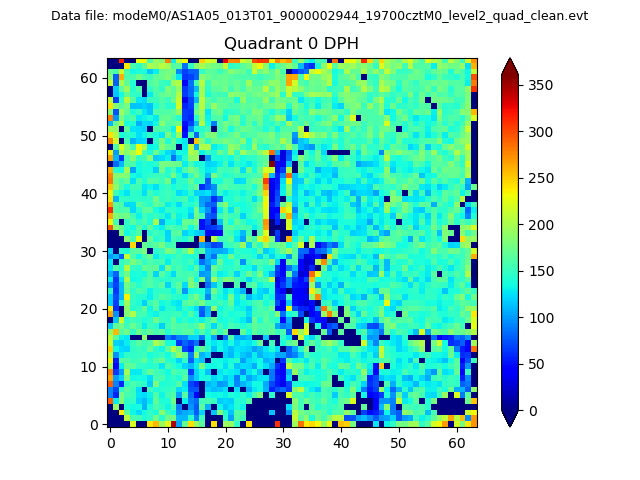 |
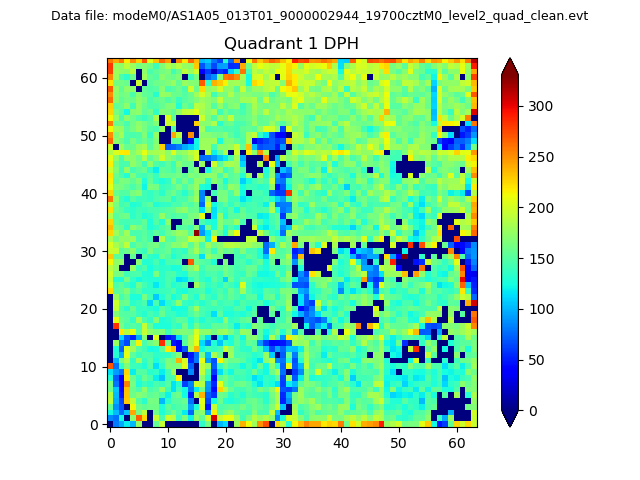 |
Quadrant B |
|---|---|---|---|
| Quadrant D | 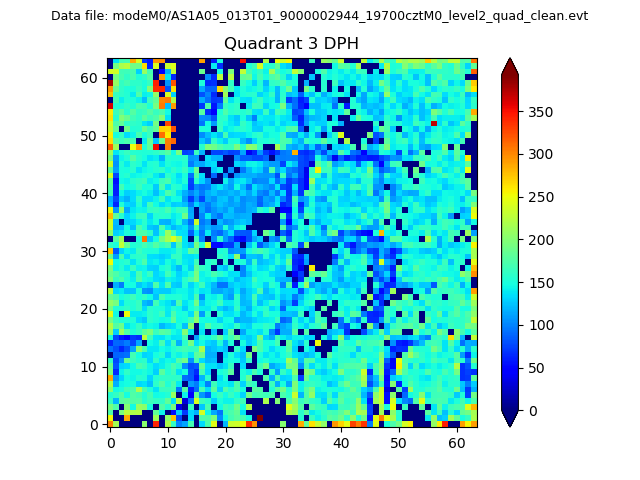 |
 |
Quadrant C |
| Plot type | Count rate plots | Images |
|---|---|---|
| Comparison with Poisson distribution Blue bars denote a histogram of data divided into 1 sec bins. Red curve is a Poisson curve with rate = median count rate of data. |
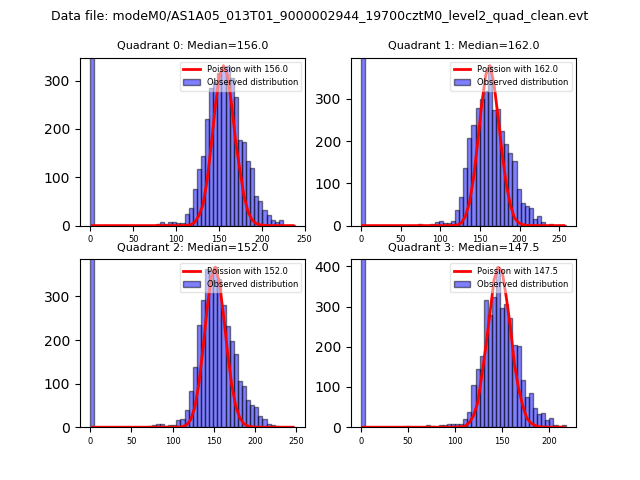 |
 |
| Quadrant-wise count rates Data is divided into 100 sec bins |
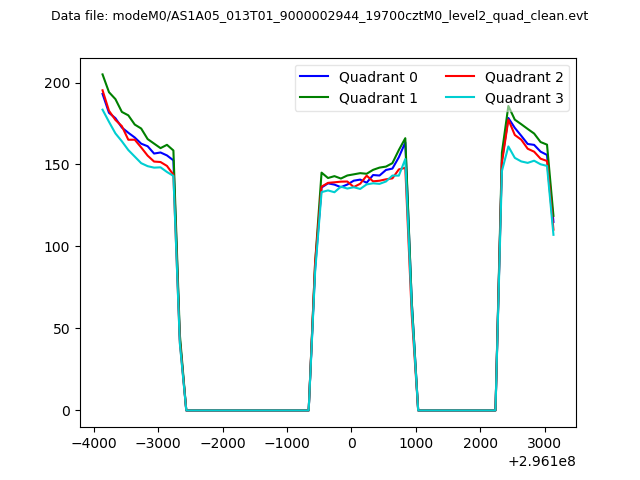 |
|
| Module-wise count rates for Quadrant A Data is divided into 100 sec bins |
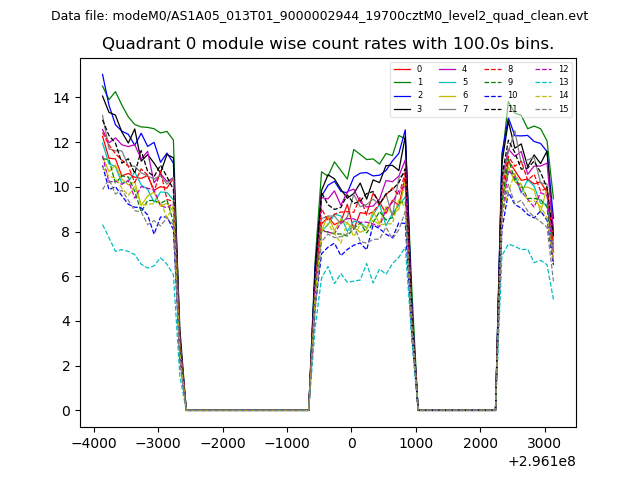 |
 |
| Module-wise count rates for Quadrant B Data is divided into 100 sec bins |
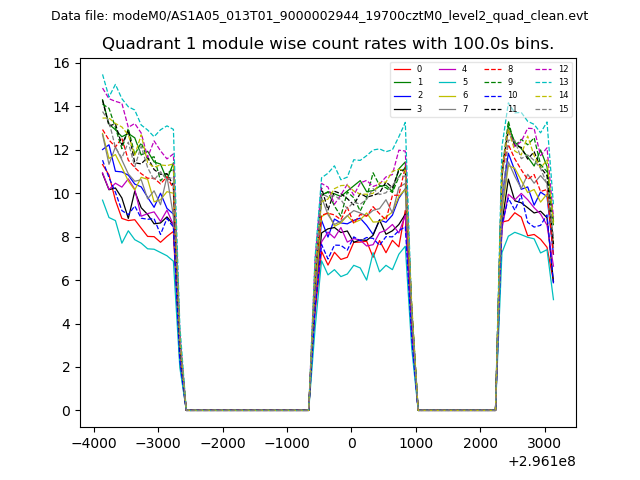 |
 |
| Module-wise count rates for Quadrant C Data is divided into 100 sec bins |
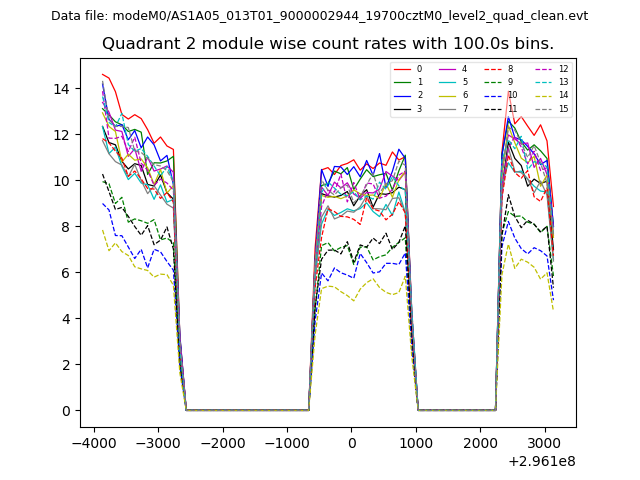 |
 |
| Module-wise count rates for Quadrant D Data is divided into 100 sec bins |
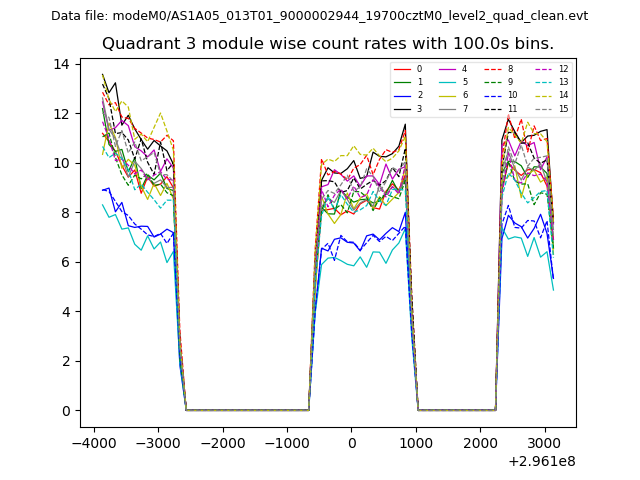 |
 |
| Parameter | Plot |
|---|---|
| CZT HV Monitor | 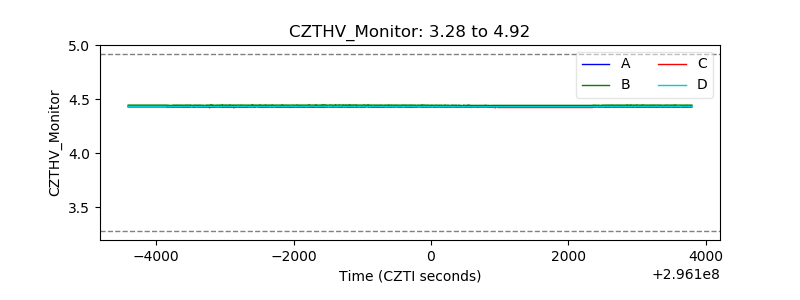 |
| D_VDD | 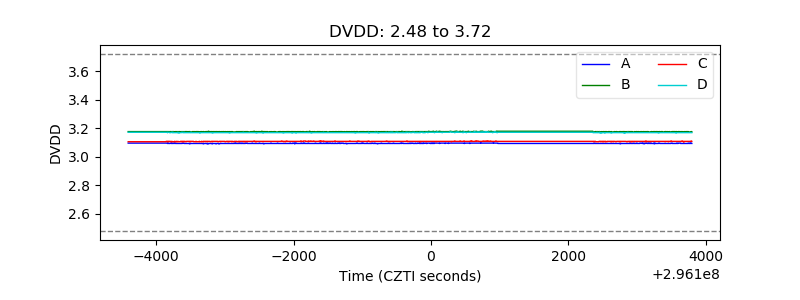 |
| Temperature 1 | 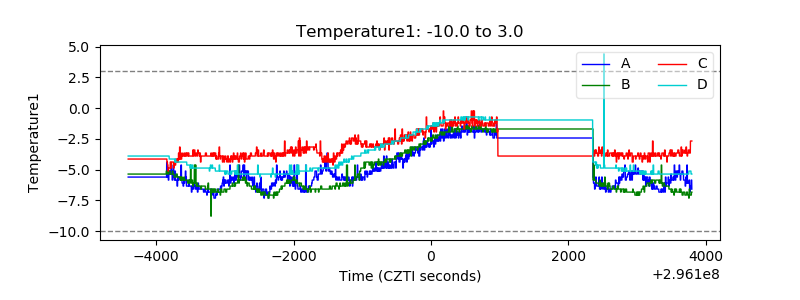 |
| Veto HV Monitor | 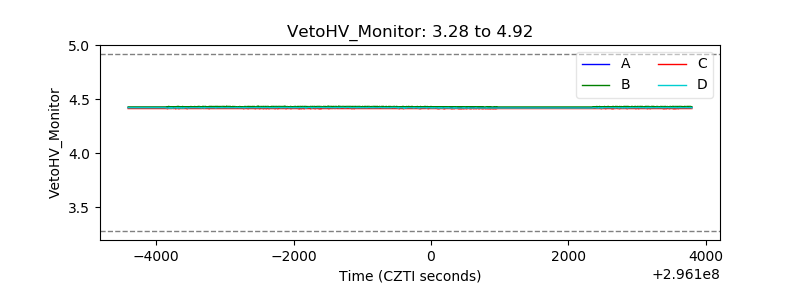 |
| Veto LLD | 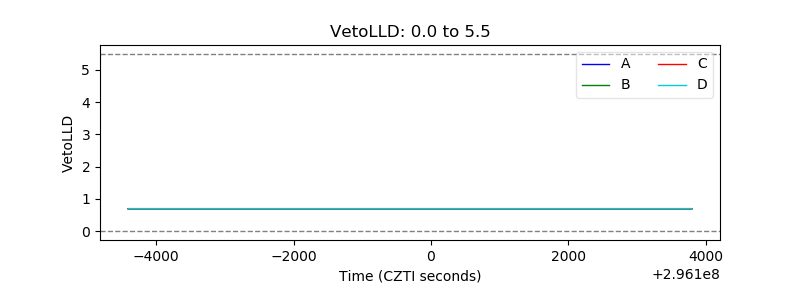 |
| Alpha Counter | 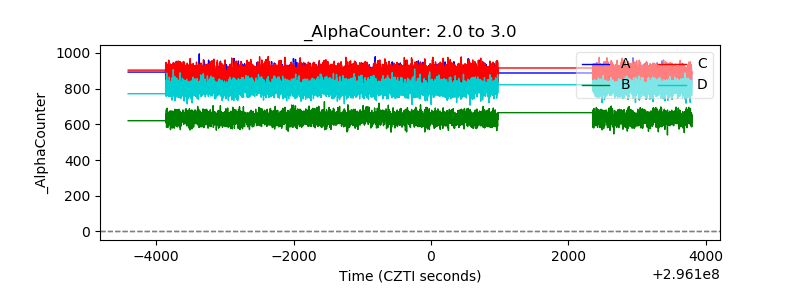 |
| _CPM_Rate | 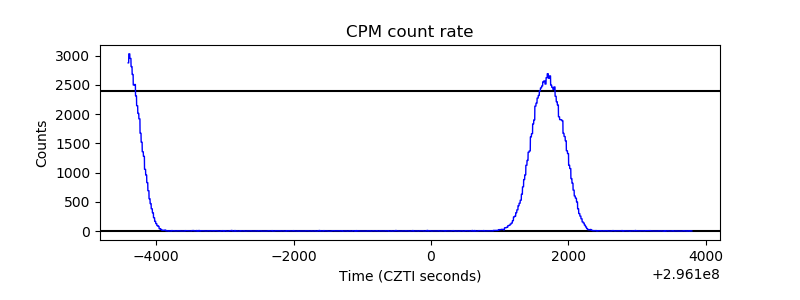 |
| CZT Counter |  |
| +2.5 Volts monitor |  |
| +5 Volts monitor |  |
| _ROLL_ROT | 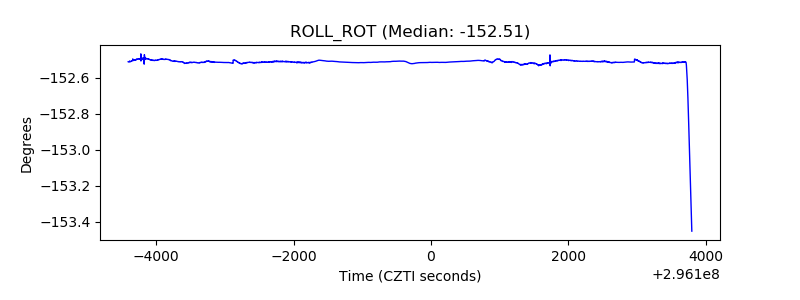 |
| _Roll_DEC | 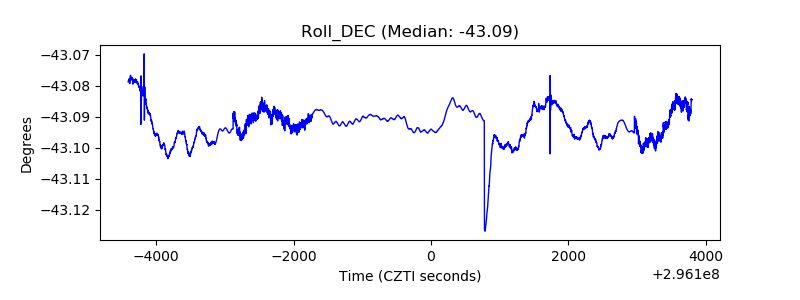 |
| _Roll_RA | 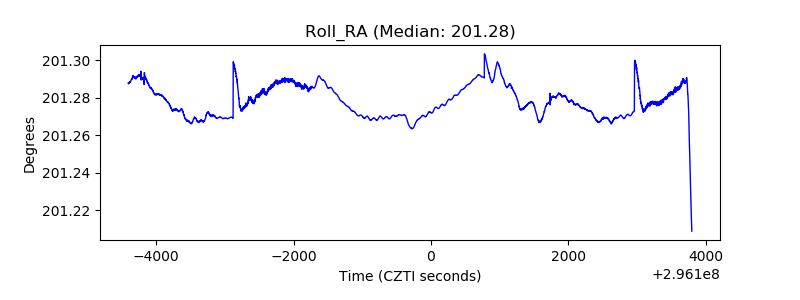 |
| Veto Counter | 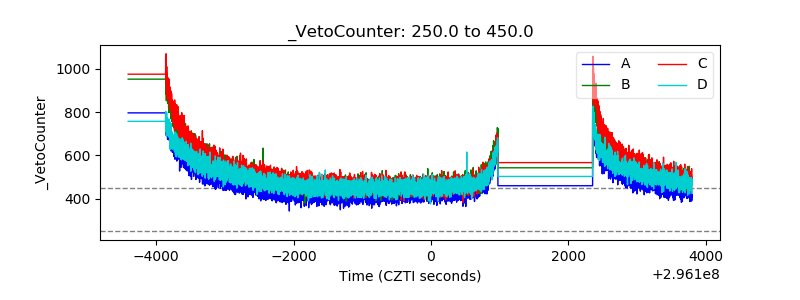 |