| Param | Original file | Final file |
|---|---|---|
| Filename | modeM0/AS1A05_013T01_9000002944_19701cztM0_level2.evt | modeM0/AS1A05_013T01_9000002944_19701cztM0_level2_quad_clean.evt |
| Size (bytes) | 473,169,600 | 79,773,120 |
| Size | 451.2 MB | 76.1 MB |
| Events in quadrant A | 3,259,172 | 495,192 |
| Events in quadrant B | 3,543,849 | 509,360 |
| Events in quadrant C | 3,409,054 | 487,574 |
| Events in quadrant D | 3,674,778 | 468,227 |
| Mode SS | |||
|---|---|---|---|
| Quadrant | BADHDUFLAG | Total packets | Discarded packets |
| A | 0 | 132 | 0 |
| B | 0 | 132 | 0 |
| C | 0 | 132 | 0 |
| D | 0 | 132 | 0 |
| Mode M0 | |||
|---|---|---|---|
| Quadrant | BADHDUFLAG | Total packets | Discarded packets |
| A | 0 | 13641 | 2 |
| B | 0 | 14411 | 2 |
| C | 0 | 13855 | 2 |
| D | 0 | 15043 | 2 |
| Mode M9 | |||
|---|---|---|---|
| Quadrant | BADHDUFLAG | Total packets | Discarded packets |
| A | 0 | 15 | 0 |
| B | 0 | 16 | 0 |
| C | 0 | 16 | 0 |
| D | 0 | 16 | 0 |
| Quadrant | Total seconds | Saturated seconds | Saturation percentage |
|---|---|---|---|
| A | 6528 | 41 | 0.628064% |
| B | 6528 | 72 | 1.102941% |
| C | 6528 | 67 | 1.026348% |
| D | 6528 | 101 | 1.547181% |
Noise dominated data is calculated using 1-second bins in cleaned event files. If a bin has >2000 counts, and if more than 50% of those come from <1% of pixels, then it is considered to be noise-dominated and hence unusable.
| Quadrant | # 1 sec bins | Bins with >0 counts | Bins with >2000 counts | High rate bins dominated by noise | Noise dominated (total time) | Noise dominated (detector-on time) | Marked lightcurve |
|---|---|---|---|---|---|---|---|
| A | 7818 | 6529 | 4 | 4 | 0.05% | 0.06% | 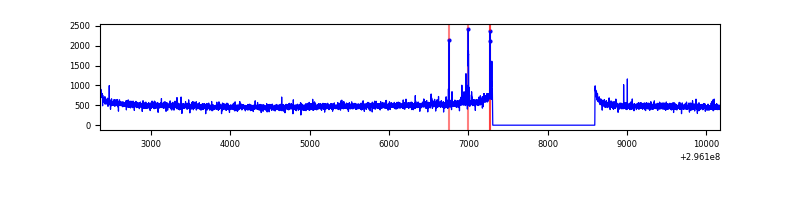 |
| B | 7818 | 6529 | 17 | 17 | 0.22% | 0.26% | 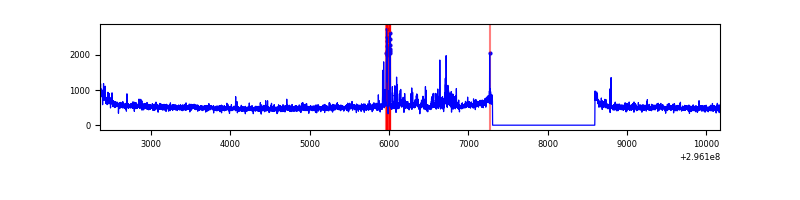 |
| C | 7818 | 6529 | 0 | 0 | 0.00% | 0.00% | 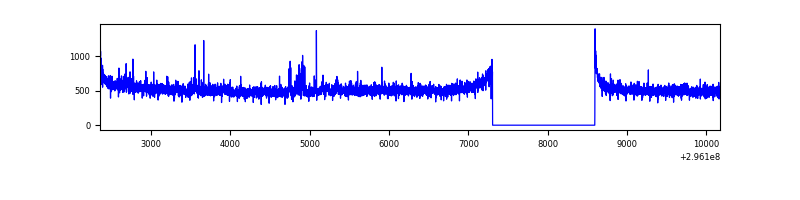 |
| D | 7818 | 6528 | 41 | 41 | 0.52% | 0.63% | 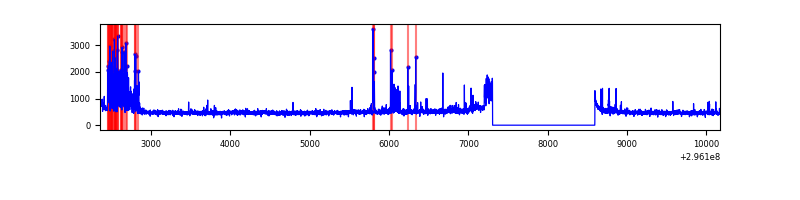 |
Top three noisy pixels from each quadrant. If the there are fewer than three noisy pixels in the level2.evt file, extra rows are filled as -1
| Pixel properties | Quadrant properties | ||||||
|---|---|---|---|---|---|---|---|
| Quadrant | DetID | PixID | Counts | Sigma | Mean | Median | Sigma |
| A | 5 | 16 | 54728 | 324.12 | 832 | 816 | 166.3 |
| A | 0 | 226 | 7315 | 39.07 | 832 | 816 | 166.3 |
| A | 13 | 254 | 6696 | 35.35 | 832 | 816 | 166.3 |
| B | 0 | 189 | 179141 | 1139.57 | 842 | 823 | 156.5 |
| B | 4 | 216 | 29336 | 182.22 | 842 | 823 | 156.5 |
| B | 12 | 111 | 18439 | 112.58 | 842 | 823 | 156.5 |
| C | 14 | 238 | 129784 | 683.18 | 817 | 828 | 188.8 |
| C | 3 | 233 | 82310 | 431.67 | 817 | 828 | 188.8 |
| C | 9 | 221 | 7757 | 36.71 | 817 | 828 | 188.8 |
| D | 2 | 16 | 349214 | 1774.45 | 816 | 796 | 196.4 |
| D | 12 | 218 | 123959 | 627.25 | 816 | 796 | 196.4 |
| D | 1 | 52 | 87070 | 439.38 | 816 | 796 | 196.4 |
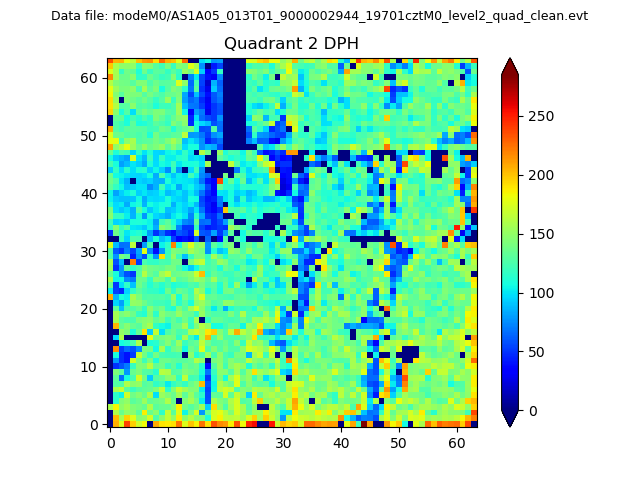
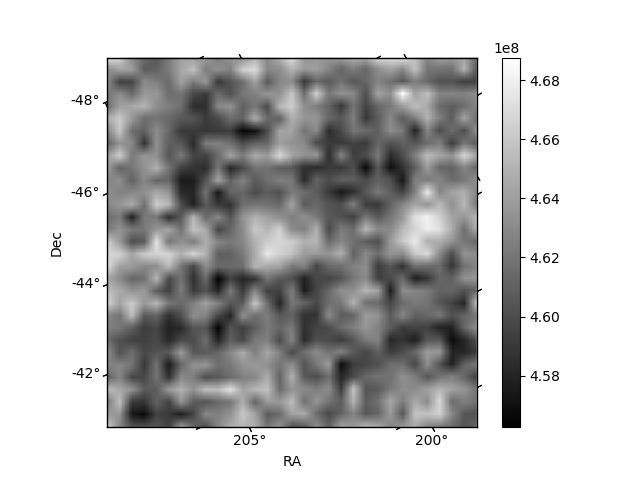
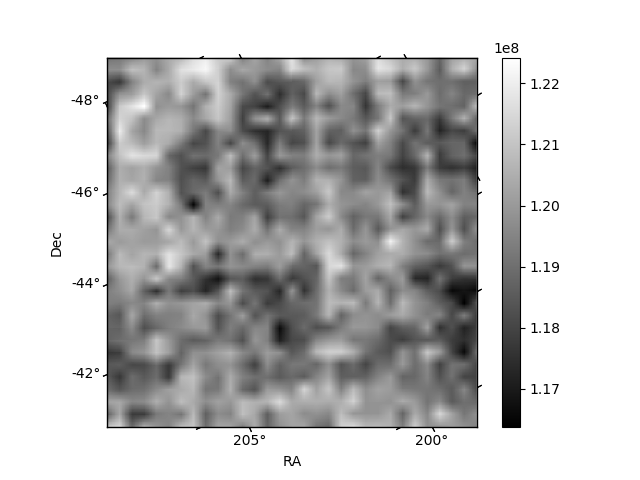
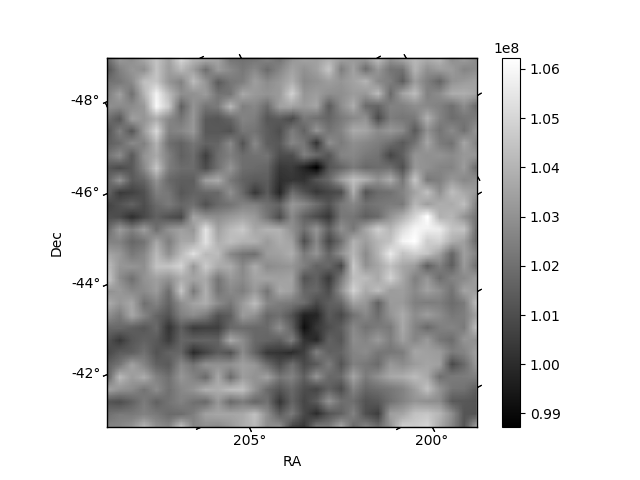
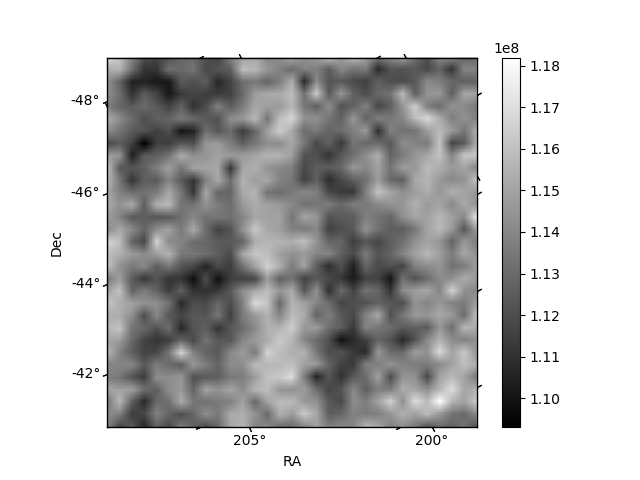
Histogram calculated using DETX and DETY for each event in the final _common_clean file
| Quadrant A | 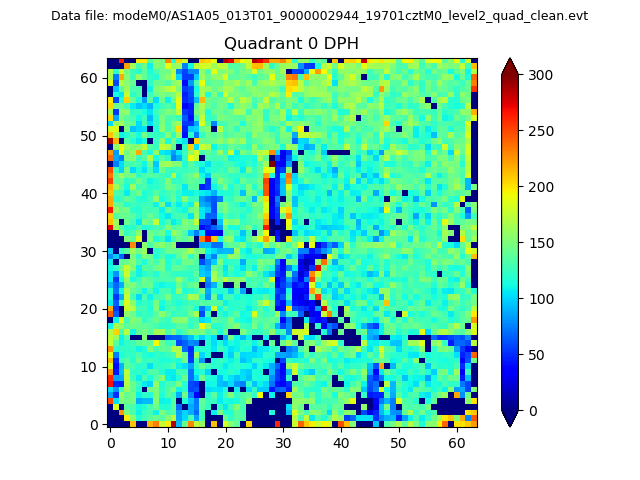 |
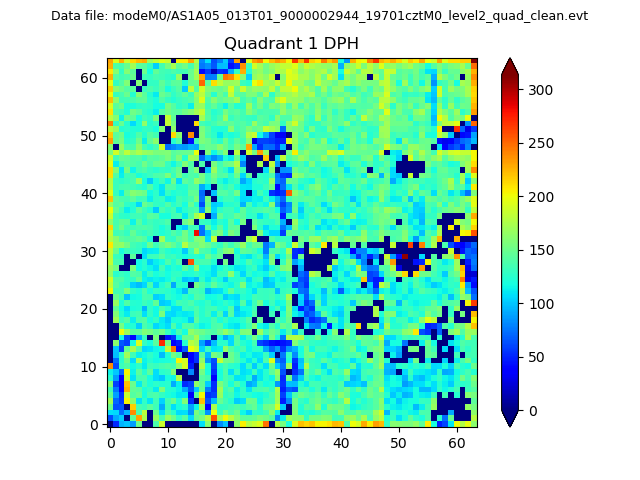 |
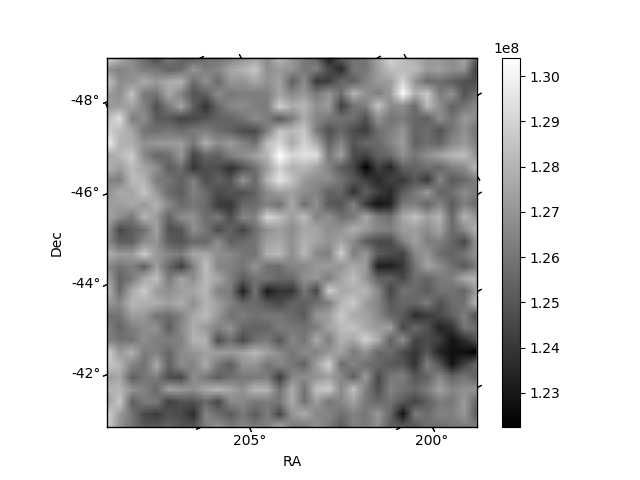
Quadrant B |
|---|---|---|---|
| Quadrant D | 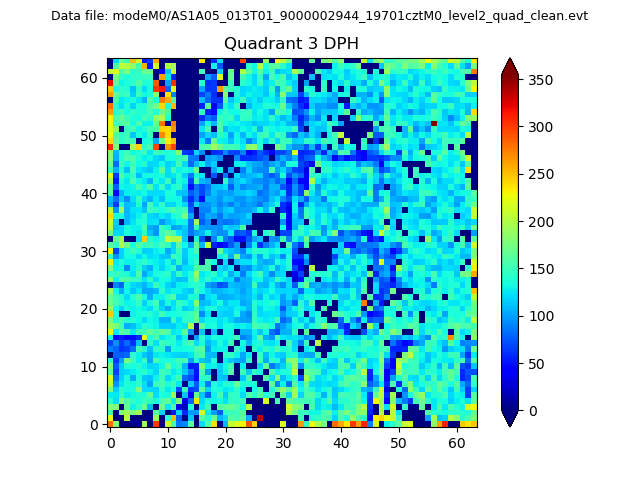 |
 |
Quadrant C |
| Plot type | Count rate plots | Images |
|---|---|---|
| Comparison with Poisson distribution Blue bars denote a histogram of data divided into 1 sec bins. Red curve is a Poisson curve with rate = median count rate of data. |
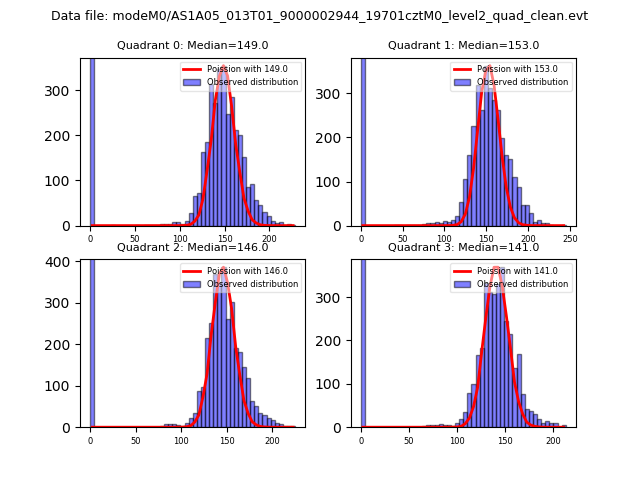 |
 |
| Quadrant-wise count rates Data is divided into 100 sec bins |
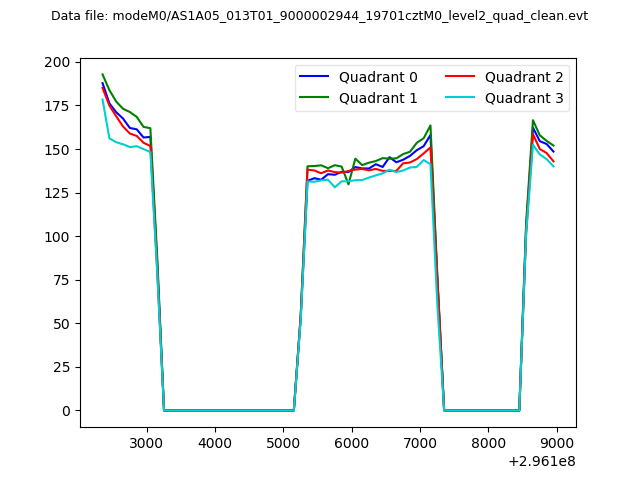 |
|
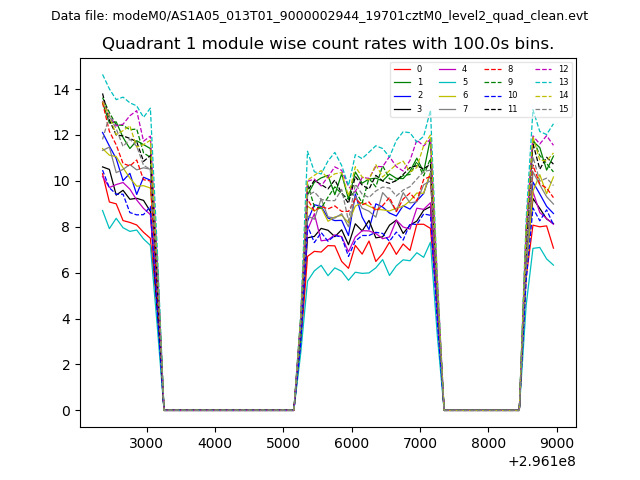
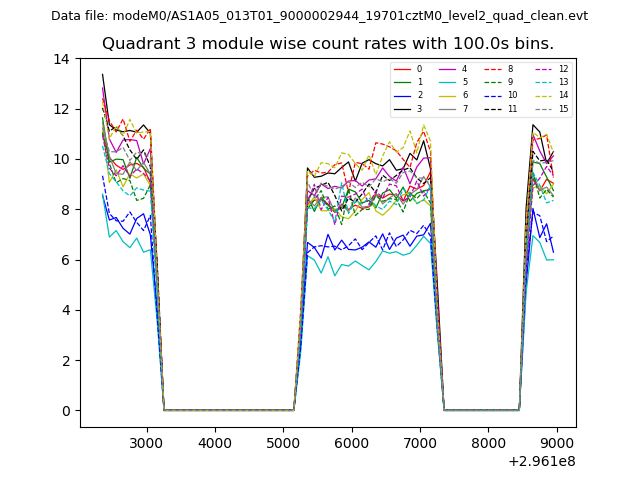
| Module-wise count rates for Quadrant A Data is divided into 100 sec bins |
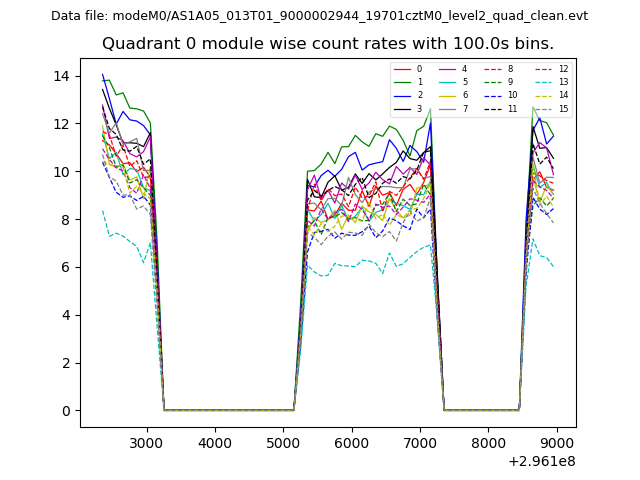 |
 |
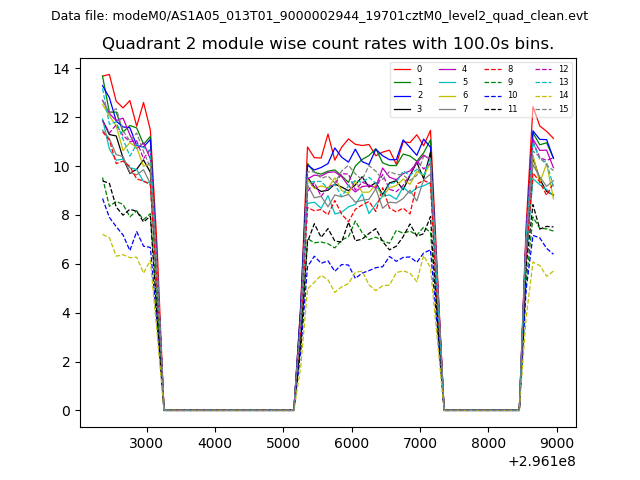
| Module-wise count rates for Quadrant B Data is divided into 100 sec bins |
 |
 |
| Module-wise count rates for Quadrant C Data is divided into 100 sec bins |
 |
 |
| Module-wise count rates for Quadrant D Data is divided into 100 sec bins |
 |
 |
| Parameter | Plot |
|---|---|
| CZT HV Monitor |  |
| D_VDD | 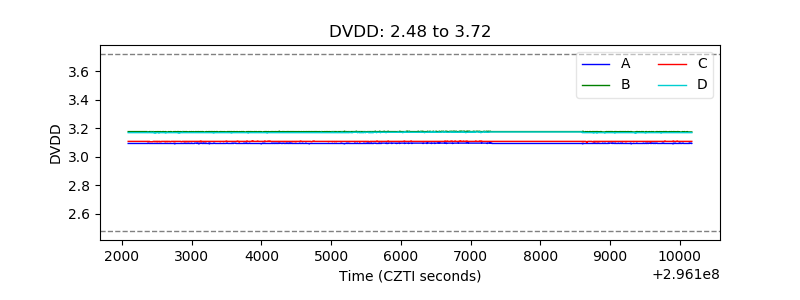 |
| Temperature 1 | 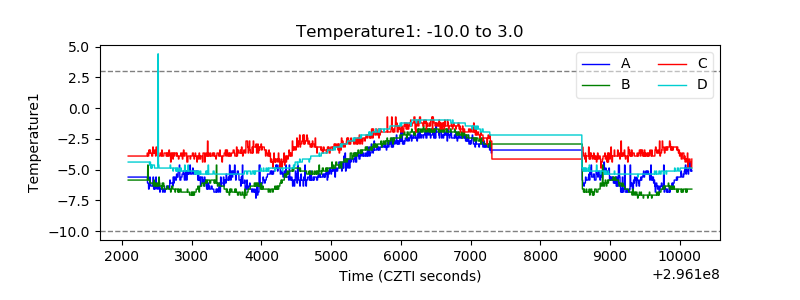 |
| Veto HV Monitor | 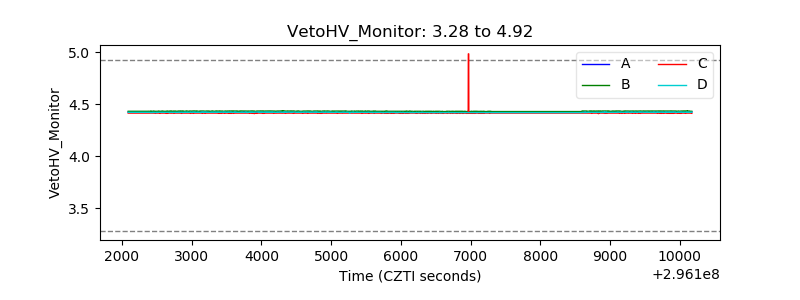 |
| Veto LLD | 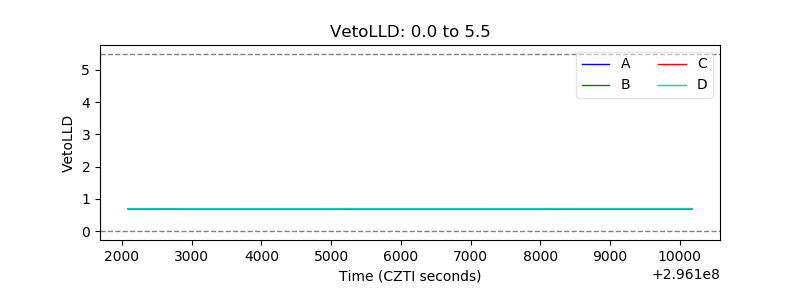 |
| Alpha Counter | 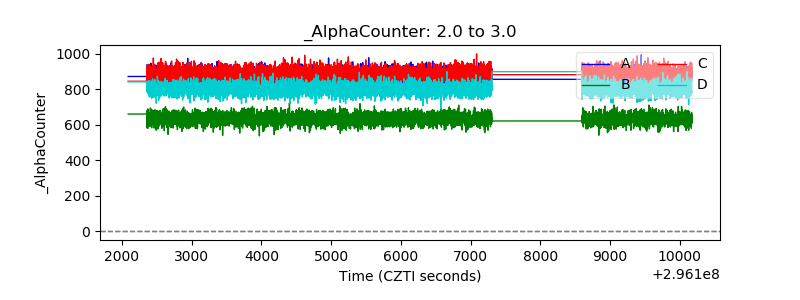 |
| _CPM_Rate | 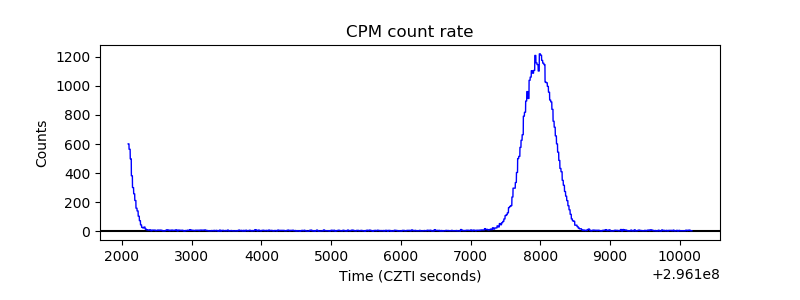 |
| CZT Counter | 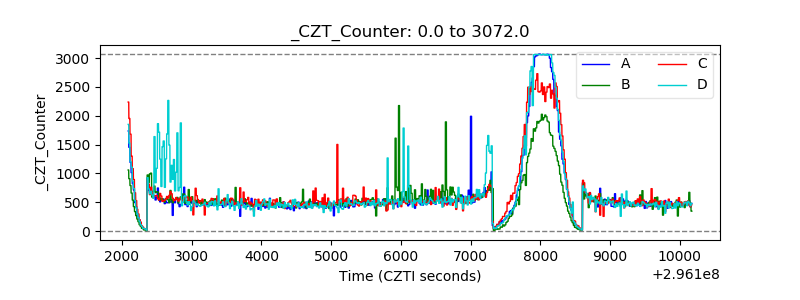 |
| +2.5 Volts monitor | 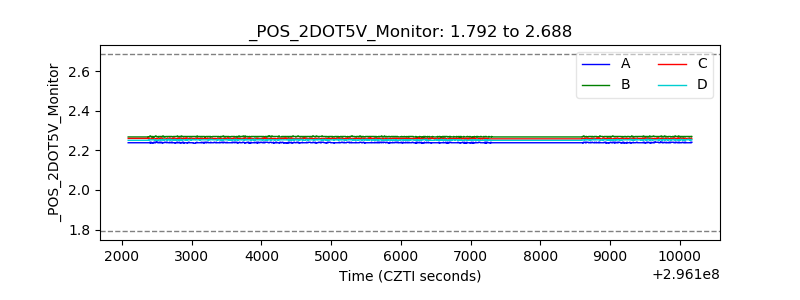 |
| +5 Volts monitor |  |
| _ROLL_ROT | 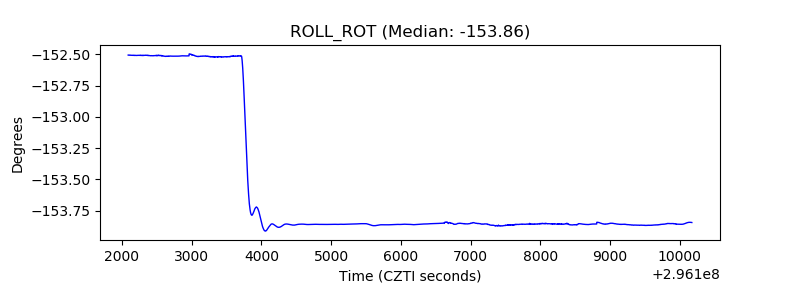 |
| _Roll_DEC | 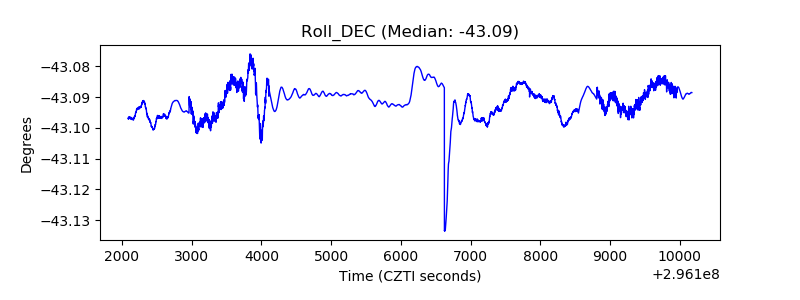 |
| _Roll_RA | 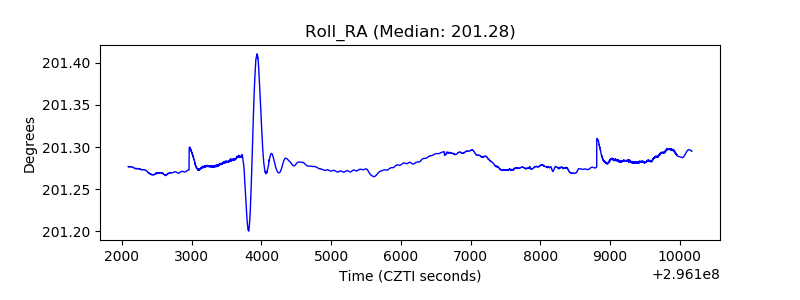 |
| Veto Counter |  |