| Param | Original file | Final file |
|---|---|---|
| Filename | modeM0/AS1A05_013T01_9000002944_19703cztM0_level2.evt | modeM0/AS1A05_013T01_9000002944_19703cztM0_level2_quad_clean.evt |
| Size (bytes) | 842,624,640 | 138,182,400 |
| Size | 803.6 MB | 131.8 MB |
| Events in quadrant A | 5,945,658 | 846,958 |
| Events in quadrant B | 6,163,016 | 859,276 |
| Events in quadrant C | 6,167,679 | 822,750 |
| Events in quadrant D | 6,415,540 | 811,350 |
| Mode SS | |||
|---|---|---|---|
| Quadrant | BADHDUFLAG | Total packets | Discarded packets |
| A | 0 | 248 | 0 |
| B | 0 | 248 | 0 |
| C | 0 | 248 | 0 |
| D | 0 | 248 | 0 |
| Mode M0 | |||
|---|---|---|---|
| Quadrant | BADHDUFLAG | Total packets | Discarded packets |
| A | 0 | 25478 | 2 |
| B | 0 | 25726 | 2 |
| C | 0 | 25476 | 2 |
| D | 0 | 26974 | 2 |
| Mode M9 | |||
|---|---|---|---|
| Quadrant | BADHDUFLAG | Total packets | Discarded packets |
| A | 0 | 14 | 0 |
| B | 0 | 14 | 0 |
| C | 0 | 14 | 0 |
| D | 0 | 14 | 0 |
| Quadrant | Total seconds | Saturated seconds | Saturation percentage |
|---|---|---|---|
| A | 12210 | 225 | 1.842752% |
| B | 12210 | 251 | 2.055692% |
| C | 12210 | 306 | 2.506143% |
| D | 12211 | 290 | 2.374908% |
Noise dominated data is calculated using 1-second bins in cleaned event files. If a bin has >2000 counts, and if more than 50% of those come from <1% of pixels, then it is considered to be noise-dominated and hence unusable.
| Quadrant | # 1 sec bins | Bins with >0 counts | Bins with >2000 counts | High rate bins dominated by noise | Noise dominated (total time) | Noise dominated (detector-on time) | Marked lightcurve |
|---|---|---|---|---|---|---|---|
| A | 13625 | 12210 | 8 | 8 | 0.06% | 0.07% | 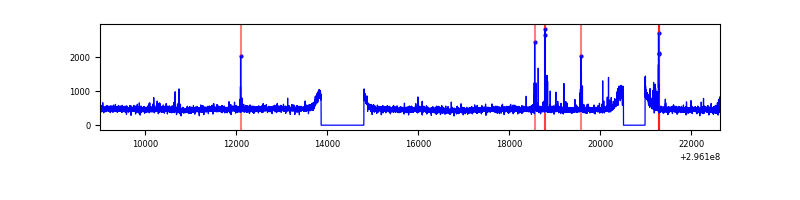 |
| B | 13625 | 12210 | 6 | 6 | 0.04% | 0.05% | 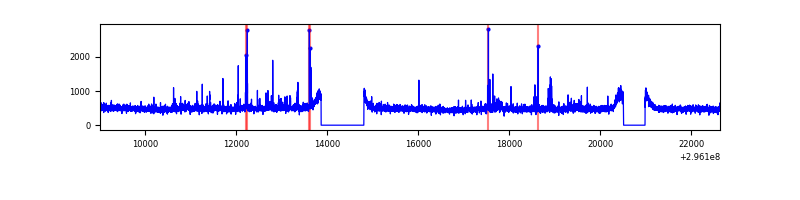 |
| C | 13625 | 12210 | 0 | 0 | 0.00% | 0.00% | 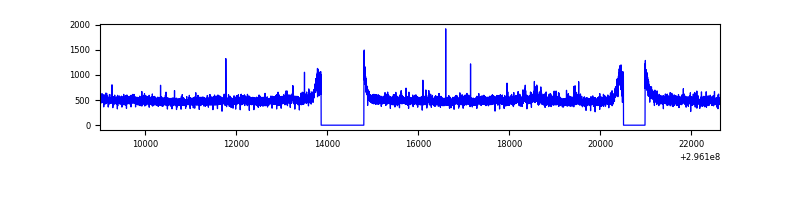 |
| D | 13626 | 12211 | 79 | 79 | 0.58% | 0.65% | 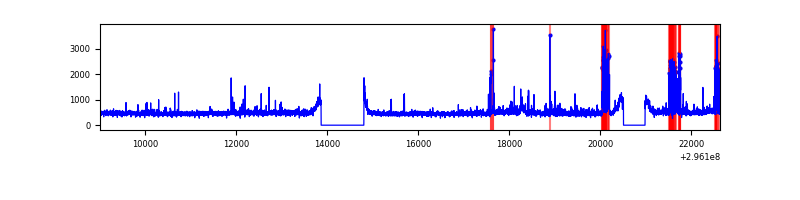 |
Top three noisy pixels from each quadrant. If the there are fewer than three noisy pixels in the level2.evt file, extra rows are filled as -1
| Pixel properties | Quadrant properties | ||||||
|---|---|---|---|---|---|---|---|
| Quadrant | DetID | PixID | Counts | Sigma | Mean | Median | Sigma |
| A | 5 | 16 | 125371 | 406.19 | 1512 | 1481 | 305.0 |
| A | 0 | 226 | 13120 | 38.16 | 1512 | 1481 | 305.0 |
| A | 3 | 137 | 12088 | 34.78 | 1512 | 1481 | 305.0 |
| B | 4 | 216 | 66471 | 226.95 | 1510 | 1477 | 286.4 |
| B | 0 | 198 | 57106 | 194.25 | 1510 | 1477 | 286.4 |
| B | 12 | 111 | 34850 | 116.53 | 1510 | 1477 | 286.4 |
| C | 3 | 233 | 249603 | 736.23 | 1454 | 1464 | 337.0 |
| C | 14 | 238 | 226767 | 668.47 | 1454 | 1464 | 337.0 |
| C | 7 | 247 | 12072 | 31.47 | 1454 | 1464 | 337.0 |
| D | 2 | 16 | 451230 | 1272.02 | 1472 | 1432 | 353.6 |
| D | 1 | 52 | 329308 | 927.23 | 1472 | 1432 | 353.6 |
| D | 2 | 234 | 46330 | 126.97 | 1472 | 1432 | 353.6 |
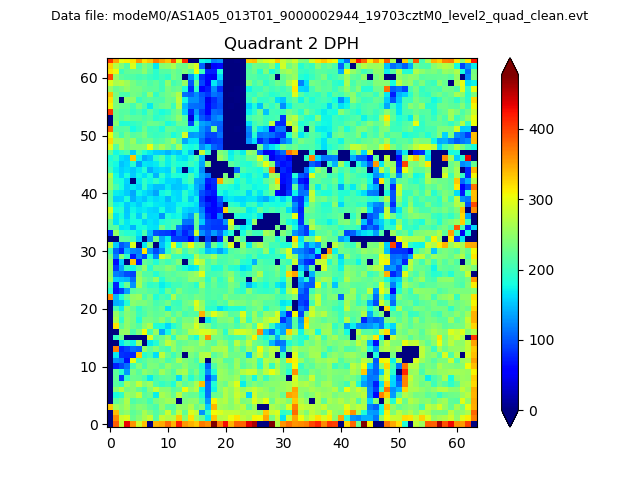
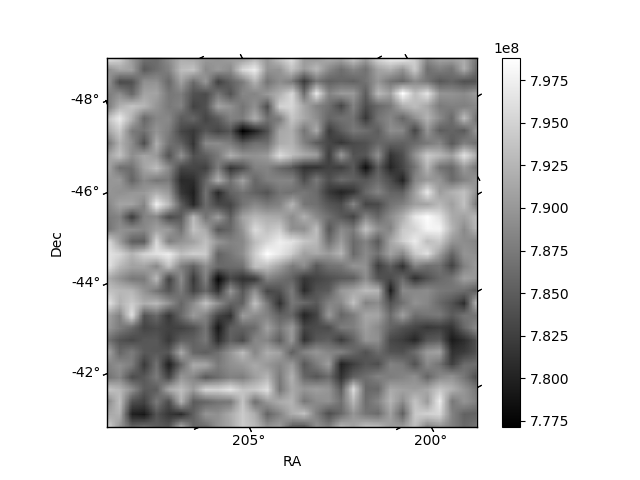
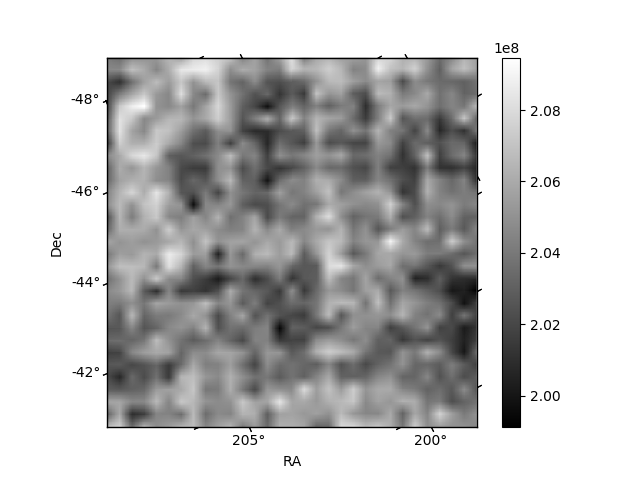
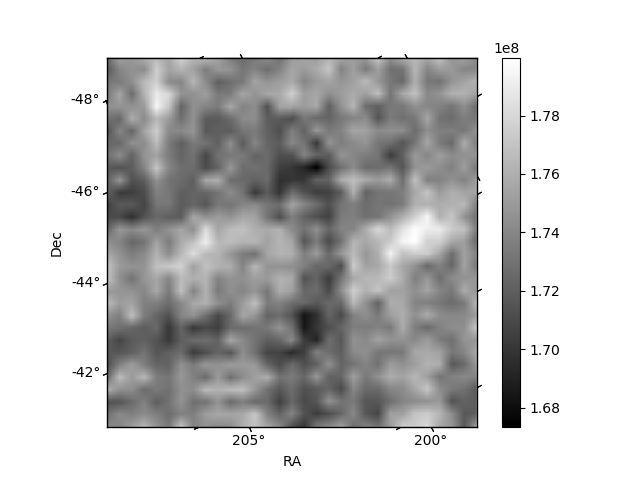
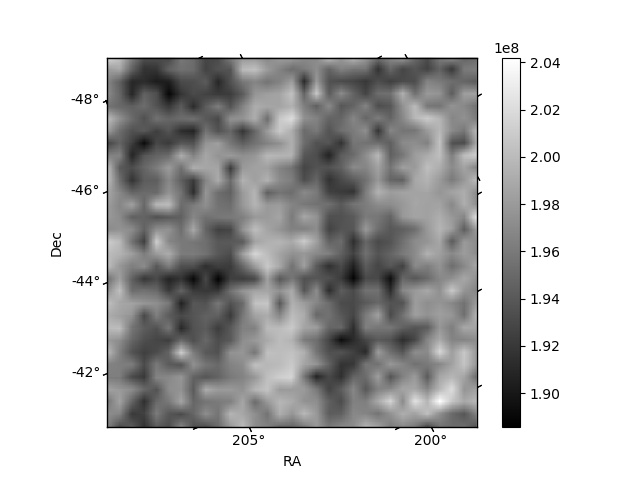
Histogram calculated using DETX and DETY for each event in the final _common_clean file
| Quadrant A | 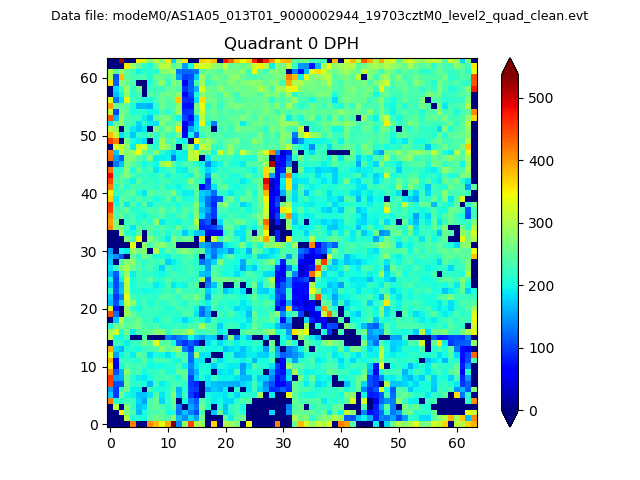 |
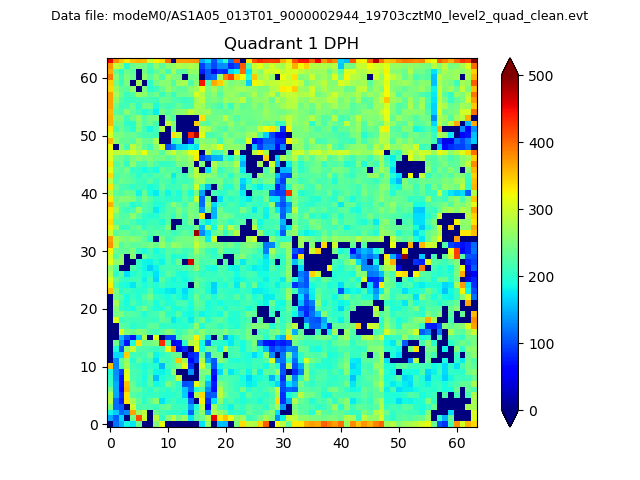 |
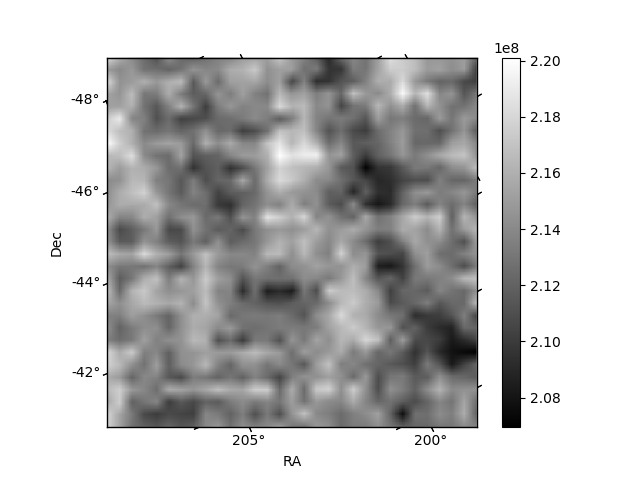
Quadrant B |
|---|---|---|---|
| Quadrant D | 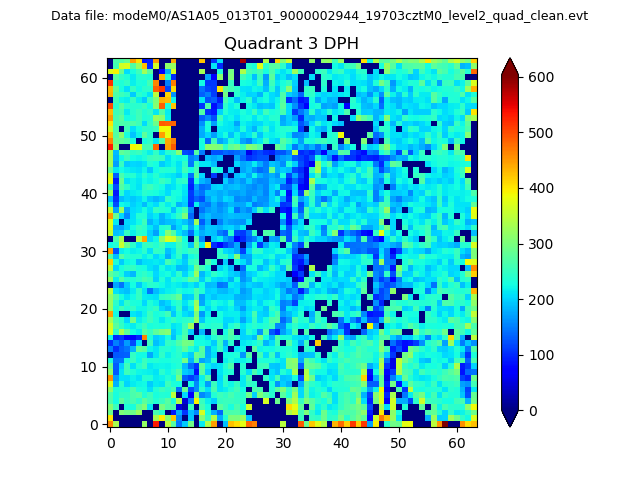 |
 |
Quadrant C |
| Plot type | Count rate plots | Images |
|---|---|---|
| Comparison with Poisson distribution Blue bars denote a histogram of data divided into 1 sec bins. Red curve is a Poisson curve with rate = median count rate of data. |
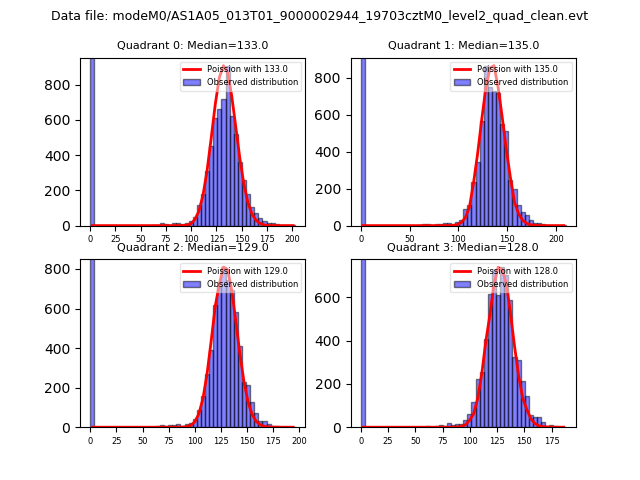 |
 |
| Quadrant-wise count rates Data is divided into 100 sec bins |
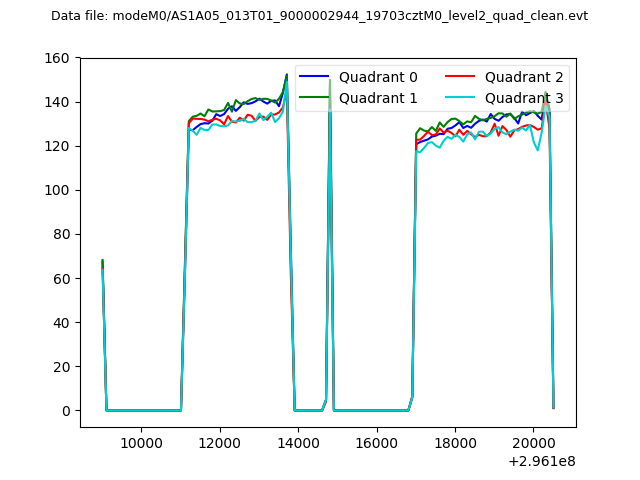 |
|
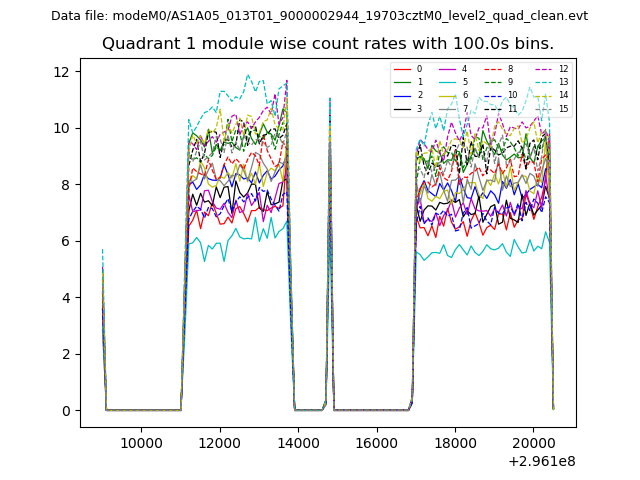
| Module-wise count rates for Quadrant A Data is divided into 100 sec bins |
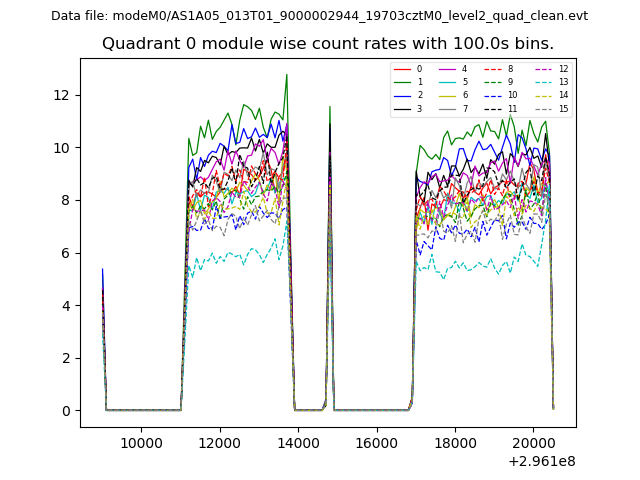 |
 |
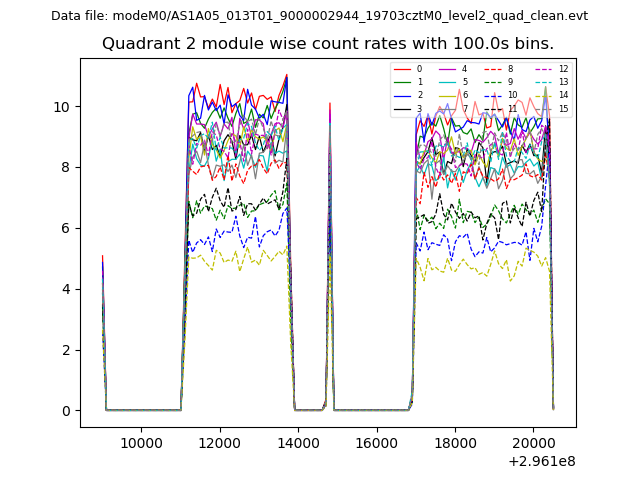
| Module-wise count rates for Quadrant B Data is divided into 100 sec bins |
 |
 |
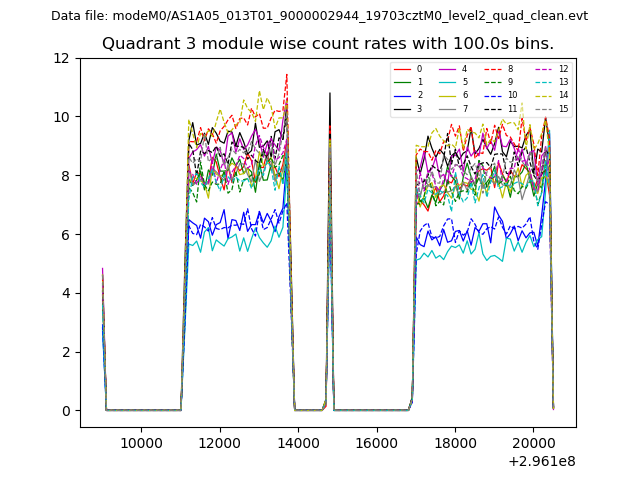
| Module-wise count rates for Quadrant C Data is divided into 100 sec bins |
 |
 |
| Module-wise count rates for Quadrant D Data is divided into 100 sec bins |
 |
 |
| Parameter | Plot |
|---|---|
| CZT HV Monitor | 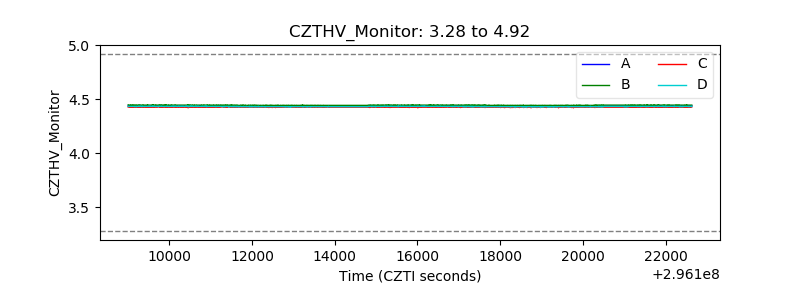 |
| D_VDD | 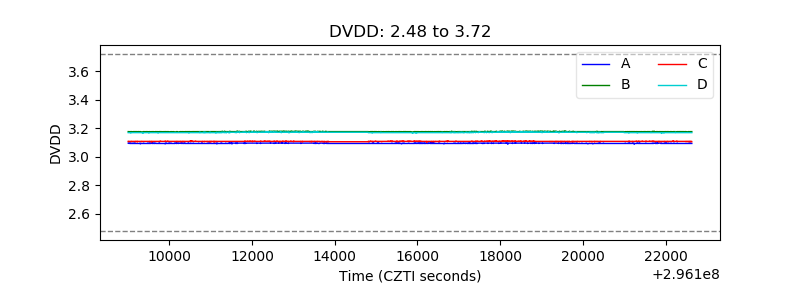 |
| Temperature 1 | 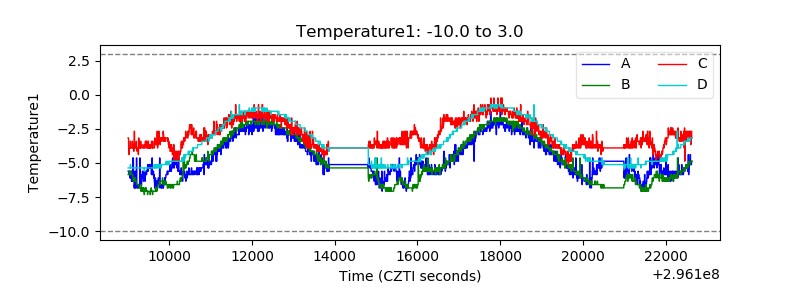 |
| Veto HV Monitor | 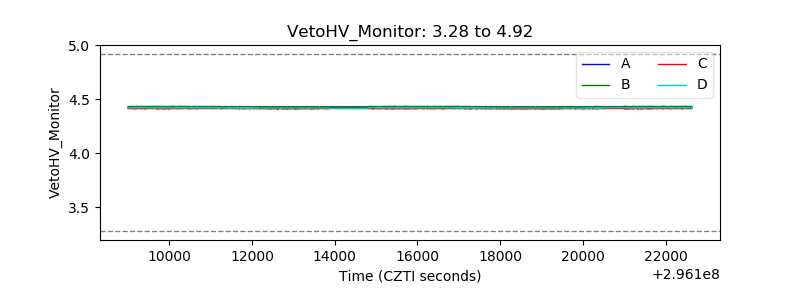 |
| Veto LLD | 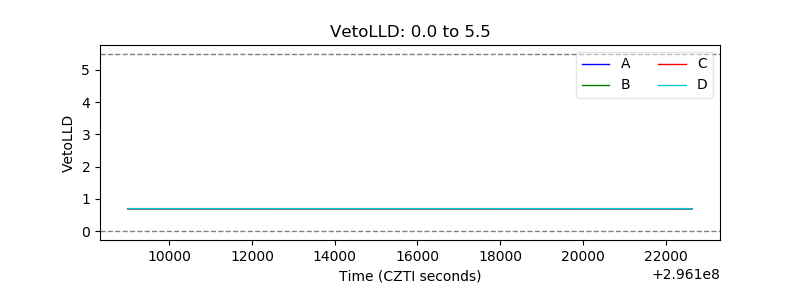 |
| Alpha Counter | 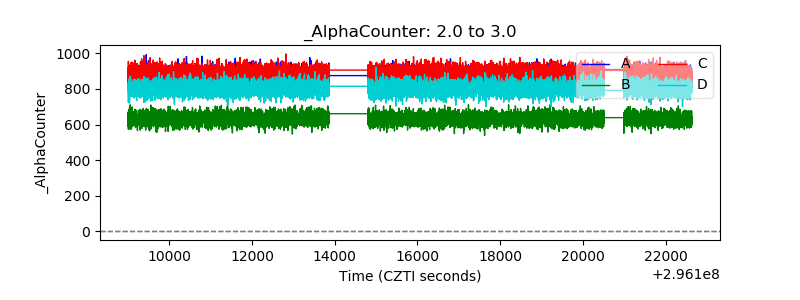 |
| _CPM_Rate | 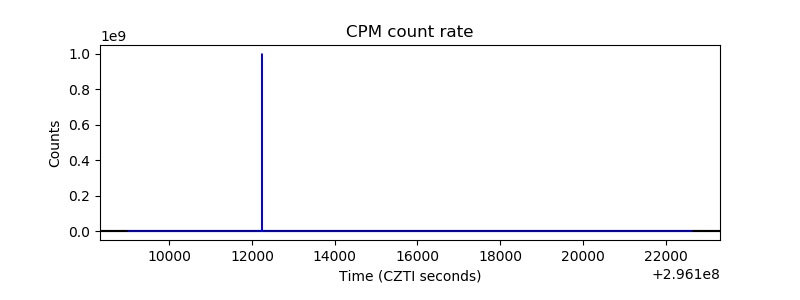 |
| CZT Counter | 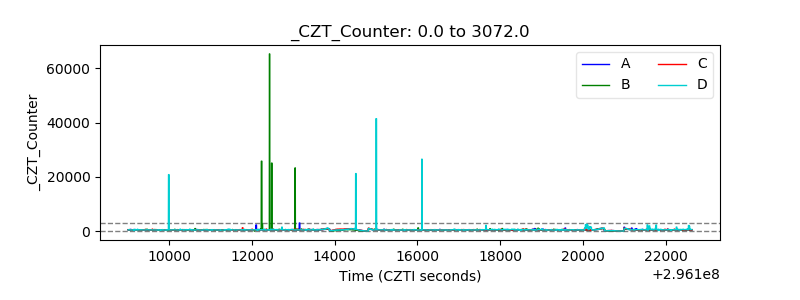 |
| +2.5 Volts monitor |  |
| +5 Volts monitor |  |
| _ROLL_ROT | 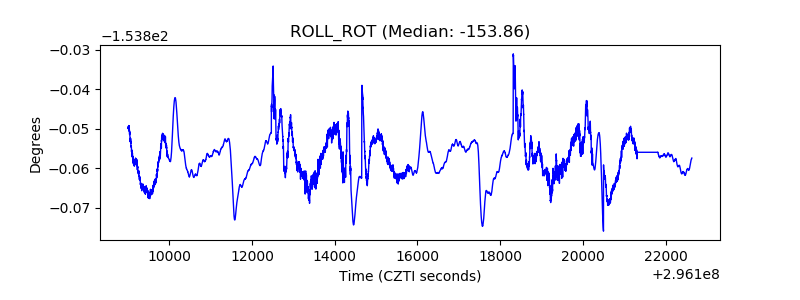 |
| _Roll_DEC | 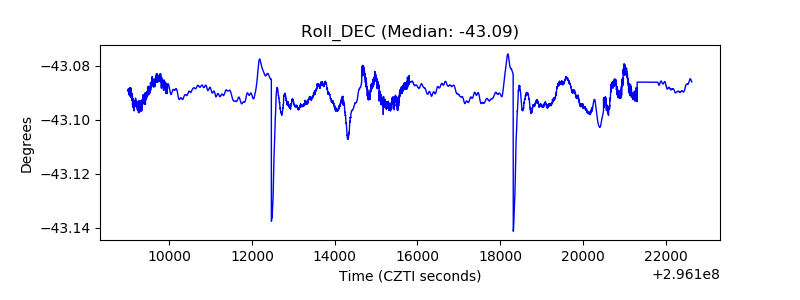 |
| _Roll_RA | 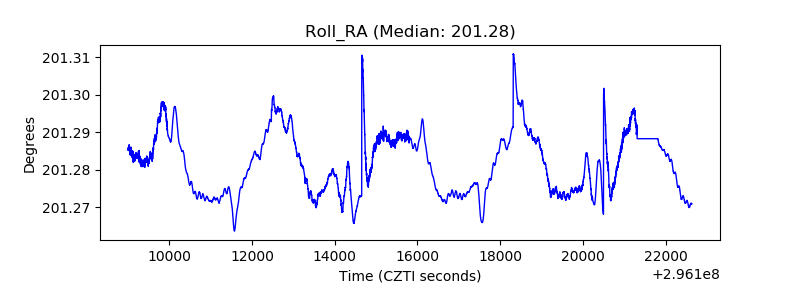 |
| Veto Counter | 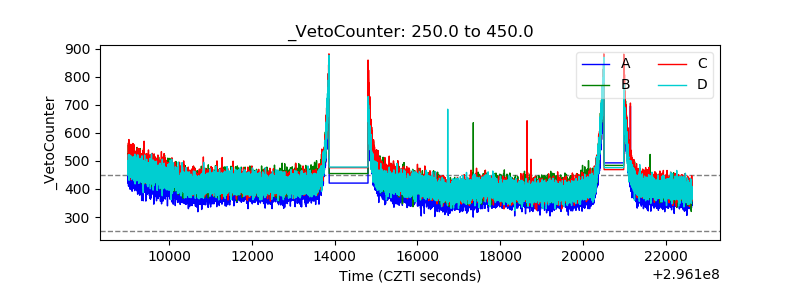 |