| Param | Original file | Final file |
|---|---|---|
| Filename | modeM0/AS1A05_013T01_9000002944_19704cztM0_level2.evt | modeM0/AS1A05_013T01_9000002944_19704cztM0_level2_quad_clean.evt |
| Size (bytes) | 657,092,160 | 99,912,960 |
| Size | 626.7 MB | 95.3 MB |
| Events in quadrant A | 4,432,182 | 616,540 |
| Events in quadrant B | 4,643,549 | 622,806 |
| Events in quadrant C | 4,525,488 | 595,623 |
| Events in quadrant D | 5,701,429 | 579,339 |
| Mode SS | |||
|---|---|---|---|
| Quadrant | BADHDUFLAG | Total packets | Discarded packets |
| A | 0 | 180 | 0 |
| B | 0 | 180 | 0 |
| C | 0 | 180 | 0 |
| D | 0 | 180 | 0 |
| Mode M0 | |||
|---|---|---|---|
| Quadrant | BADHDUFLAG | Total packets | Discarded packets |
| A | 0 | 18962 | 1 |
| B | 0 | 19319 | 1 |
| C | 0 | 18847 | 1 |
| D | 0 | 22866 | 1 |
| Mode M9 | |||
|---|---|---|---|
| Quadrant | BADHDUFLAG | Total packets | Discarded packets |
| A | 0 | 4 | 0 |
| B | 0 | 4 | 0 |
| C | 0 | 4 | 0 |
| D | 0 | 4 | 0 |
| Quadrant | Total seconds | Saturated seconds | Saturation percentage |
|---|---|---|---|
| A | 8796 | 439 | 4.990905% |
| B | 8797 | 490 | 5.570081% |
| C | 8797 | 488 | 5.547346% |
| D | 8797 | 657 | 7.468455% |
Noise dominated data is calculated using 1-second bins in cleaned event files. If a bin has >2000 counts, and if more than 50% of those come from <1% of pixels, then it is considered to be noise-dominated and hence unusable.
| Quadrant | # 1 sec bins | Bins with >0 counts | Bins with >2000 counts | High rate bins dominated by noise | Noise dominated (total time) | Noise dominated (detector-on time) | Marked lightcurve |
|---|---|---|---|---|---|---|---|
| A | 9271 | 8796 | 17 | 17 | 0.18% | 0.19% | 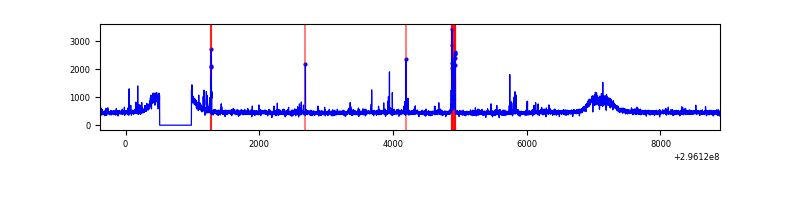 |
| B | 9272 | 8797 | 40 | 40 | 0.43% | 0.45% | 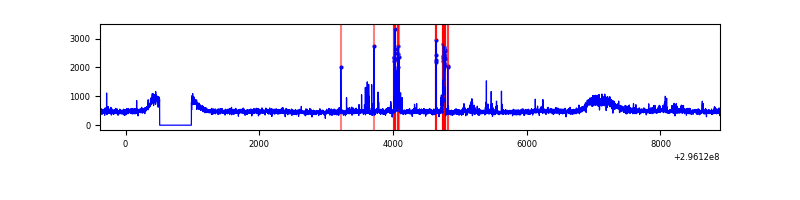 |
| C | 9272 | 8797 | 0 | 0 | 0.00% | 0.00% | 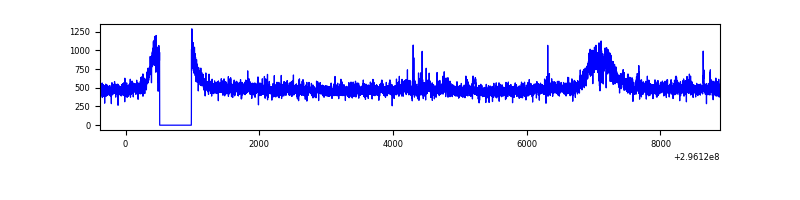 |
| D | 9272 | 8797 | 248 | 248 | 2.67% | 2.82% | 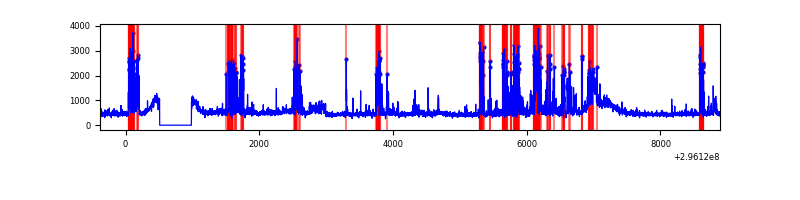 |
Top three noisy pixels from each quadrant. If the there are fewer than three noisy pixels in the level2.evt file, extra rows are filled as -1
| Pixel properties | Quadrant properties | ||||||
|---|---|---|---|---|---|---|---|
| Quadrant | DetID | PixID | Counts | Sigma | Mean | Median | Sigma |
| A | 5 | 16 | 150332 | 657.07 | 1112 | 1088 | 227.1 |
| A | 0 | 226 | 9644 | 37.67 | 1112 | 1088 | 227.1 |
| A | 3 | 137 | 9356 | 36.4 | 1112 | 1088 | 227.1 |
| B | 4 | 216 | 102897 | 478.97 | 1104 | 1074 | 212.6 |
| B | 3 | 64 | 82530 | 383.16 | 1104 | 1074 | 212.6 |
| B | 0 | 198 | 75358 | 349.43 | 1104 | 1074 | 212.6 |
| C | 3 | 233 | 183910 | 728.81 | 1067 | 1074 | 250.9 |
| C | 14 | 238 | 164325 | 650.74 | 1067 | 1074 | 250.9 |
| C | 9 | 221 | 12562 | 45.79 | 1067 | 1074 | 250.9 |
| D | 1 | 52 | 1235672 | 4735.16 | 1069 | 1035 | 260.7 |
| D | 2 | 16 | 339216 | 1297.01 | 1069 | 1035 | 260.7 |
| D | 2 | 234 | 37142 | 138.48 | 1069 | 1035 | 260.7 |
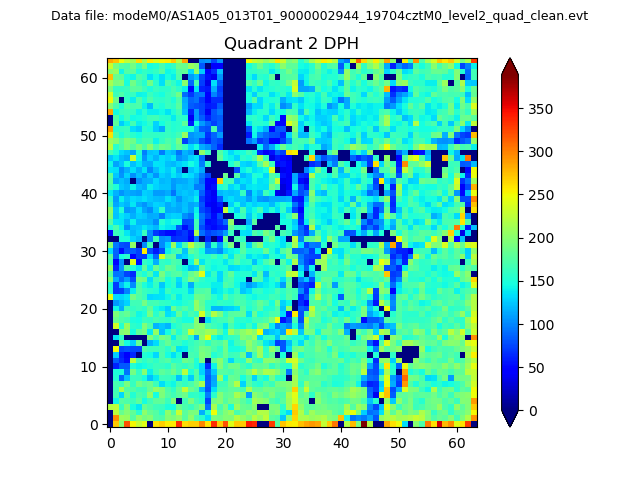
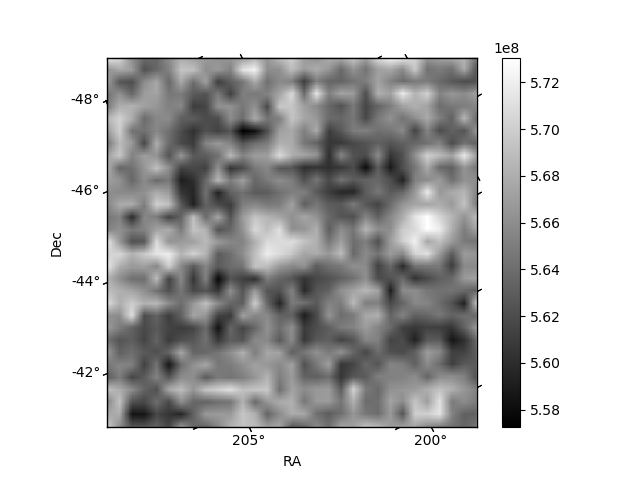
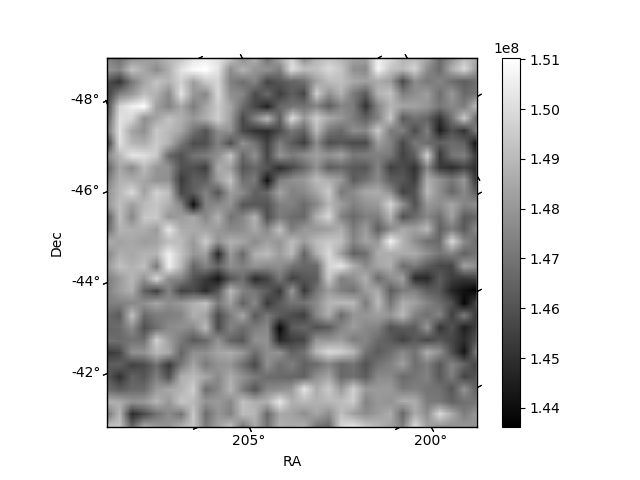
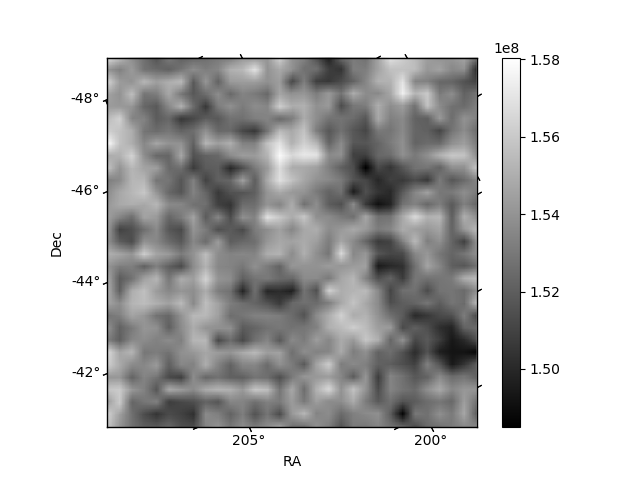
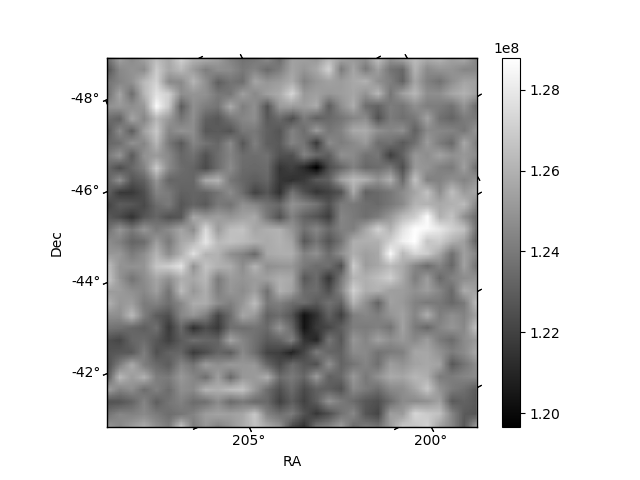
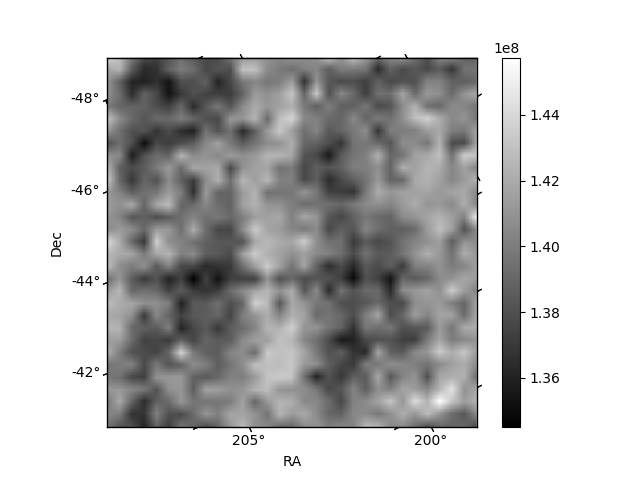
Histogram calculated using DETX and DETY for each event in the final _common_clean file
| Quadrant A | 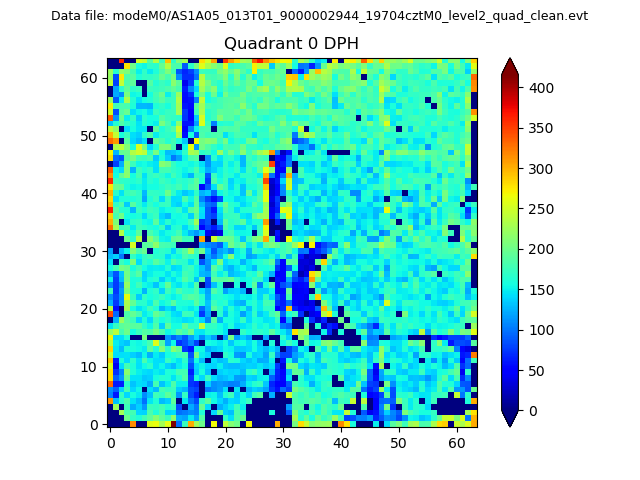 |
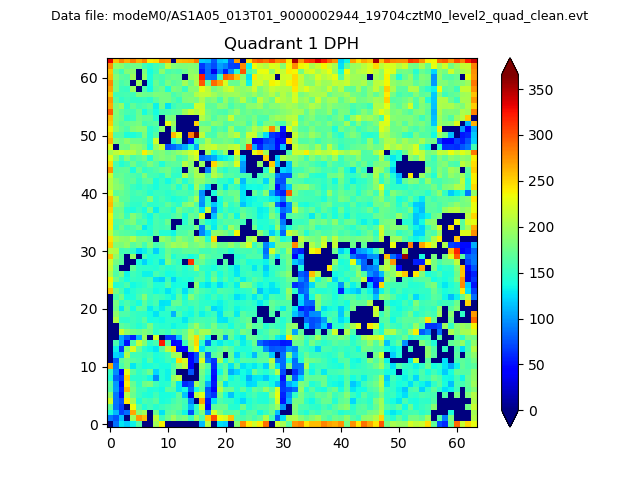 |
Quadrant B |
|---|---|---|---|
| Quadrant D | 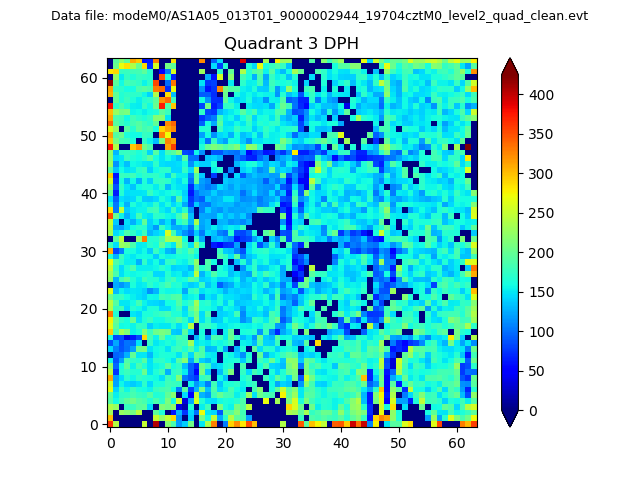 |
 |
Quadrant C |
| Plot type | Count rate plots | Images |
|---|---|---|
| Comparison with Poisson distribution Blue bars denote a histogram of data divided into 1 sec bins. Red curve is a Poisson curve with rate = median count rate of data. |
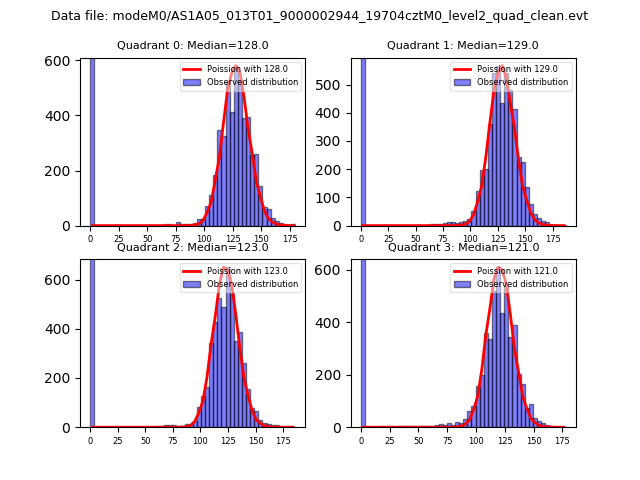 |
 |
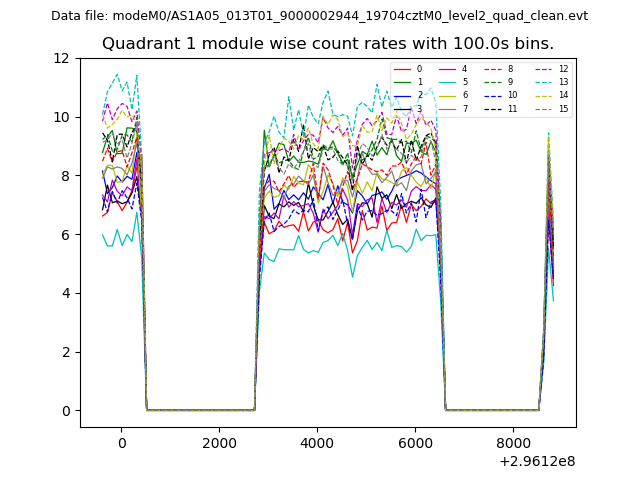
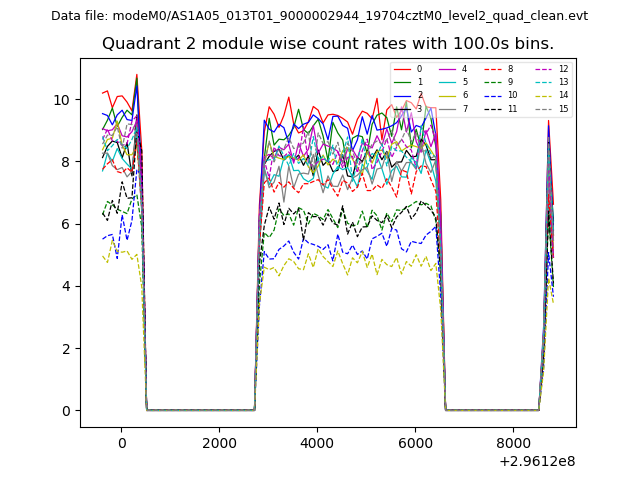
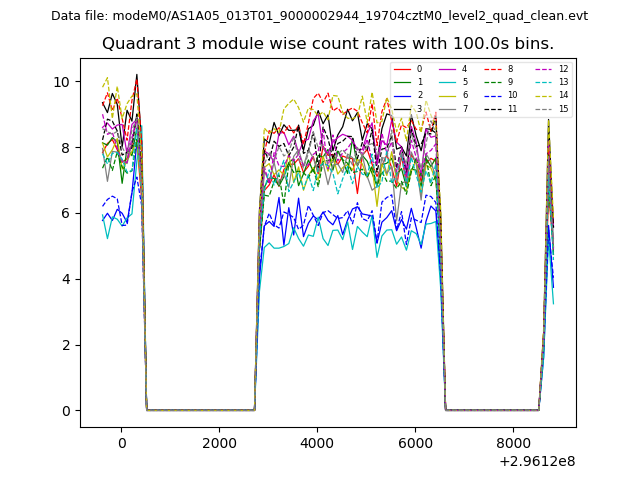
| Quadrant-wise count rates Data is divided into 100 sec bins |
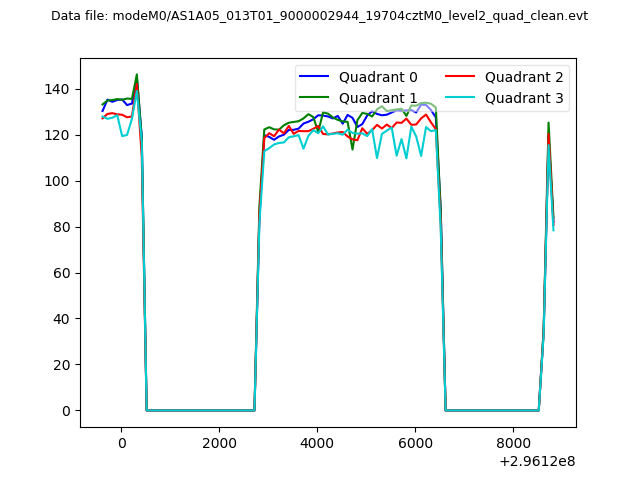 |
|
| Module-wise count rates for Quadrant A Data is divided into 100 sec bins |
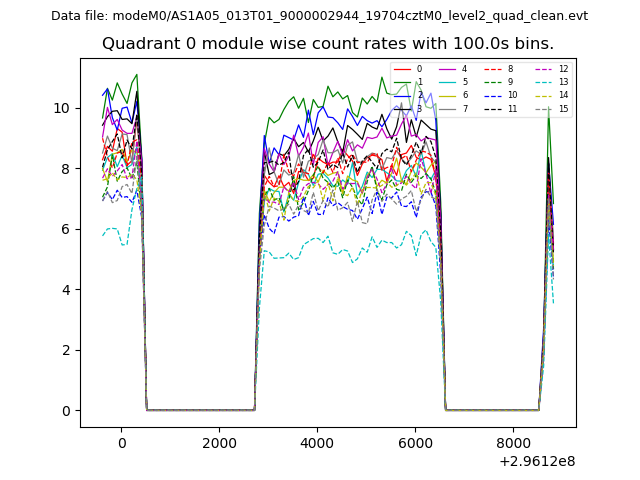 |
 |
| Module-wise count rates for Quadrant B Data is divided into 100 sec bins |
 |
 |
| Module-wise count rates for Quadrant C Data is divided into 100 sec bins |
 |
 |
| Module-wise count rates for Quadrant D Data is divided into 100 sec bins |
 |
 |
| Parameter | Plot |
|---|---|
| CZT HV Monitor | 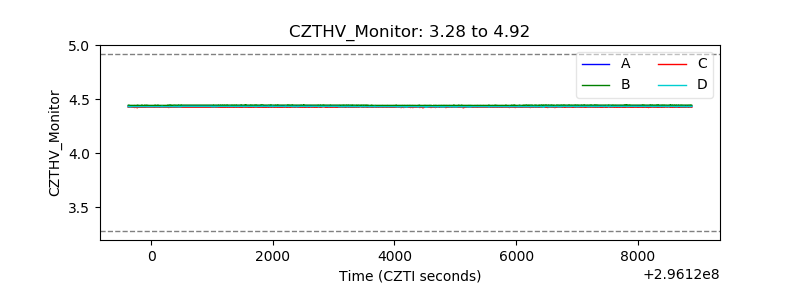 |
| D_VDD | 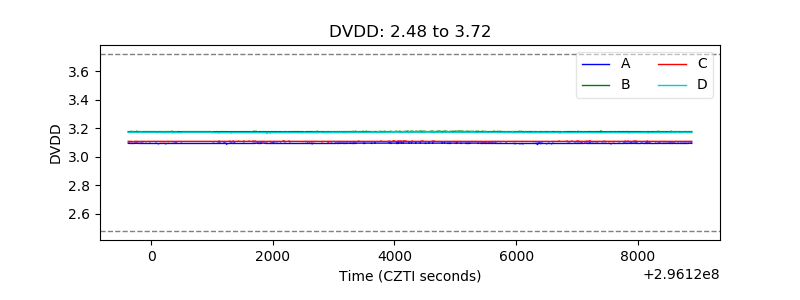 |
| Temperature 1 | 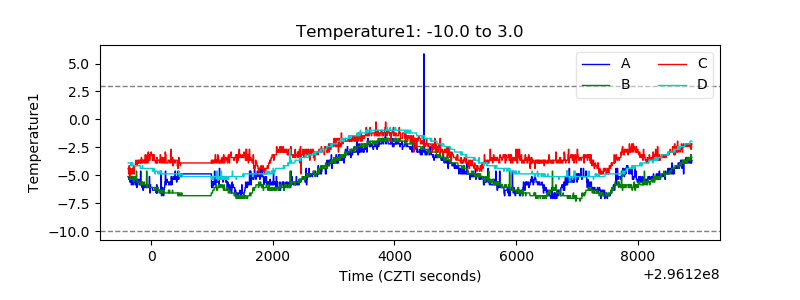 |
| Veto HV Monitor | 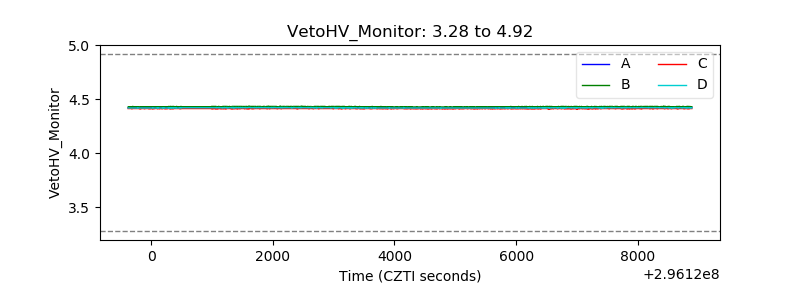 |
| Veto LLD | 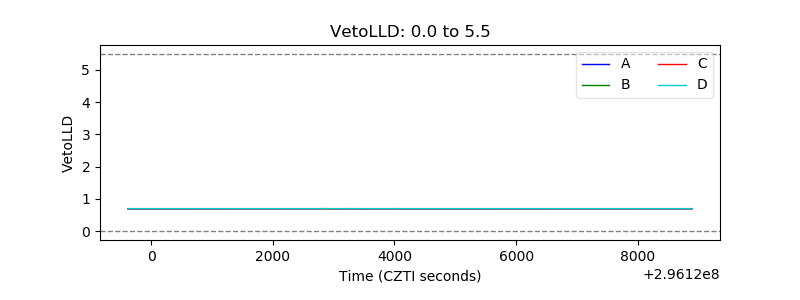 |
| Alpha Counter | 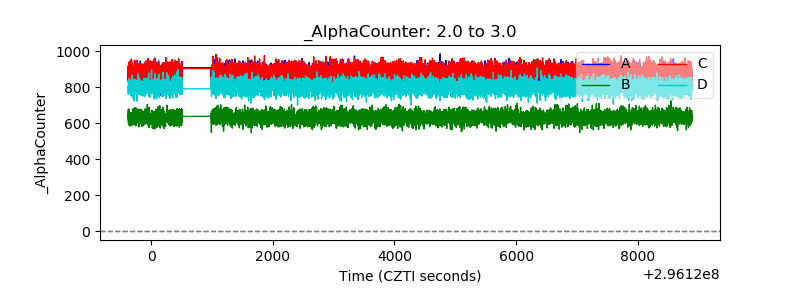 |
| _CPM_Rate | 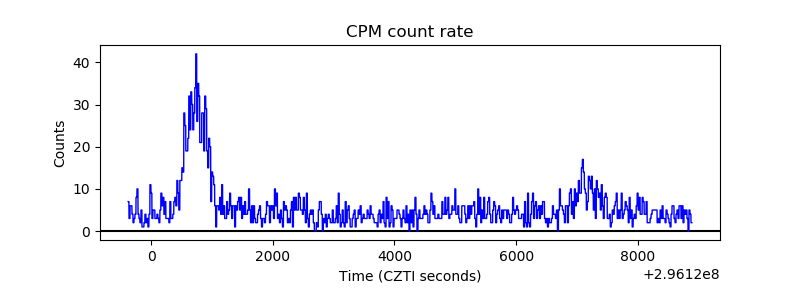 |
| CZT Counter | 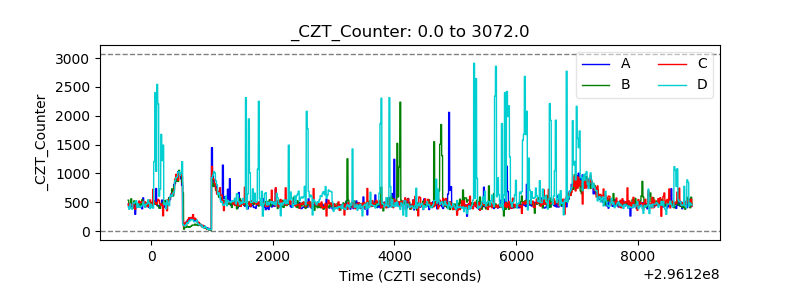 |
| +2.5 Volts monitor |  |
| +5 Volts monitor |  |
| _ROLL_ROT | 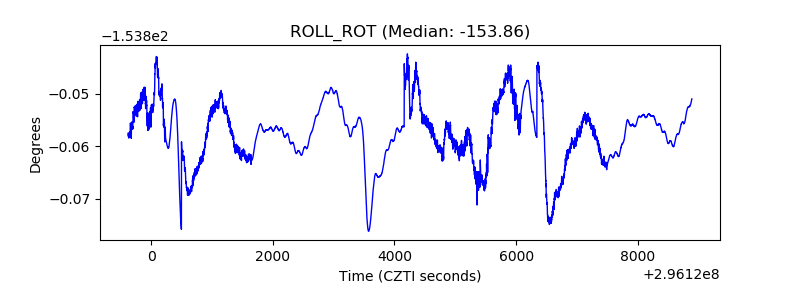 |
| _Roll_DEC | 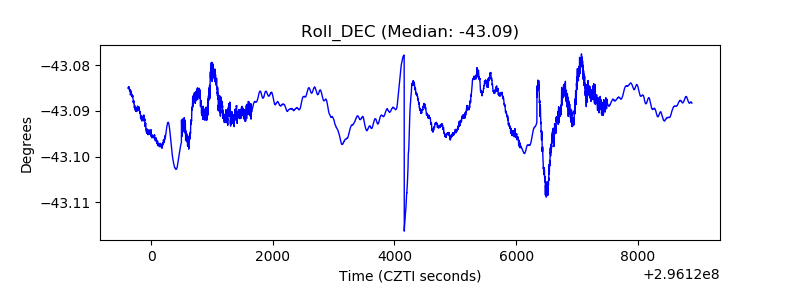 |
| _Roll_RA | 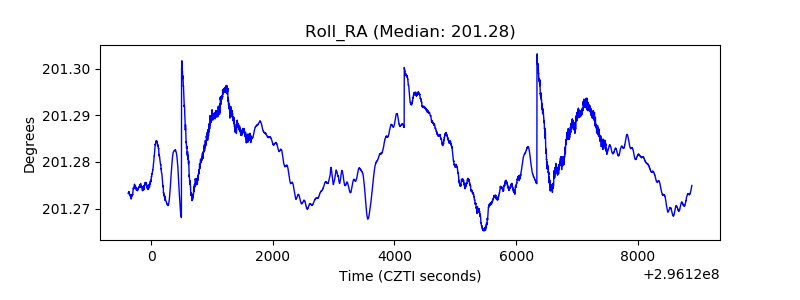 |
| Veto Counter | 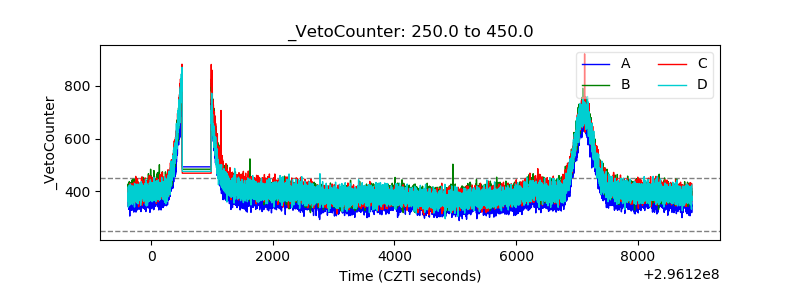 |