| Param | Original file | Final file |
|---|---|---|
| Filename | modeM0/AS1A05_013T01_9000002944_19705cztM0_level2.evt | modeM0/AS1A05_013T01_9000002944_19705cztM0_level2_quad_clean.evt |
| Size (bytes) | 659,165,760 | 93,980,160 |
| Size | 628.6 MB | 89.6 MB |
| Events in quadrant A | 4,283,330 | 573,689 |
| Events in quadrant B | 4,515,683 | 582,088 |
| Events in quadrant C | 4,575,584 | 555,192 |
| Events in quadrant D | 5,997,815 | 530,714 |
| Mode SS | |||
|---|---|---|---|
| Quadrant | BADHDUFLAG | Total packets | Discarded packets |
| A | 0 | 176 | 0 |
| B | 0 | 176 | 0 |
| C | 0 | 176 | 0 |
| D | 0 | 176 | 0 |
| Mode M0 | |||
|---|---|---|---|
| Quadrant | BADHDUFLAG | Total packets | Discarded packets |
| A | 0 | 18450 | 1 |
| B | 0 | 18890 | 1 |
| C | 0 | 18952 | 1 |
| D | 0 | 23619 | 1 |
| Mode M9 | |||
|---|---|---|---|
| Quadrant | BADHDUFLAG | Total packets | Discarded packets |
| A | 0 | 1 | 0 |
| B | 0 | 1 | 0 |
| C | 0 | 1 | 0 |
| D | 0 | 1 | 0 |
| Quadrant | Total seconds | Saturated seconds | Saturation percentage |
|---|---|---|---|
| A | 8701 | 523 | 6.010803% |
| B | 8701 | 551 | 6.332605% |
| C | 8702 | 587 | 6.745576% |
| D | 8702 | 804 | 9.239255% |
Noise dominated data is calculated using 1-second bins in cleaned event files. If a bin has >2000 counts, and if more than 50% of those come from <1% of pixels, then it is considered to be noise-dominated and hence unusable.
| Quadrant | # 1 sec bins | Bins with >0 counts | Bins with >2000 counts | High rate bins dominated by noise | Noise dominated (total time) | Noise dominated (detector-on time) | Marked lightcurve |
|---|---|---|---|---|---|---|---|
| A | 8811 | 8701 | 10 | 10 | 0.11% | 0.11% | 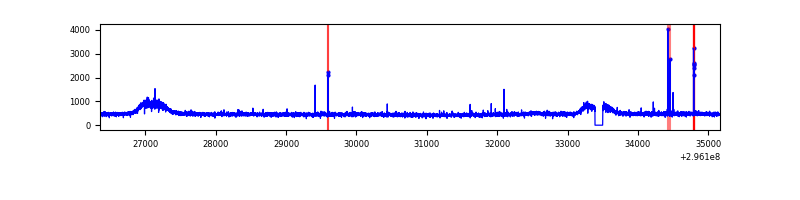 |
| B | 8811 | 8701 | 5 | 5 | 0.06% | 0.06% | 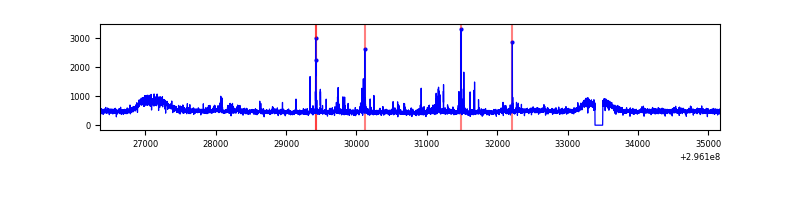 |
| C | 8812 | 8702 | 9 | 9 | 0.10% | 0.10% | 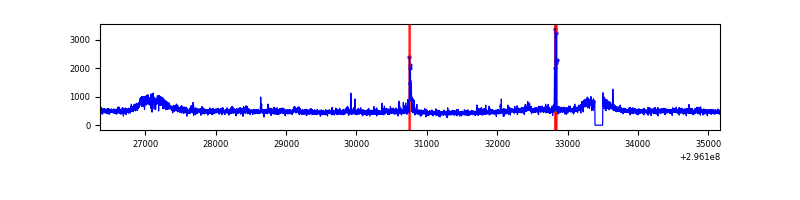 |
| D | 8812 | 8702 | 290 | 290 | 3.29% | 3.33% | 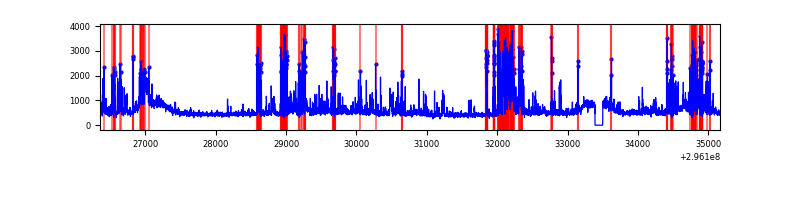 |
Top three noisy pixels from each quadrant. If the there are fewer than three noisy pixels in the level2.evt file, extra rows are filled as -1
| Pixel properties | Quadrant properties | ||||||
|---|---|---|---|---|---|---|---|
| Quadrant | DetID | PixID | Counts | Sigma | Mean | Median | Sigma |
| A | 5 | 16 | 47466 | 205.88 | 1100 | 1071 | 225.3 |
| A | 0 | 226 | 9404 | 36.98 | 1100 | 1071 | 225.3 |
| A | 3 | 137 | 9377 | 36.86 | 1100 | 1071 | 225.3 |
| B | 0 | 198 | 73990 | 346.07 | 1091 | 1059 | 210.7 |
| B | 4 | 216 | 37865 | 174.65 | 1091 | 1059 | 210.7 |
| B | 0 | 197 | 35125 | 161.65 | 1091 | 1059 | 210.7 |
| C | 3 | 233 | 263016 | 1052.78 | 1055 | 1059 | 248.8 |
| C | 14 | 238 | 162393 | 648.39 | 1055 | 1059 | 248.8 |
| C | 9 | 221 | 34399 | 133.99 | 1055 | 1059 | 248.8 |
| D | 1 | 52 | 1841844 | 7119.47 | 1059 | 1025 | 258.6 |
| D | 12 | 225 | 124239 | 476.54 | 1059 | 1025 | 258.6 |
| D | 2 | 234 | 37883 | 142.55 | 1059 | 1025 | 258.6 |
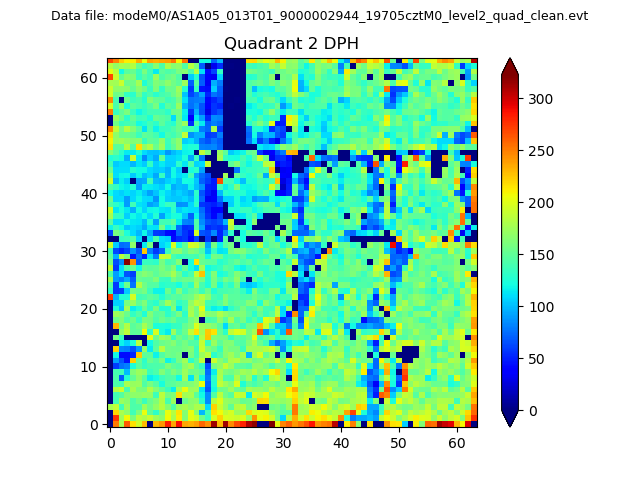
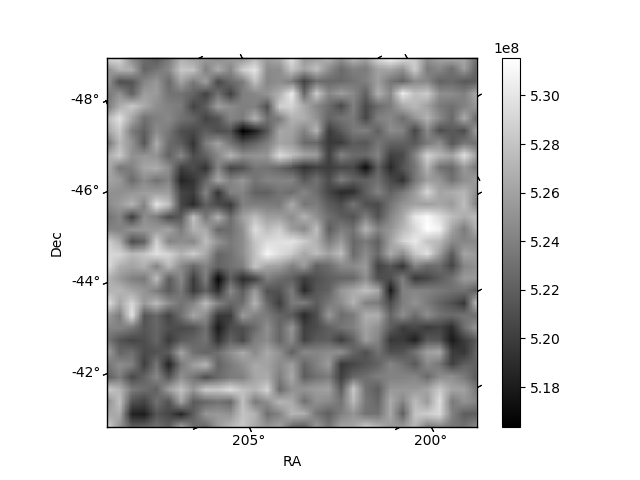
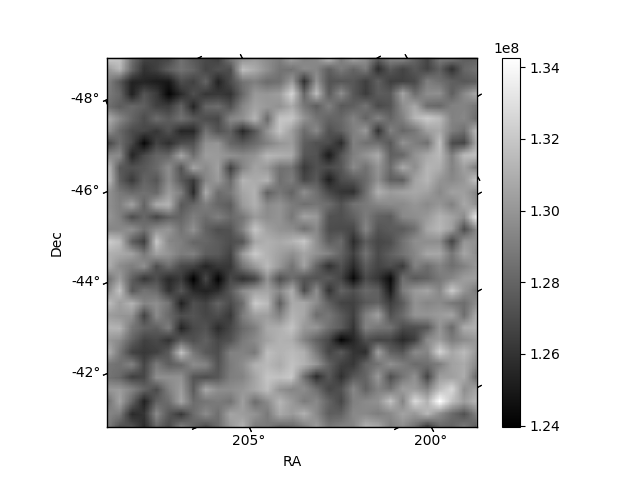
Histogram calculated using DETX and DETY for each event in the final _common_clean file
| Quadrant A | 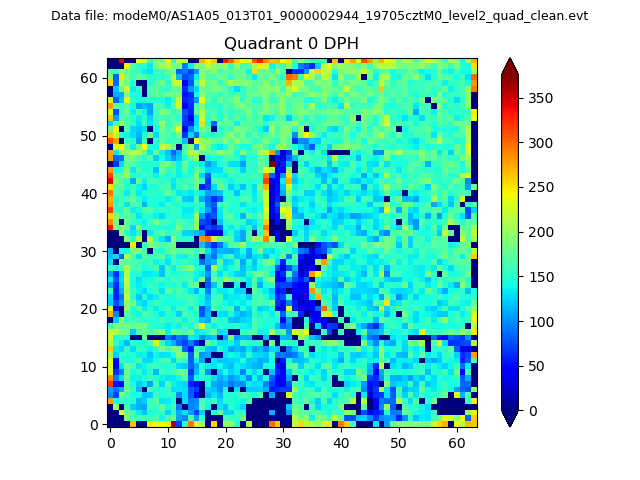 |
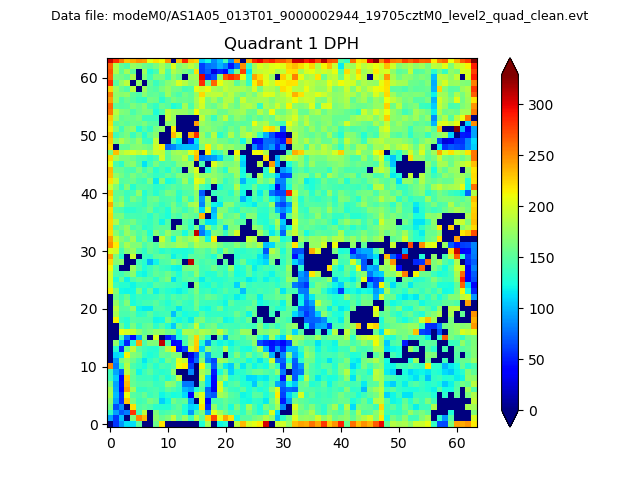 |
Quadrant B |
|---|---|---|---|
| Quadrant D | 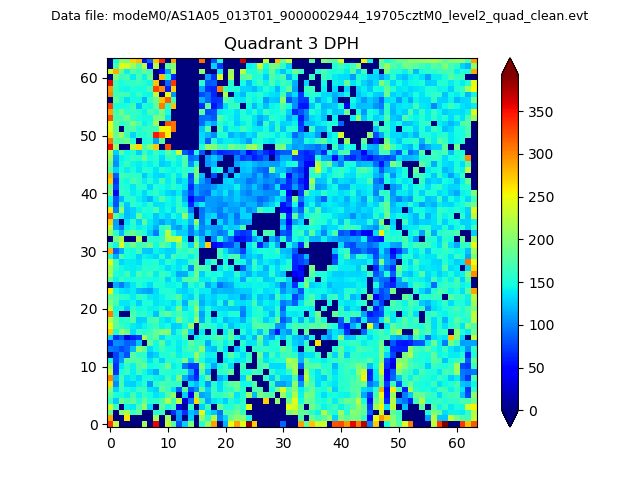 |
 |
Quadrant C |
| Plot type | Count rate plots | Images |
|---|---|---|
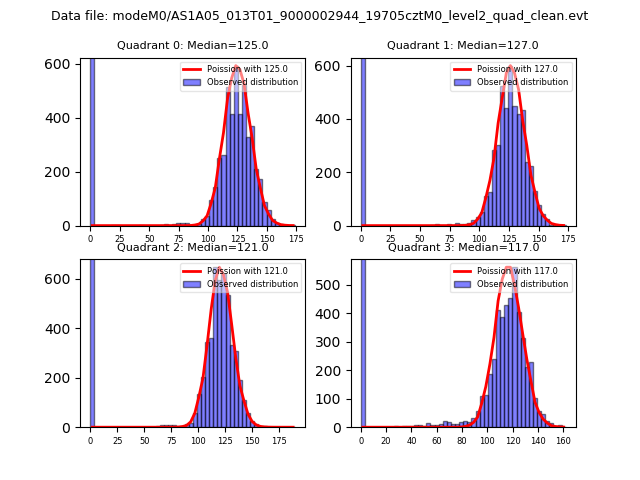
| Comparison with Poisson distribution Blue bars denote a histogram of data divided into 1 sec bins. Red curve is a Poisson curve with rate = median count rate of data. |
 |
 |
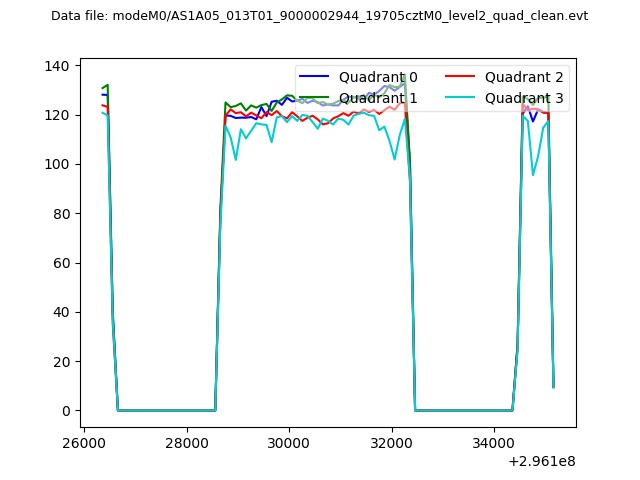
| Quadrant-wise count rates Data is divided into 100 sec bins |
 |
|
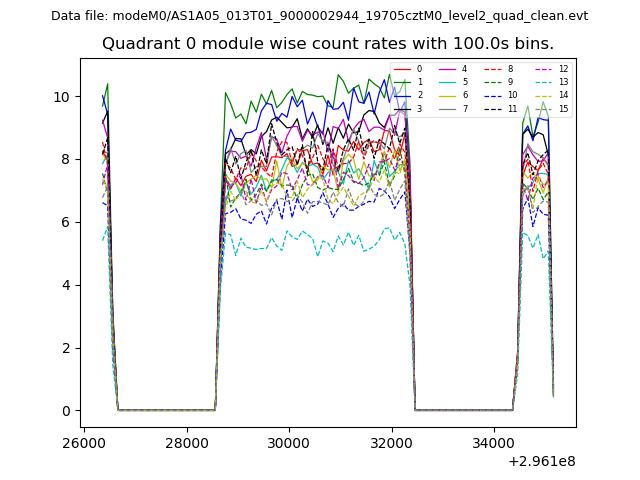
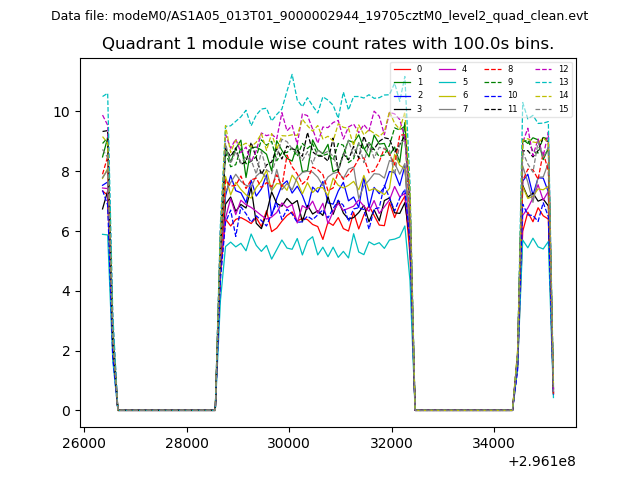
| Module-wise count rates for Quadrant A Data is divided into 100 sec bins |
 |
 |
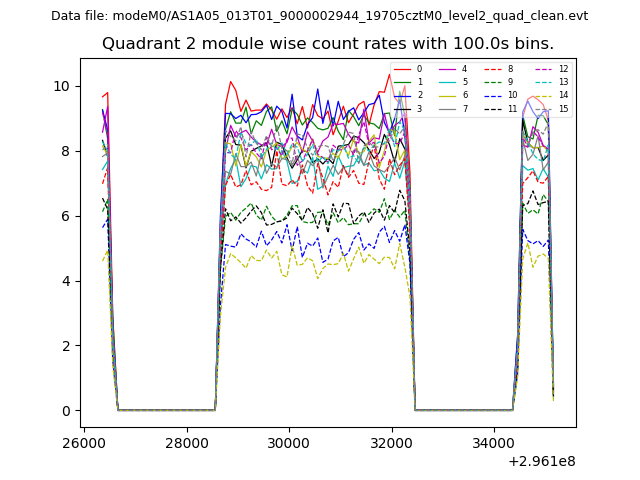
| Module-wise count rates for Quadrant B Data is divided into 100 sec bins |
 |
 |
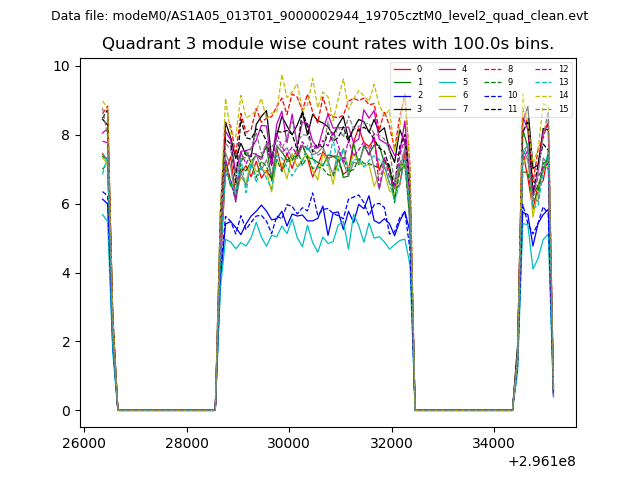
| Module-wise count rates for Quadrant C Data is divided into 100 sec bins |
 |
 |
| Module-wise count rates for Quadrant D Data is divided into 100 sec bins |
 |
 |
| Parameter | Plot |
|---|---|
| CZT HV Monitor | 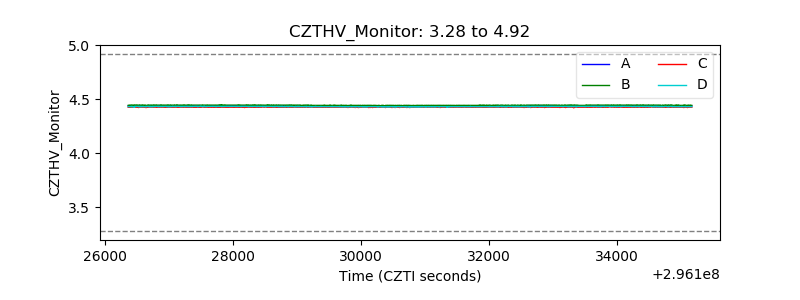 |
| D_VDD | 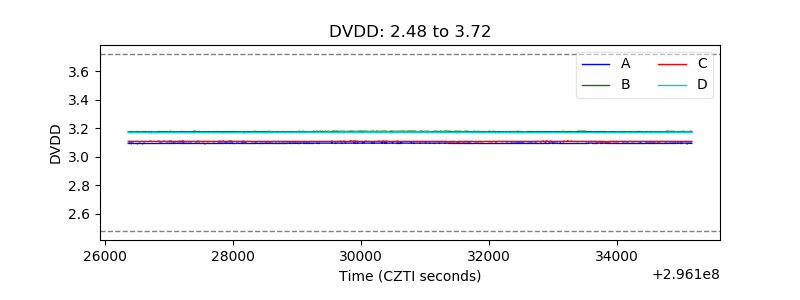 |
| Temperature 1 |  |
| Veto HV Monitor | 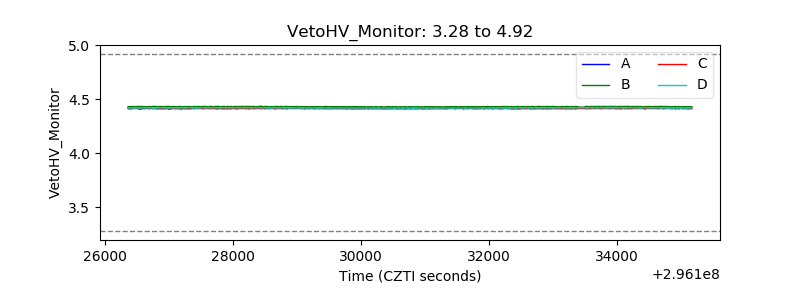 |
| Veto LLD | 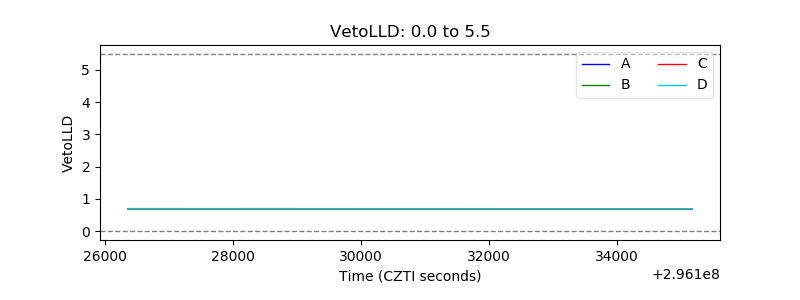 |
| Alpha Counter | 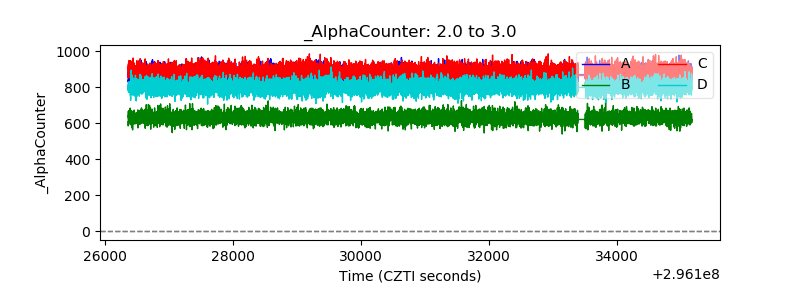 |
| _CPM_Rate | 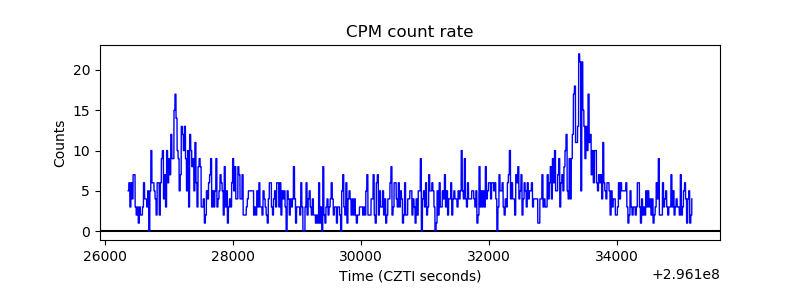 |
| CZT Counter | 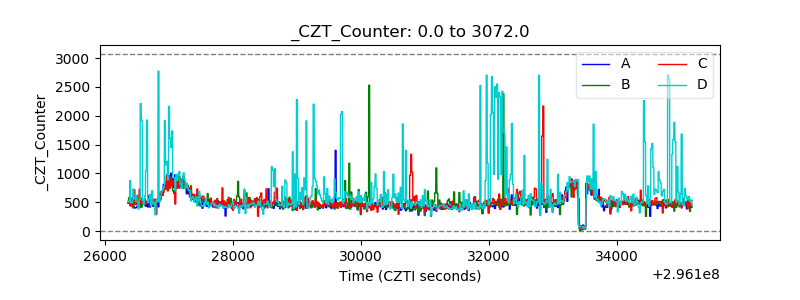 |
| +2.5 Volts monitor |  |
| +5 Volts monitor |  |
| _ROLL_ROT | 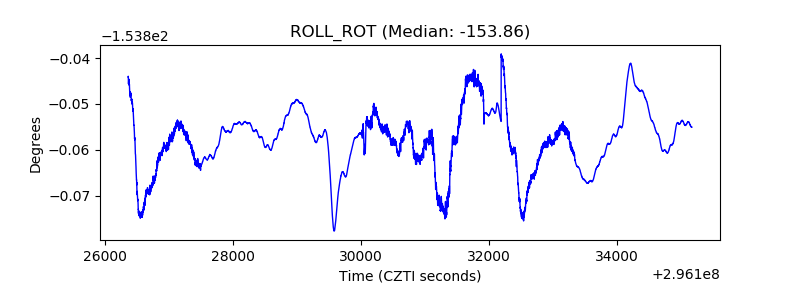 |
| _Roll_DEC | 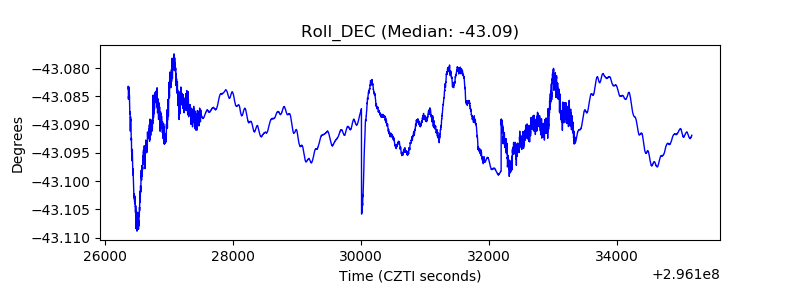 |
| _Roll_RA | 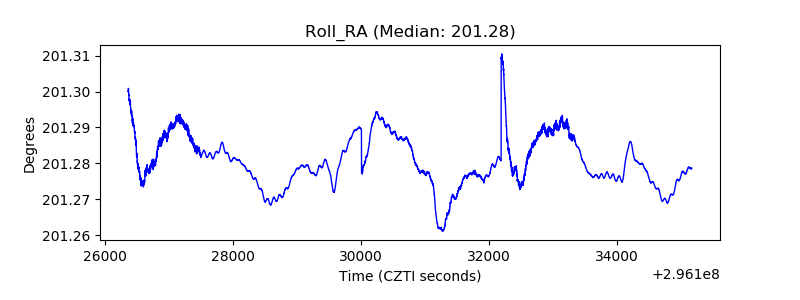 |
| Veto Counter | 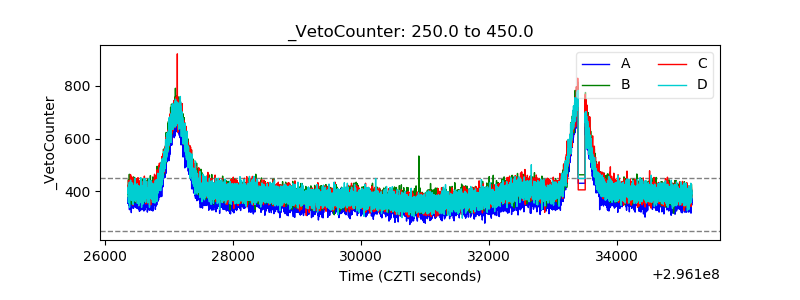 |