| Param | Original file | Final file |
|---|---|---|
| Filename | modeM0/AS1A05_013T01_9000002944_19711cztM0_level2.evt | modeM0/AS1A05_013T01_9000002944_19711cztM0_level2_quad_clean.evt |
| Size (bytes) | 484,539,840 | 92,185,920 |
| Size | 462.1 MB | 87.9 MB |
| Events in quadrant A | 3,075,542 | 605,997 |
| Events in quadrant B | 3,282,726 | 614,670 |
| Events in quadrant C | 4,027,231 | 567,565 |
| Events in quadrant D | 3,850,024 | 552,547 |
| Mode SS | |||
|---|---|---|---|
| Quadrant | BADHDUFLAG | Total packets | Discarded packets |
| A | 0 | 132 | 0 |
| B | 0 | 132 | 0 |
| C | 0 | 132 | 0 |
| D | 0 | 132 | 0 |
| Mode M0 | |||
|---|---|---|---|
| Quadrant | BADHDUFLAG | Total packets | Discarded packets |
| A | 0 | 13428 | 2 |
| B | 0 | 13961 | 3 |
| C | 0 | 16479 | 2 |
| D | 0 | 15941 | 2 |
| Mode M9 | |||
|---|---|---|---|
| Quadrant | BADHDUFLAG | Total packets | Discarded packets |
| A | 0 | 11 | 0 |
| B | 0 | 12 | 0 |
| C | 0 | 12 | 0 |
| D | 0 | 12 | 0 |
| Quadrant | Total seconds | Saturated seconds | Saturation percentage |
|---|---|---|---|
| A | 6461 | 23 | 0.355982% |
| B | 6460 | 43 | 0.665635% |
| C | 6460 | 245 | 3.792570% |
| D | 6460 | 173 | 2.678019% |
Noise dominated data is calculated using 1-second bins in cleaned event files. If a bin has >2000 counts, and if more than 50% of those come from <1% of pixels, then it is considered to be noise-dominated and hence unusable.
| Quadrant | # 1 sec bins | Bins with >0 counts | Bins with >2000 counts | High rate bins dominated by noise | Noise dominated (total time) | Noise dominated (detector-on time) | Marked lightcurve |
|---|---|---|---|---|---|---|---|
| A | 7576 | 6462 | 0 | 0 | 0.00% | 0.00% | 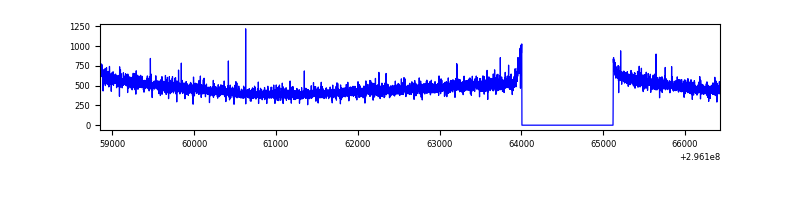 |
| B | 7575 | 6460 | 5 | 5 | 0.07% | 0.08% | 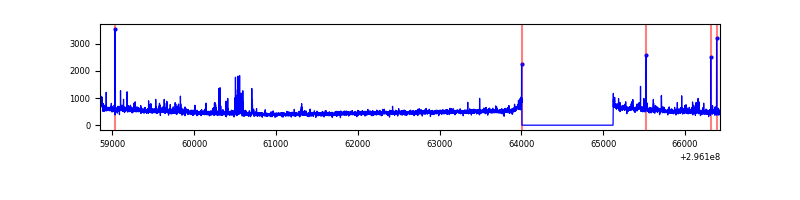 |
| C | 7575 | 6460 | 69 | 69 | 0.91% | 1.07% | 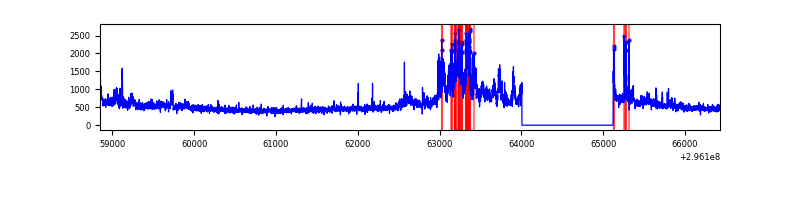 |
| D | 7575 | 6461 | 142 | 142 | 1.87% | 2.20% | 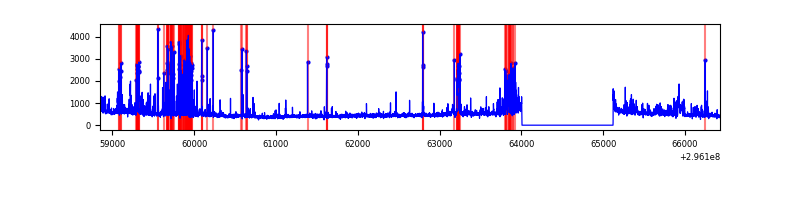 |
Top three noisy pixels from each quadrant. If the there are fewer than three noisy pixels in the level2.evt file, extra rows are filled as -1
| Pixel properties | Quadrant properties | ||||||
|---|---|---|---|---|---|---|---|
| Quadrant | DetID | PixID | Counts | Sigma | Mean | Median | Sigma |
| A | 13 | 254 | 7527 | 41.9 | 797 | 781 | 161.0 |
| A | 0 | 226 | 7028 | 38.8 | 797 | 781 | 161.0 |
| A | 3 | 137 | 6387 | 34.82 | 797 | 781 | 161.0 |
| B | 0 | 197 | 54558 | 357.17 | 796 | 777 | 150.6 |
| B | 4 | 171 | 38524 | 250.69 | 796 | 777 | 150.6 |
| B | 7 | 220 | 26446 | 170.47 | 796 | 777 | 150.6 |
| C | 3 | 233 | 913931 | 5277.59 | 745 | 749 | 173.0 |
| C | 14 | 238 | 117287 | 673.51 | 745 | 749 | 173.0 |
| C | 7 | 247 | 74203 | 424.52 | 745 | 749 | 173.0 |
| D | 1 | 52 | 625238 | 3399.32 | 754 | 733 | 183.7 |
| D | 1 | 20 | 108613 | 587.22 | 754 | 733 | 183.7 |
| D | 12 | 225 | 82046 | 442.61 | 754 | 733 | 183.7 |
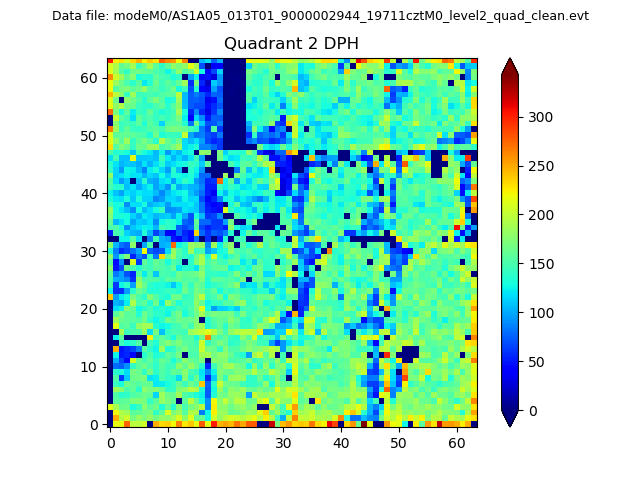
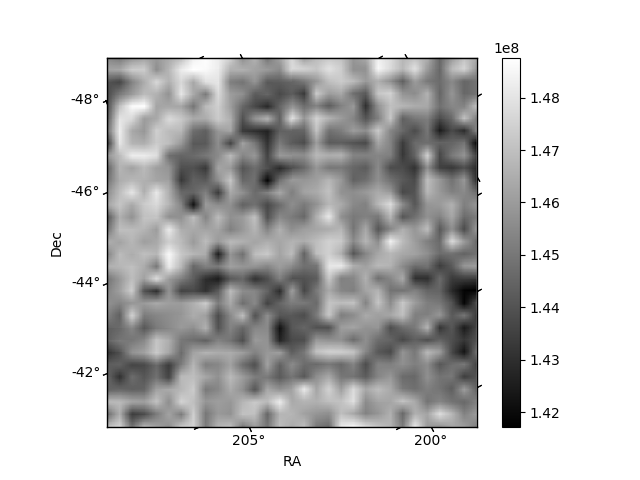
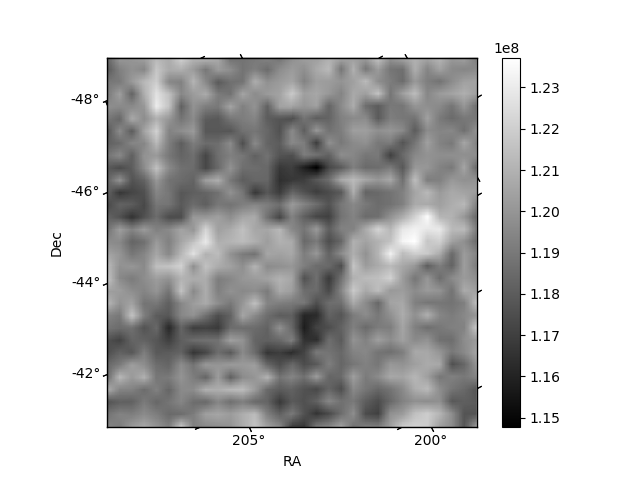
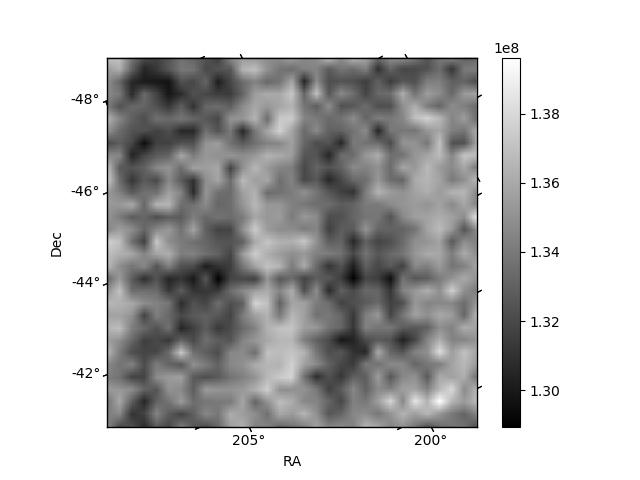
Histogram calculated using DETX and DETY for each event in the final _common_clean file
| Quadrant A | 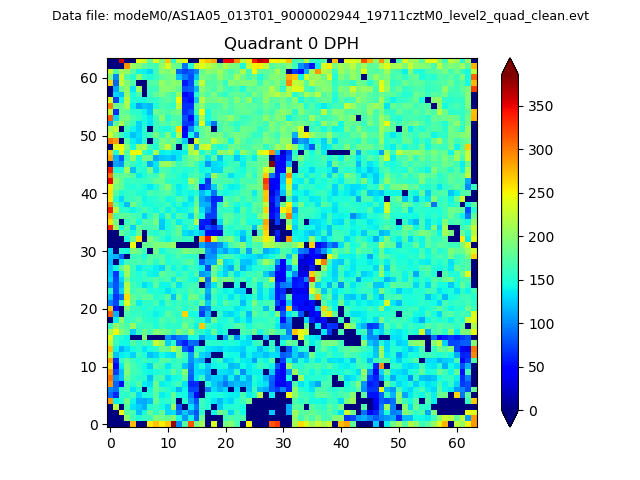 |
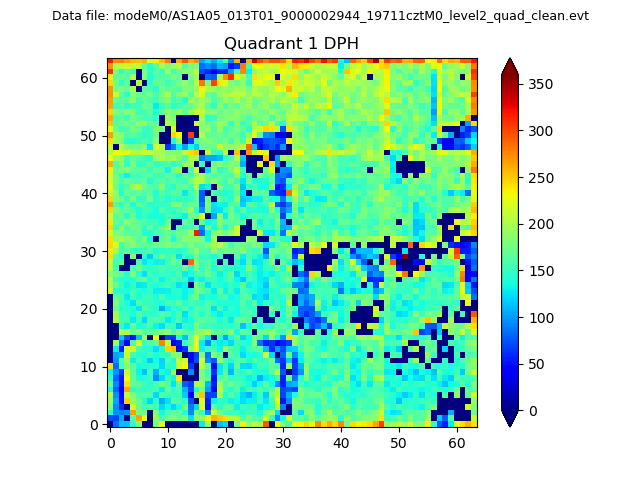 |
Quadrant B |
|---|---|---|---|
| Quadrant D | 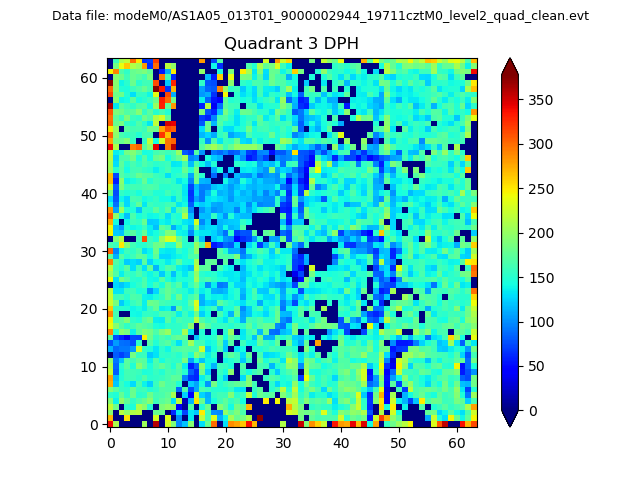 |
 |
Quadrant C |
| Plot type | Count rate plots | Images |
|---|---|---|
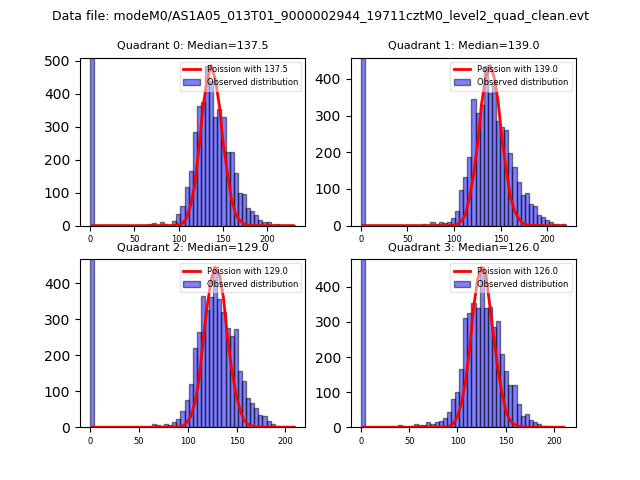
| Comparison with Poisson distribution Blue bars denote a histogram of data divided into 1 sec bins. Red curve is a Poisson curve with rate = median count rate of data. |
 |
 |
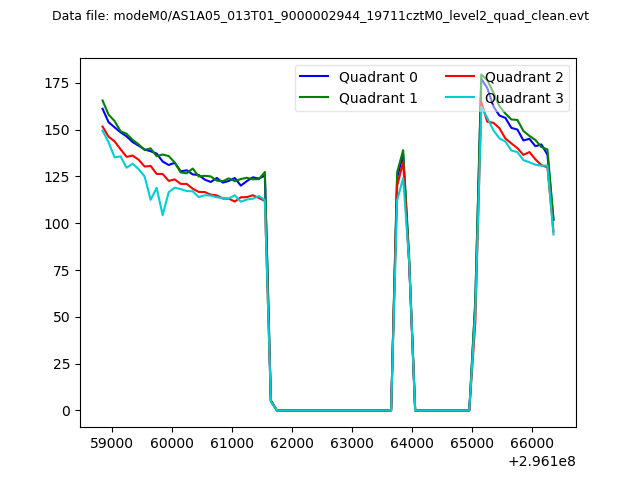
| Quadrant-wise count rates Data is divided into 100 sec bins |
 |
|
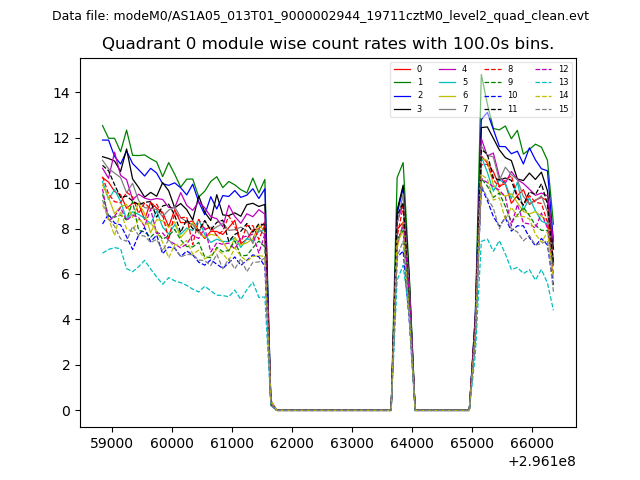
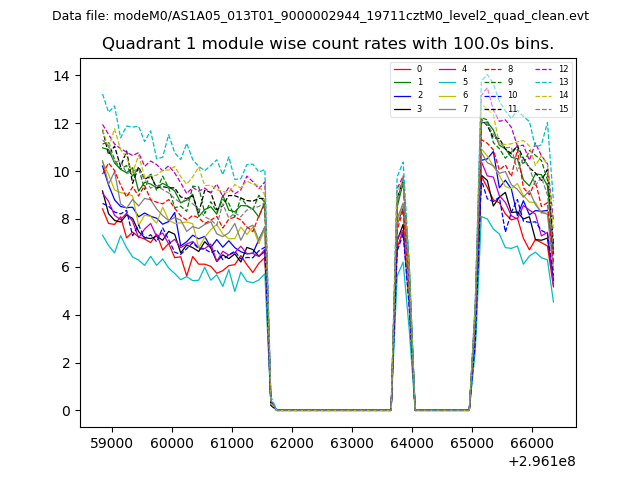
| Module-wise count rates for Quadrant A Data is divided into 100 sec bins |
 |
 |
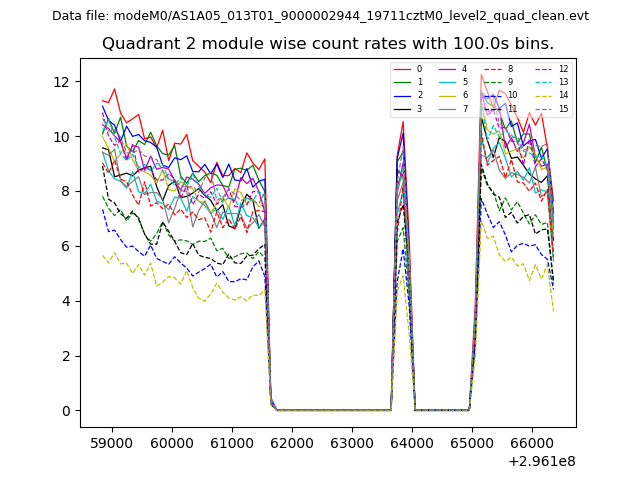
| Module-wise count rates for Quadrant B Data is divided into 100 sec bins |
 |
 |
| Module-wise count rates for Quadrant C Data is divided into 100 sec bins |
 |
 |
| Module-wise count rates for Quadrant D Data is divided into 100 sec bins |
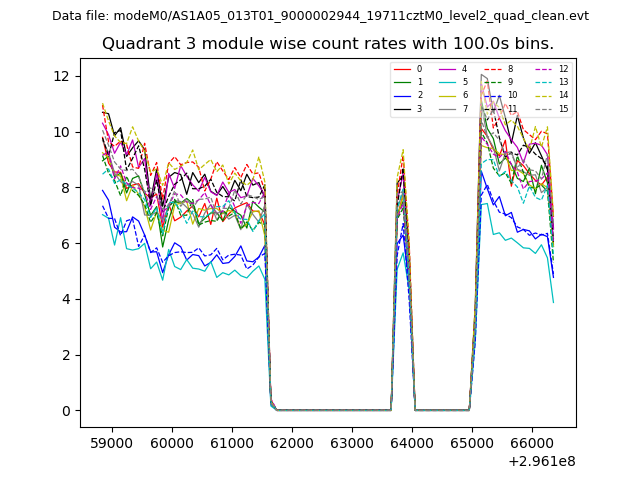 |
 |
| Parameter | Plot |
|---|---|
| CZT HV Monitor | 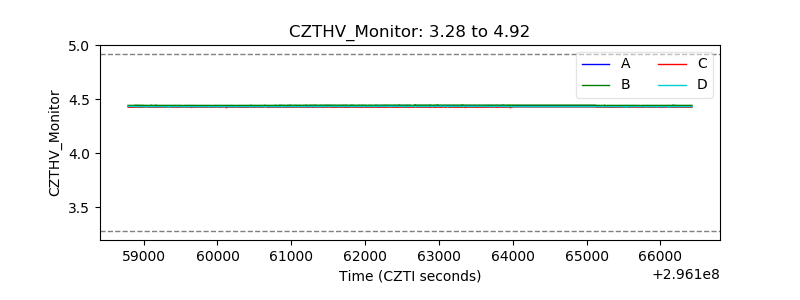 |
| D_VDD | 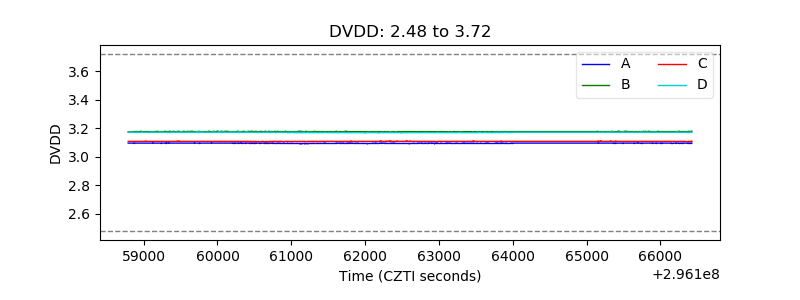 |
| Temperature 1 | 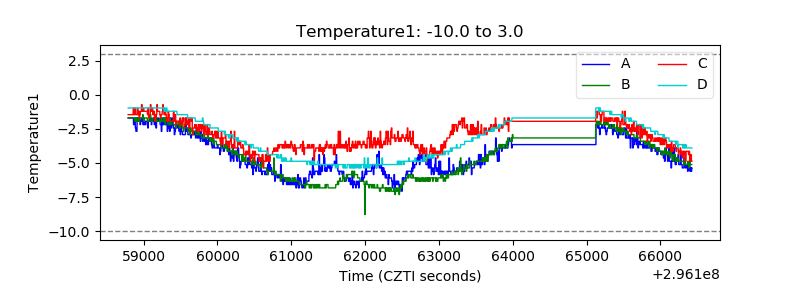 |
| Veto HV Monitor | 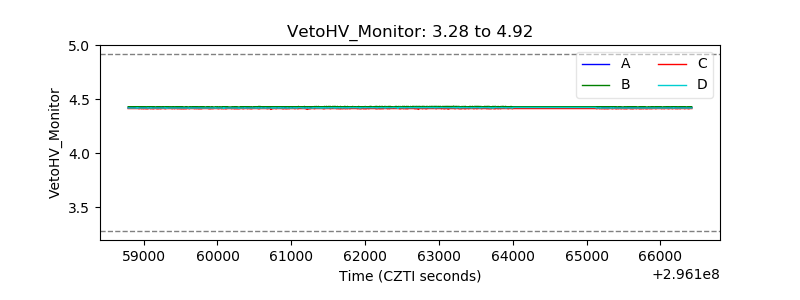 |
| Veto LLD | 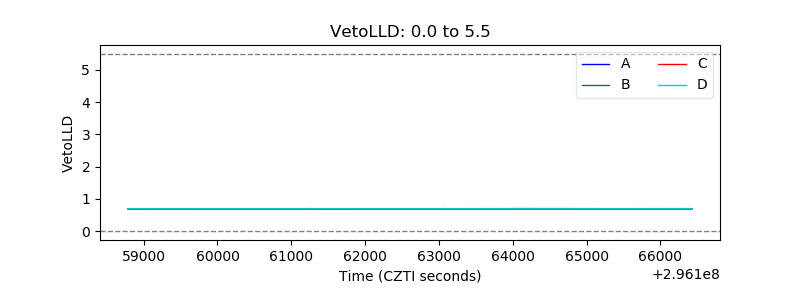 |
| Alpha Counter | 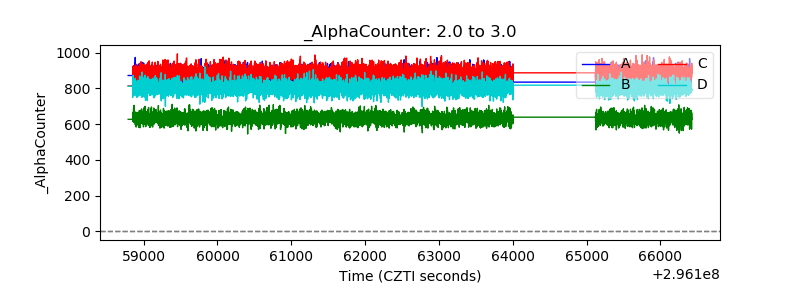 |
| _CPM_Rate | 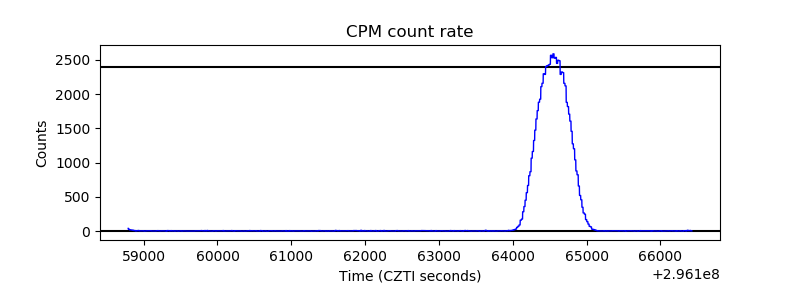 |
| CZT Counter | 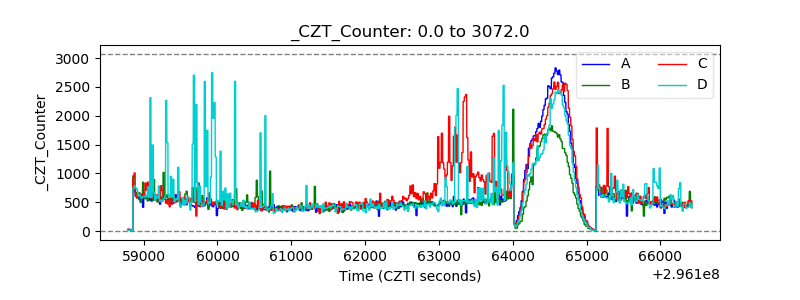 |
| +2.5 Volts monitor |  |
| +5 Volts monitor | 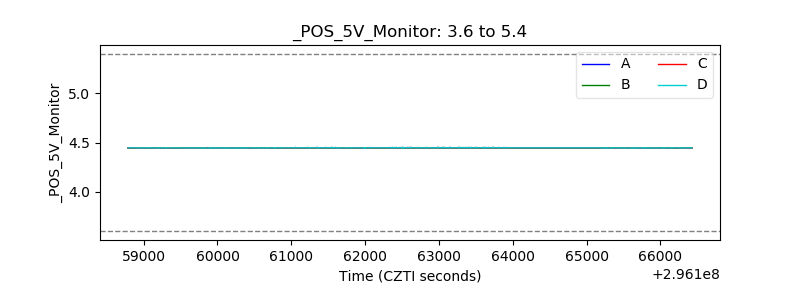 |
| _ROLL_ROT | 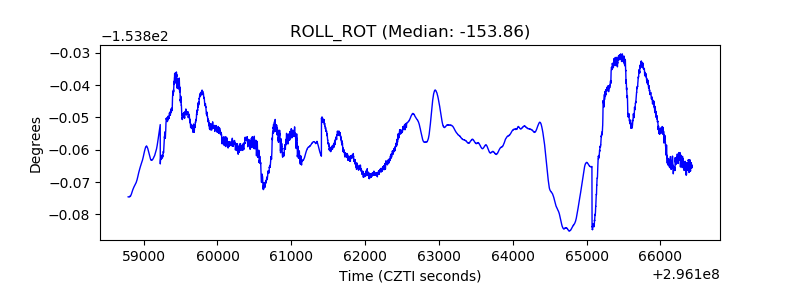 |
| _Roll_DEC |  |
| _Roll_RA | 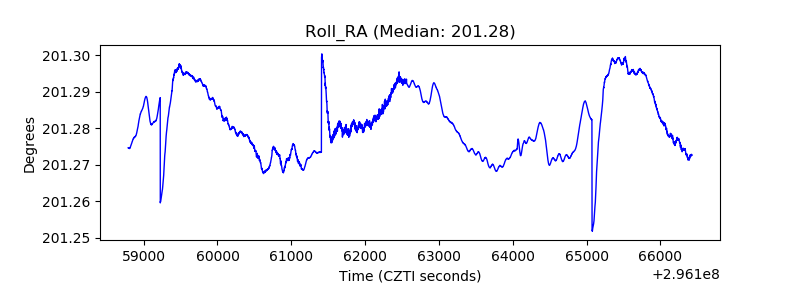 |
| Veto Counter |  |