| Param | Original file | Final file |
|---|---|---|
| Filename | modeM0/AS1A05_013T01_9000002944_19712cztM0_level2.evt | modeM0/AS1A05_013T01_9000002944_19712cztM0_level2_quad_clean.evt |
| Size (bytes) | 447,327,360 | 93,965,760 |
| Size | 426.6 MB | 89.6 MB |
| Events in quadrant A | 3,058,169 | 617,677 |
| Events in quadrant B | 3,334,543 | 631,433 |
| Events in quadrant C | 3,332,225 | 586,218 |
| Events in quadrant D | 3,395,736 | 572,028 |
| Mode SS | |||
|---|---|---|---|
| Quadrant | BADHDUFLAG | Total packets | Discarded packets |
| A | 0 | 126 | 0 |
| B | 0 | 126 | 0 |
| C | 0 | 126 | 0 |
| D | 0 | 126 | 0 |
| Mode M0 | |||
|---|---|---|---|
| Quadrant | BADHDUFLAG | Total packets | Discarded packets |
| A | 0 | 13216 | 2 |
| B | 0 | 14003 | 2 |
| C | 0 | 13882 | 2 |
| D | 0 | 14344 | 2 |
| Mode M9 | |||
|---|---|---|---|
| Quadrant | BADHDUFLAG | Total packets | Discarded packets |
| A | 0 | 21 | 0 |
| B | 0 | 22 | 0 |
| C | 0 | 22 | 0 |
| D | 0 | 22 | 0 |
| Quadrant | Total seconds | Saturated seconds | Saturation percentage |
|---|---|---|---|
| A | 6286 | 19 | 0.302259% |
| B | 6286 | 57 | 0.906777% |
| C | 6286 | 87 | 1.384028% |
| D | 6286 | 36 | 0.572701% |
Noise dominated data is calculated using 1-second bins in cleaned event files. If a bin has >2000 counts, and if more than 50% of those come from <1% of pixels, then it is considered to be noise-dominated and hence unusable.
| Quadrant | # 1 sec bins | Bins with >0 counts | Bins with >2000 counts | High rate bins dominated by noise | Noise dominated (total time) | Noise dominated (detector-on time) | Marked lightcurve |
|---|---|---|---|---|---|---|---|
| A | 7541 | 6287 | 0 | 0 | 0.00% | 0.00% | 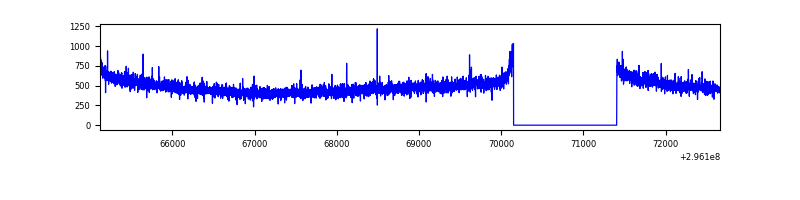 |
| B | 7541 | 6287 | 13 | 13 | 0.17% | 0.21% | 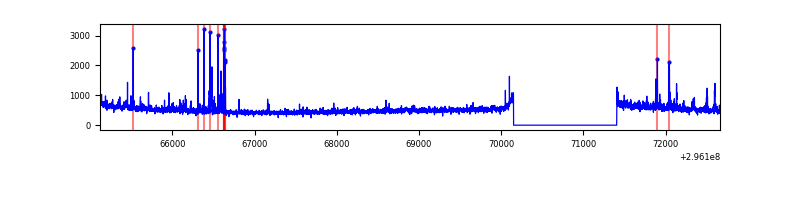 |
| C | 7541 | 6287 | 8 | 8 | 0.11% | 0.13% | 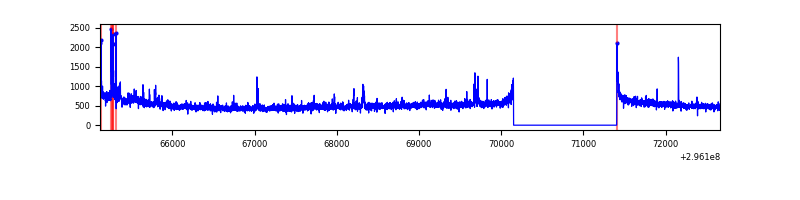 |
| D | 7541 | 6287 | 22 | 22 | 0.29% | 0.35% | 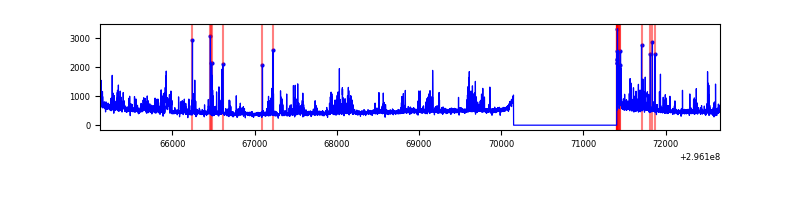 |
Top three noisy pixels from each quadrant. If the there are fewer than three noisy pixels in the level2.evt file, extra rows are filled as -1
| Pixel properties | Quadrant properties | ||||||
|---|---|---|---|---|---|---|---|
| Quadrant | DetID | PixID | Counts | Sigma | Mean | Median | Sigma |
| A | 11 | 29 | 15829 | 94.83 | 790 | 776 | 158.7 |
| A | 0 | 226 | 6877 | 38.43 | 790 | 776 | 158.7 |
| A | 3 | 137 | 6190 | 34.11 | 790 | 776 | 158.7 |
| B | 7 | 220 | 80519 | 537.51 | 795 | 778 | 148.4 |
| B | 0 | 197 | 58328 | 387.93 | 795 | 778 | 148.4 |
| B | 4 | 171 | 36805 | 242.85 | 795 | 778 | 148.4 |
| C | 3 | 233 | 207654 | 1186.47 | 751 | 756 | 174.4 |
| C | 14 | 238 | 119825 | 682.81 | 751 | 756 | 174.4 |
| C | 7 | 247 | 51457 | 290.75 | 751 | 756 | 174.4 |
| D | 12 | 225 | 236209 | 1297.5 | 753 | 732 | 181.5 |
| D | 1 | 52 | 165668 | 908.81 | 753 | 732 | 181.5 |
| D | 12 | 218 | 90825 | 496.42 | 753 | 732 | 181.5 |
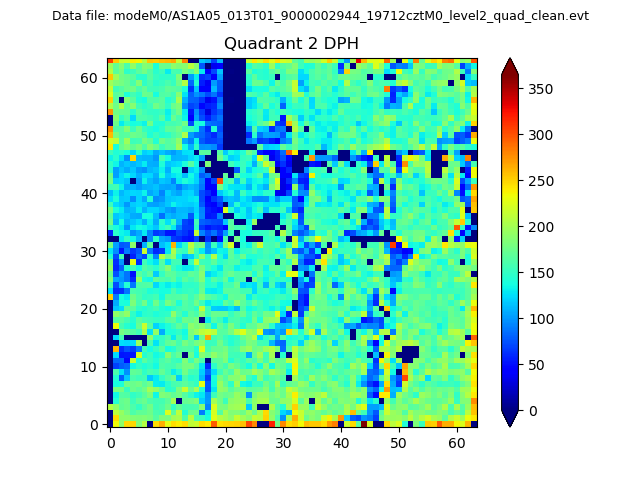
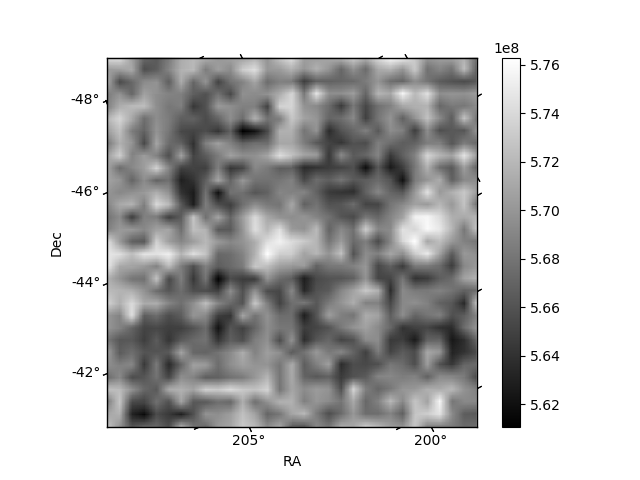
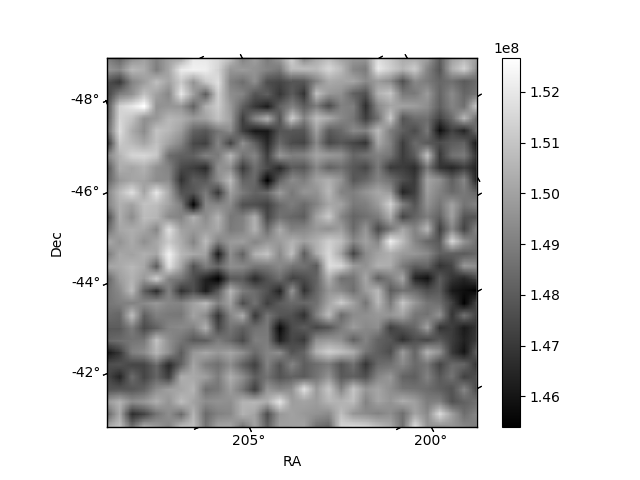
Histogram calculated using DETX and DETY for each event in the final _common_clean file
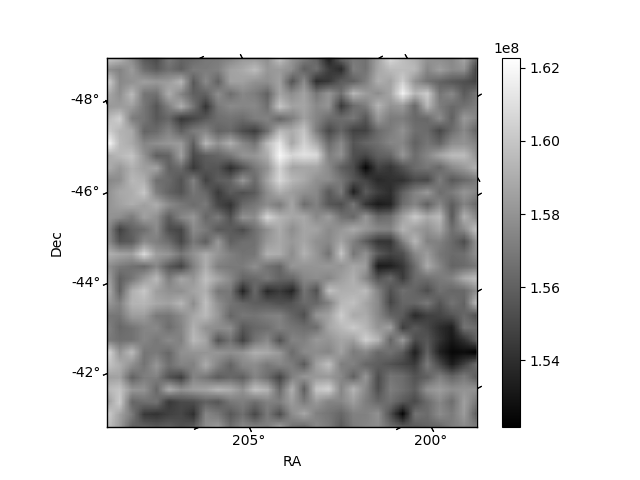
| Quadrant A | 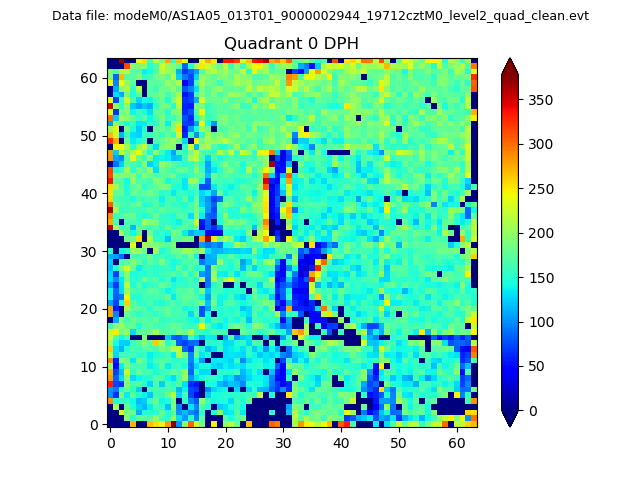 |
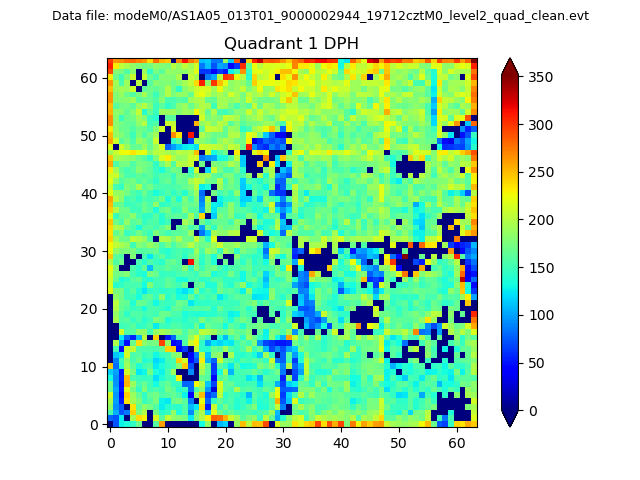 |
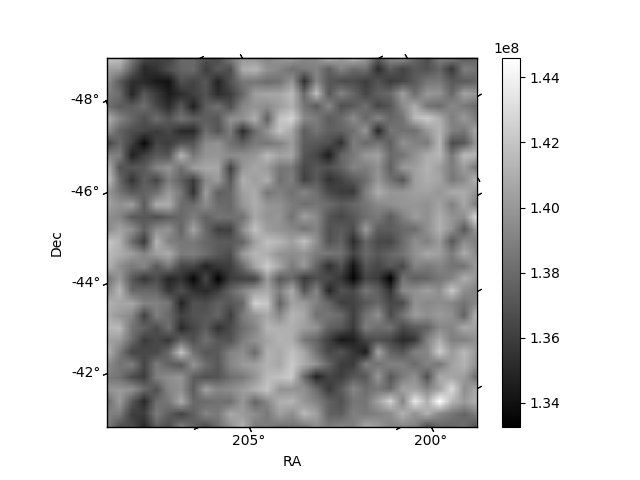
Quadrant B |
|---|---|---|---|
| Quadrant D | 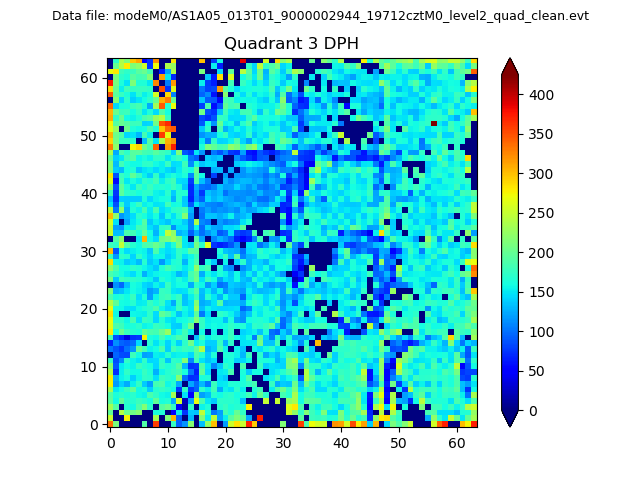 |
 |
Quadrant C |
| Plot type | Count rate plots | Images |
|---|---|---|
| Comparison with Poisson distribution Blue bars denote a histogram of data divided into 1 sec bins. Red curve is a Poisson curve with rate = median count rate of data. |
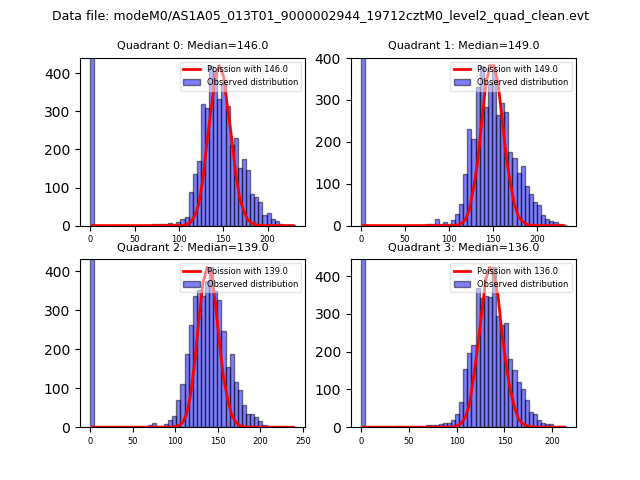 |
 |
| Quadrant-wise count rates Data is divided into 100 sec bins |
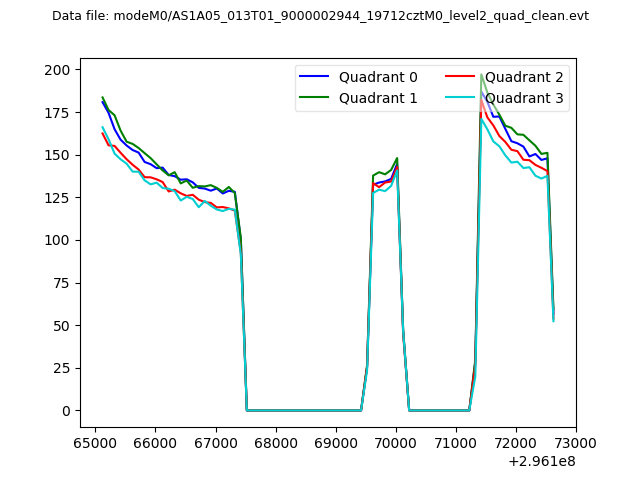 |
|
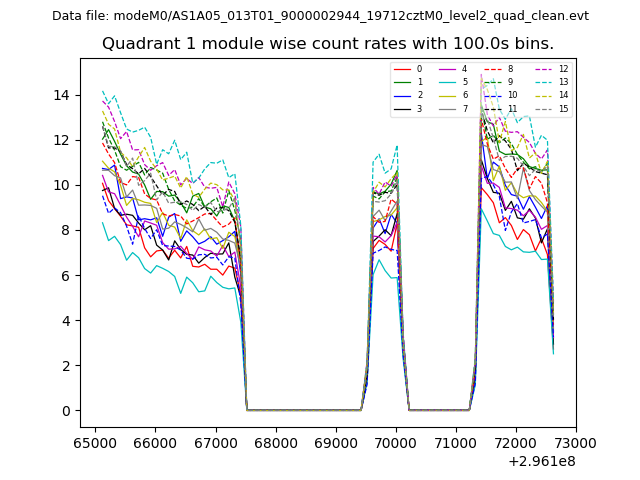
| Module-wise count rates for Quadrant A Data is divided into 100 sec bins |
 |
 |
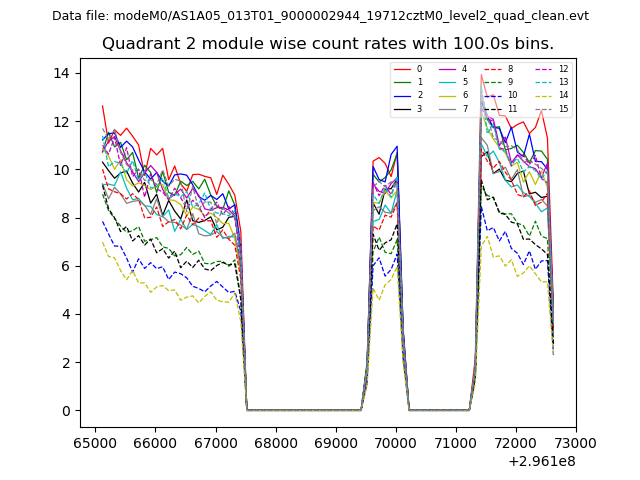
| Module-wise count rates for Quadrant B Data is divided into 100 sec bins |
 |
 |
| Module-wise count rates for Quadrant C Data is divided into 100 sec bins |
 |
 |
| Module-wise count rates for Quadrant D Data is divided into 100 sec bins |
 |
 |
| Parameter | Plot |
|---|---|
| CZT HV Monitor | 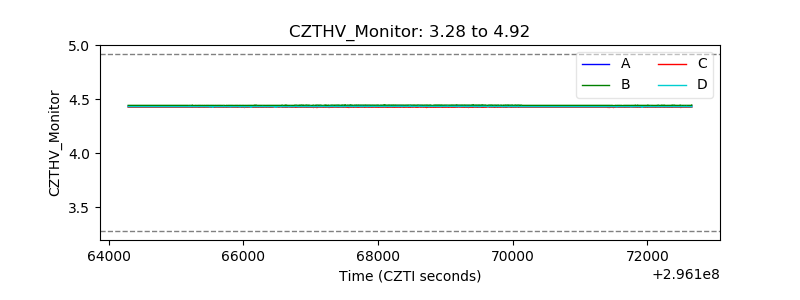 |
| D_VDD | 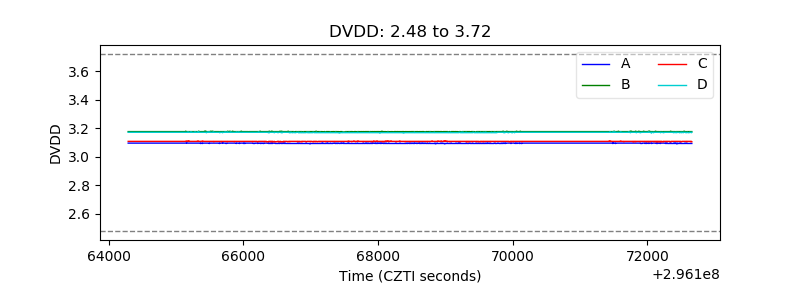 |
| Temperature 1 | 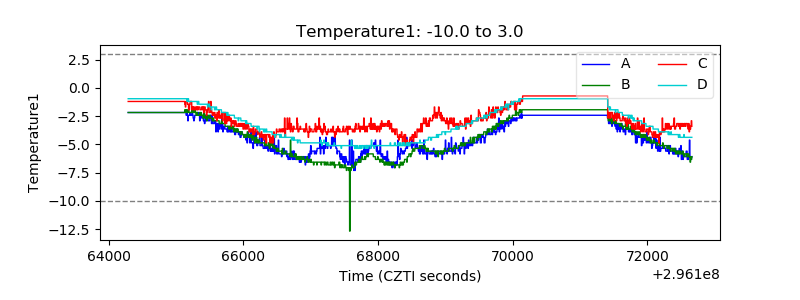 |
| Veto HV Monitor | 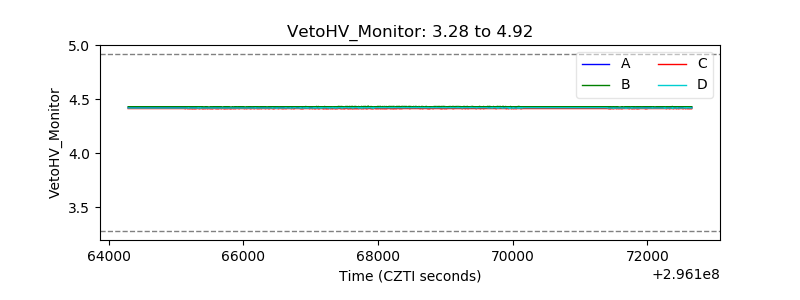 |
| Veto LLD | 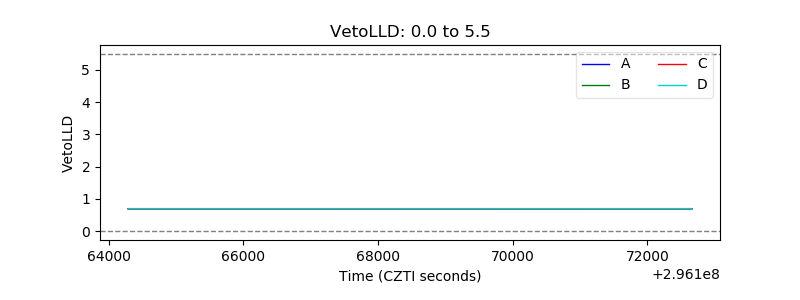 |
| Alpha Counter | 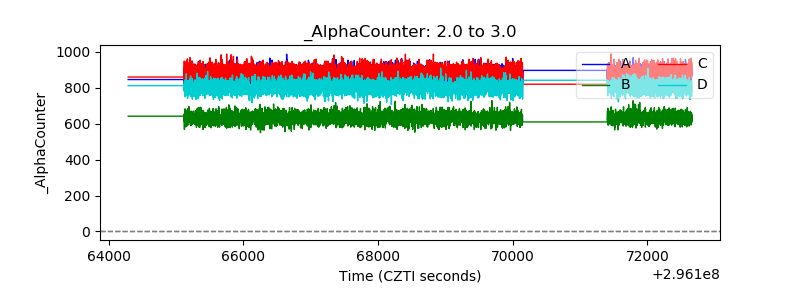 |
| _CPM_Rate | 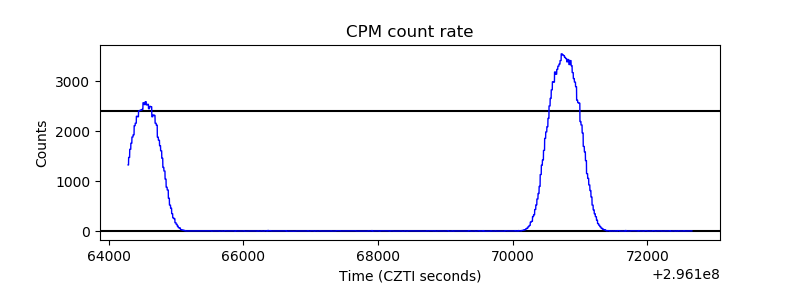 |
| CZT Counter | 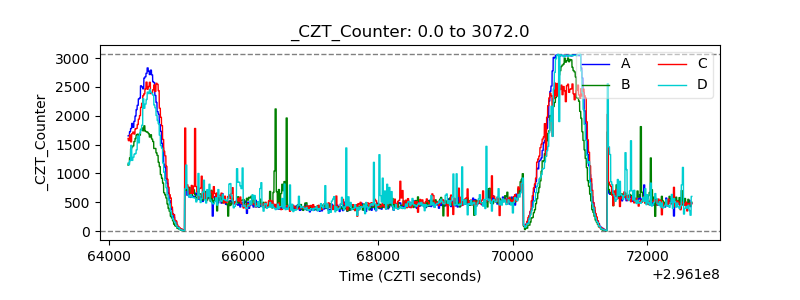 |
| +2.5 Volts monitor |  |
| +5 Volts monitor |  |
| _ROLL_ROT | 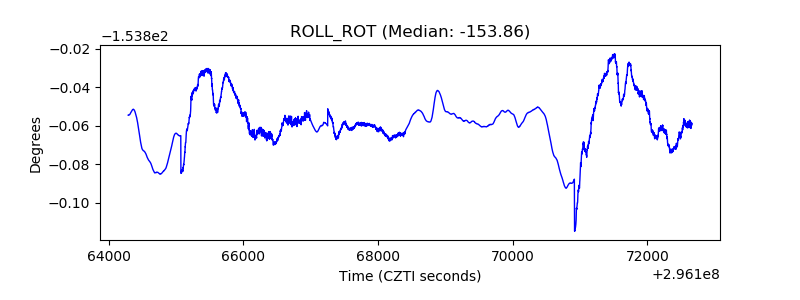 |
| _Roll_DEC | 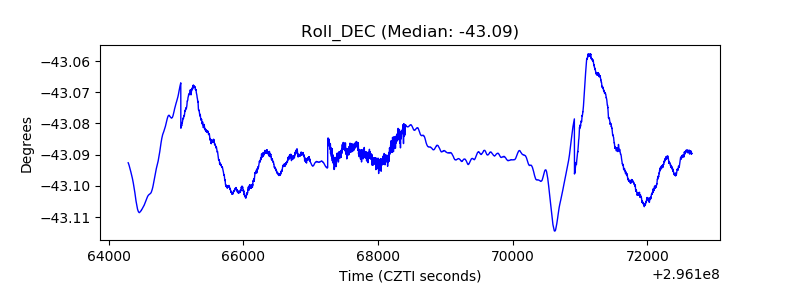 |
| _Roll_RA | 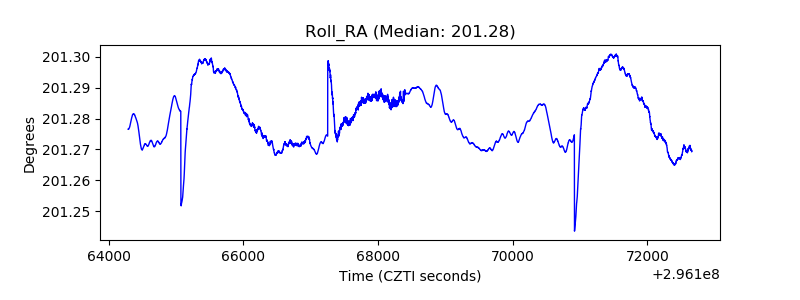 |
| Veto Counter | 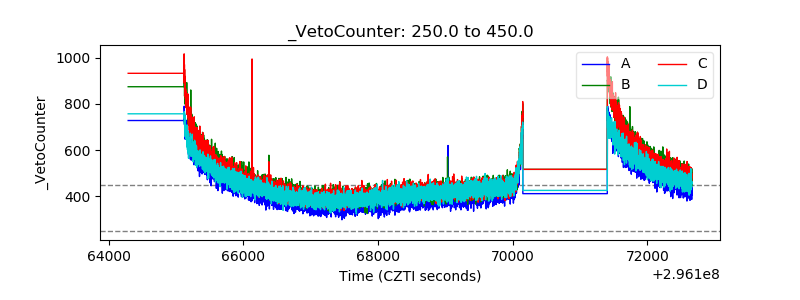 |