| Param | Original file | Final file |
|---|---|---|
| Filename | modeM0/AS1A05_013T01_9000002944_19713cztM0_level2.evt | modeM0/AS1A05_013T01_9000002944_19713cztM0_level2_quad_clean.evt |
| Size (bytes) | 436,864,320 | 94,006,080 |
| Size | 416.6 MB | 89.7 MB |
| Events in quadrant A | 3,034,056 | 616,048 |
| Events in quadrant B | 3,284,456 | 637,303 |
| Events in quadrant C | 3,196,058 | 597,581 |
| Events in quadrant D | 3,302,766 | 571,525 |
| Mode SS | |||
|---|---|---|---|
| Quadrant | BADHDUFLAG | Total packets | Discarded packets |
| A | 0 | 124 | 0 |
| B | 0 | 124 | 0 |
| C | 0 | 124 | 0 |
| D | 0 | 124 | 0 |
| Mode M0 | |||
|---|---|---|---|
| Quadrant | BADHDUFLAG | Total packets | Discarded packets |
| A | 0 | 12840 | 2 |
| B | 0 | 13578 | 2 |
| C | 0 | 13172 | 2 |
| D | 0 | 13757 | 2 |
| Mode M9 | |||
|---|---|---|---|
| Quadrant | BADHDUFLAG | Total packets | Discarded packets |
| A | 0 | 19 | 0 |
| B | 0 | 20 | 0 |
| C | 0 | 20 | 0 |
| D | 0 | 20 | 0 |
| Quadrant | Total seconds | Saturated seconds | Saturation percentage |
|---|---|---|---|
| A | 6078 | 14 | 0.230339% |
| B | 6078 | 43 | 0.707470% |
| C | 6078 | 56 | 0.921356% |
| D | 6078 | 42 | 0.691017% |
Noise dominated data is calculated using 1-second bins in cleaned event files. If a bin has >2000 counts, and if more than 50% of those come from <1% of pixels, then it is considered to be noise-dominated and hence unusable.
| Quadrant | # 1 sec bins | Bins with >0 counts | Bins with >2000 counts | High rate bins dominated by noise | Noise dominated (total time) | Noise dominated (detector-on time) | Marked lightcurve |
|---|---|---|---|---|---|---|---|
| A | 7418 | 6079 | 0 | 0 | 0.00% | 0.00% | 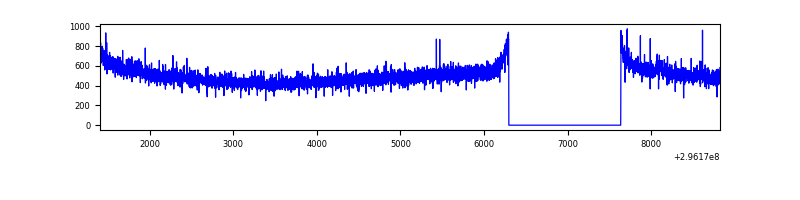 |
| B | 7418 | 6079 | 14 | 14 | 0.19% | 0.23% | 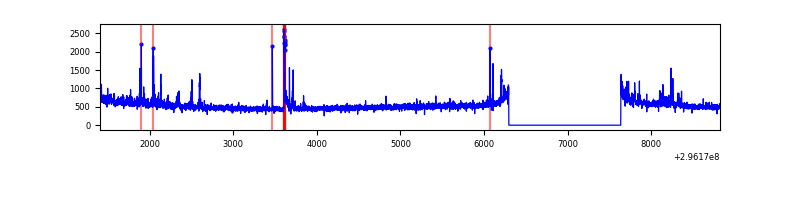 |
| C | 7418 | 6079 | 2 | 2 | 0.03% | 0.03% | 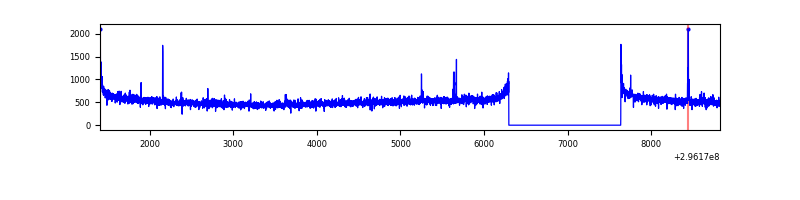 |
| D | 7418 | 6079 | 30 | 30 | 0.40% | 0.49% | 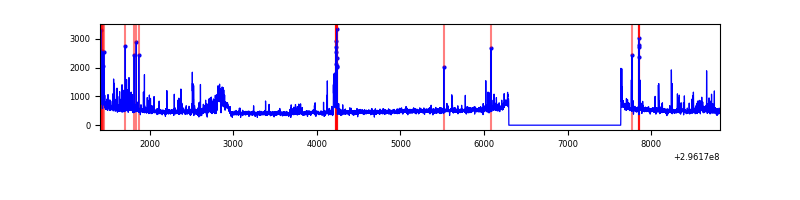 |
Top three noisy pixels from each quadrant. If the there are fewer than three noisy pixels in the level2.evt file, extra rows are filled as -1
| Pixel properties | Quadrant properties | ||||||
|---|---|---|---|---|---|---|---|
| Quadrant | DetID | PixID | Counts | Sigma | Mean | Median | Sigma |
| A | 11 | 29 | 21083 | 129.64 | 782 | 767 | 156.7 |
| A | 0 | 226 | 6752 | 38.19 | 782 | 767 | 156.7 |
| A | 13 | 254 | 6047 | 33.69 | 782 | 767 | 156.7 |
| B | 0 | 197 | 55084 | 369.05 | 791 | 774 | 147.2 |
| B | 0 | 182 | 49164 | 328.83 | 791 | 774 | 147.2 |
| B | 4 | 171 | 30729 | 203.55 | 791 | 774 | 147.2 |
| C | 14 | 238 | 121841 | 697.28 | 754 | 759 | 173.6 |
| C | 3 | 233 | 100987 | 577.19 | 754 | 759 | 173.6 |
| C | 7 | 247 | 15704 | 86.06 | 754 | 759 | 173.6 |
| D | 12 | 218 | 98309 | 535.68 | 751 | 731 | 182.2 |
| D | 1 | 52 | 96142 | 523.79 | 751 | 731 | 182.2 |
| D | 12 | 225 | 83407 | 453.88 | 751 | 731 | 182.2 |
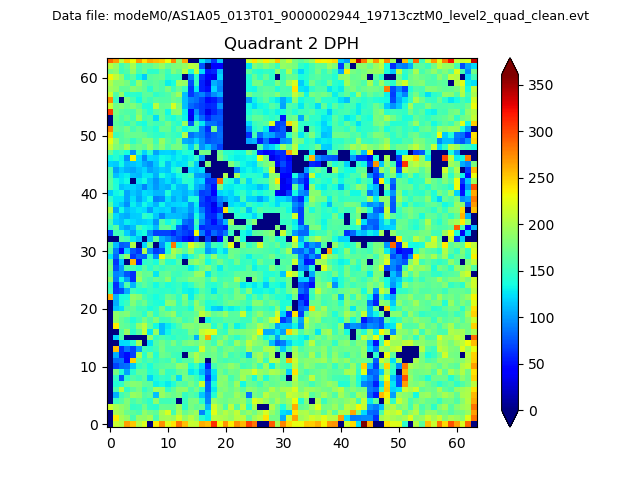
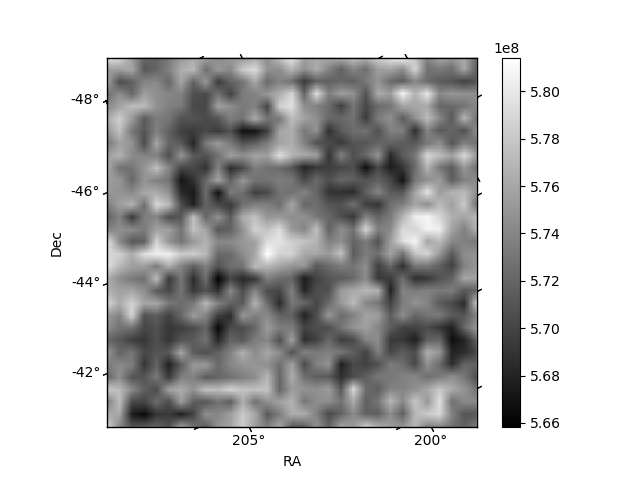
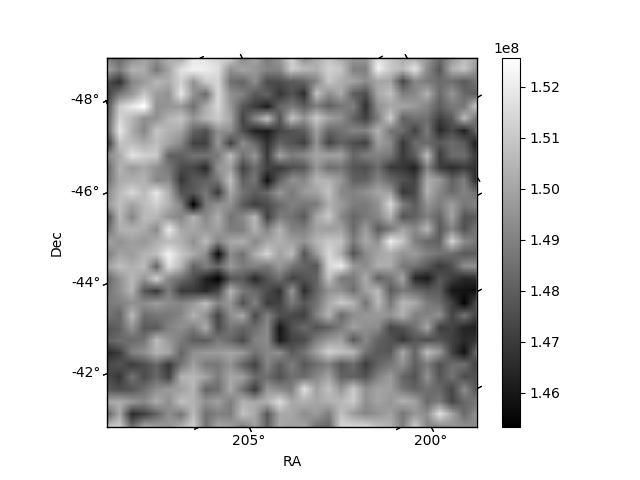
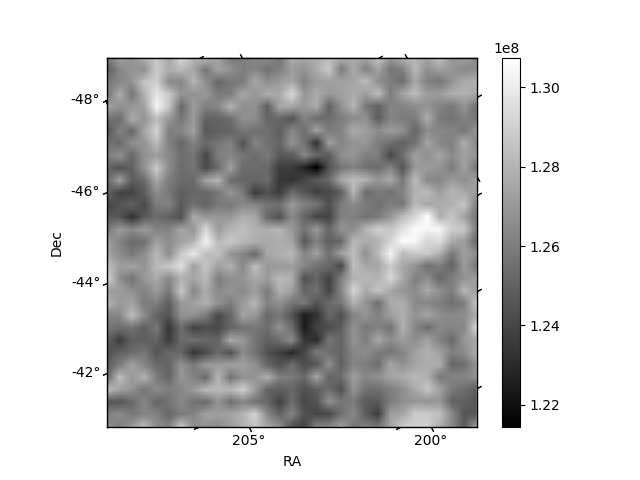
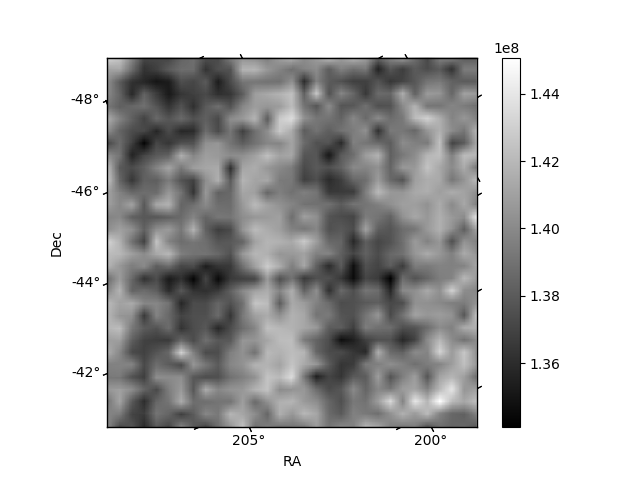
Histogram calculated using DETX and DETY for each event in the final _common_clean file
| Quadrant A | 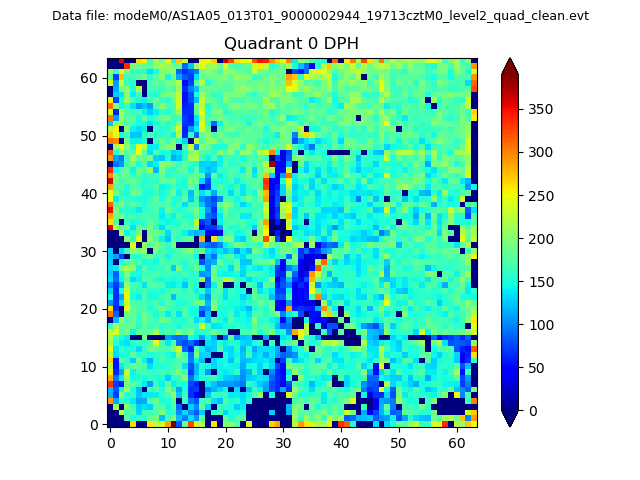 |
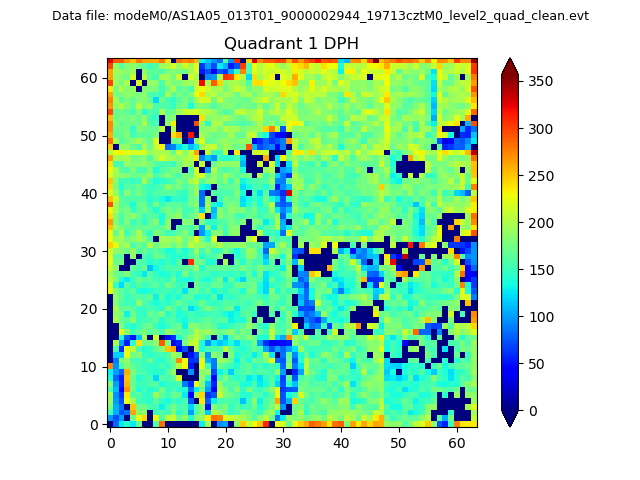 |
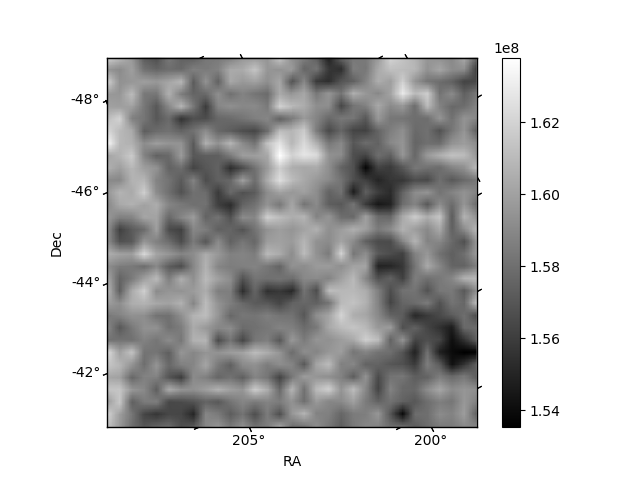
Quadrant B |
|---|---|---|---|
| Quadrant D | 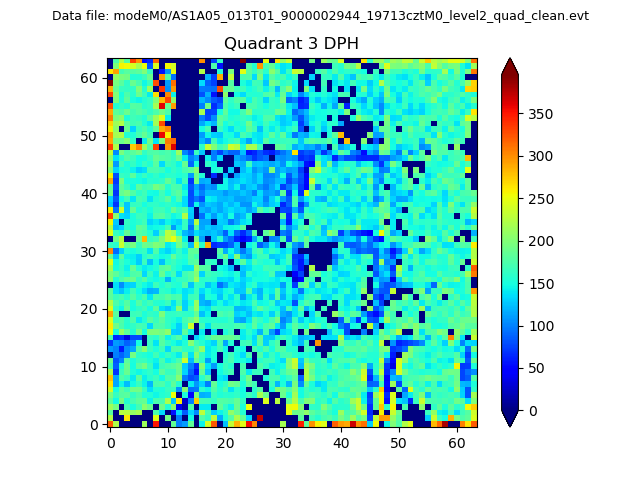 |
 |
Quadrant C |
| Plot type | Count rate plots | Images |
|---|---|---|
| Comparison with Poisson distribution Blue bars denote a histogram of data divided into 1 sec bins. Red curve is a Poisson curve with rate = median count rate of data. |
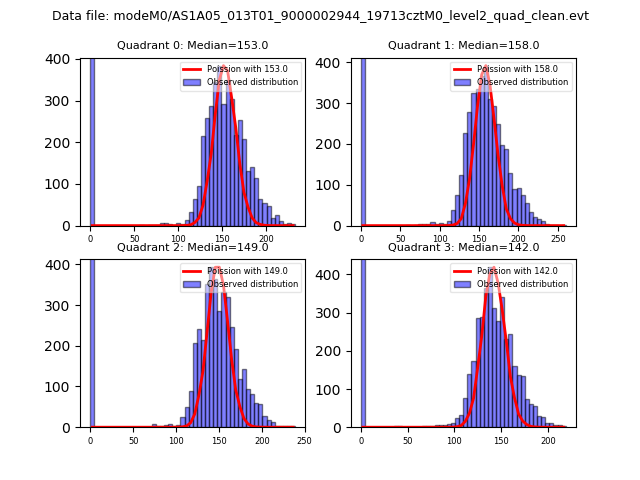 |
 |
| Quadrant-wise count rates Data is divided into 100 sec bins |
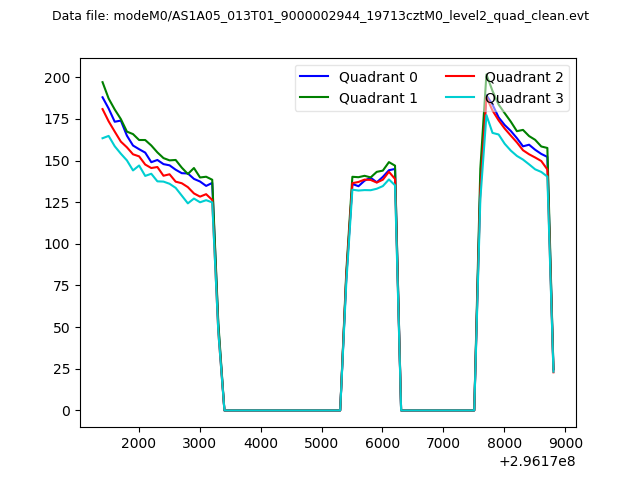 |
|
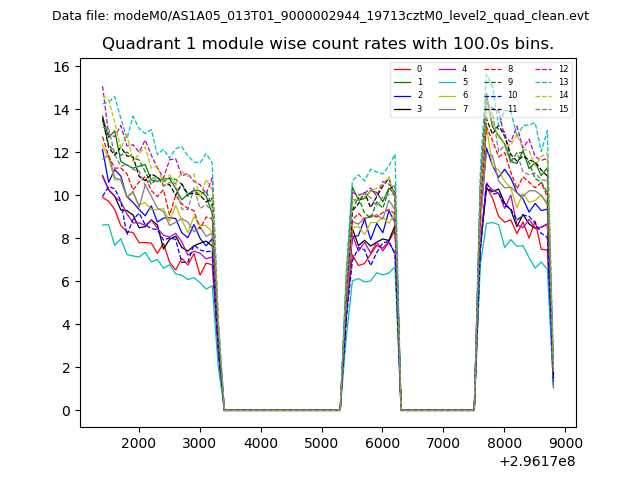
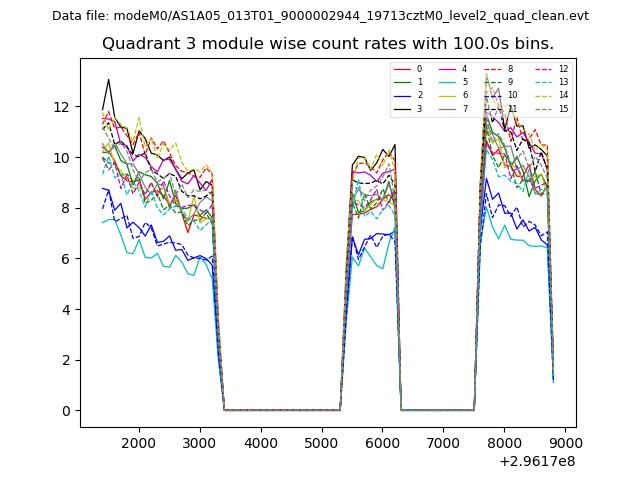
| Module-wise count rates for Quadrant A Data is divided into 100 sec bins |
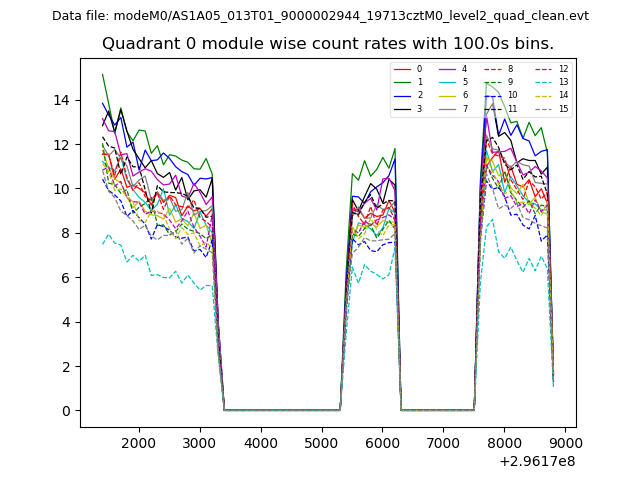 |
 |
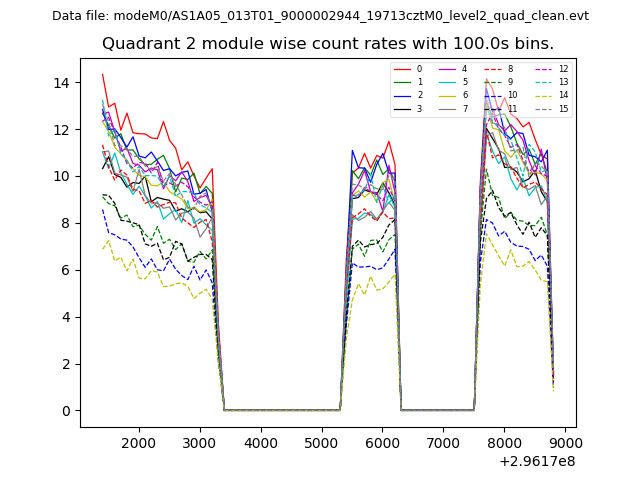
| Module-wise count rates for Quadrant B Data is divided into 100 sec bins |
 |
 |
| Module-wise count rates for Quadrant C Data is divided into 100 sec bins |
 |
 |
| Module-wise count rates for Quadrant D Data is divided into 100 sec bins |
 |
 |
| Parameter | Plot |
|---|---|
| CZT HV Monitor | 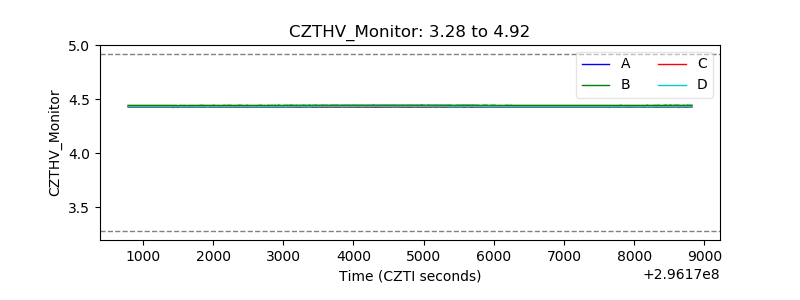 |
| D_VDD | 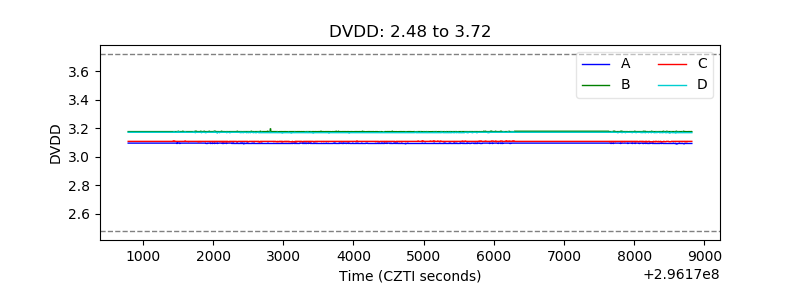 |
| Temperature 1 |  |
| Veto HV Monitor | 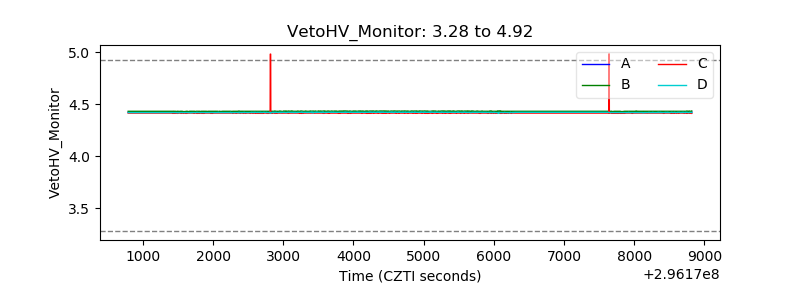 |
| Veto LLD | 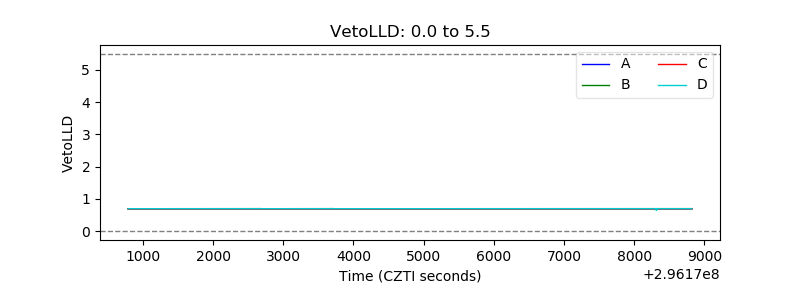 |
| Alpha Counter | 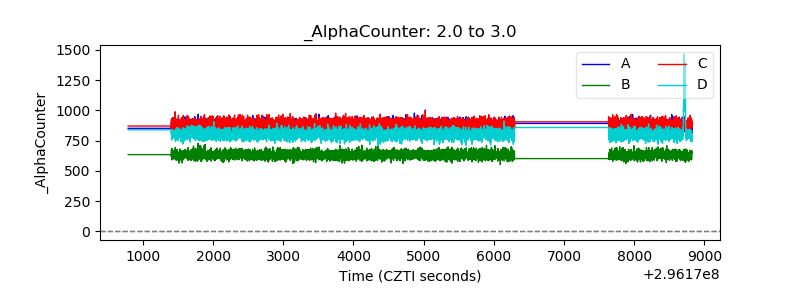 |
| _CPM_Rate | 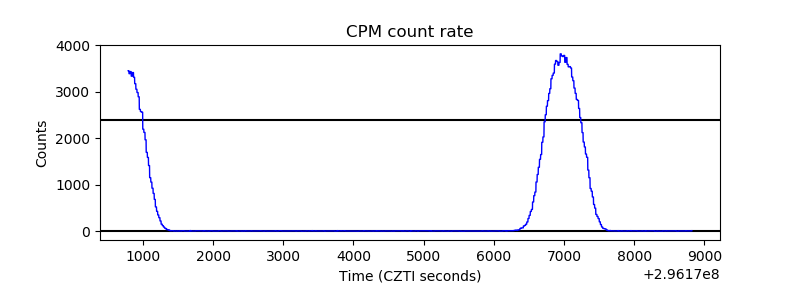 |
| CZT Counter | 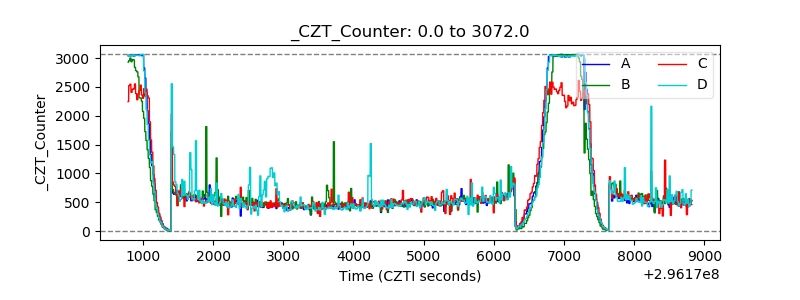 |
| +2.5 Volts monitor |  |
| +5 Volts monitor |  |
| _ROLL_ROT | 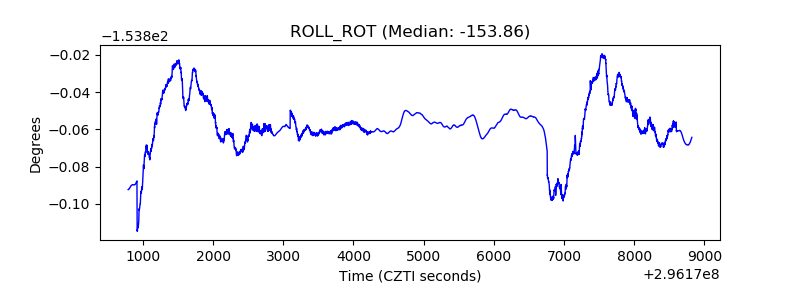 |
| _Roll_DEC |  |
| _Roll_RA | 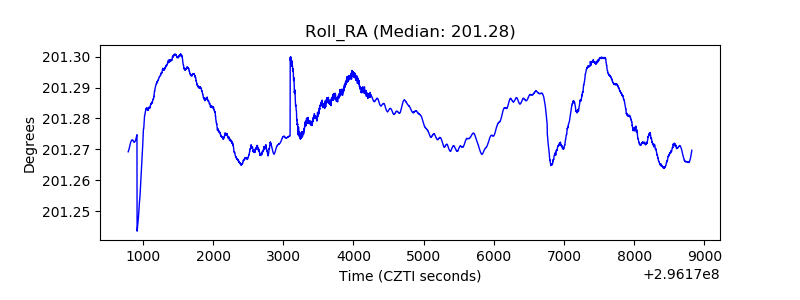 |
| Veto Counter | 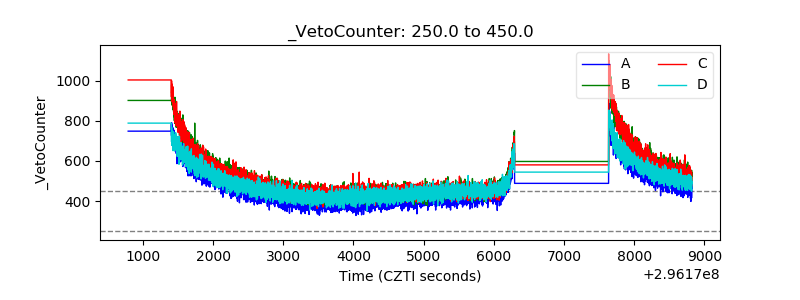 |