| Param | Original file | Final file |
|---|---|---|
| Filename | modeM0/AS1A05_013T01_9000002944_19714cztM0_level2.evt | modeM0/AS1A05_013T01_9000002944_19714cztM0_level2_quad_clean.evt |
| Size (bytes) | 446,581,440 | 94,386,240 |
| Size | 425.9 MB | 90.0 MB |
| Events in quadrant A | 3,097,677 | 613,319 |
| Events in quadrant B | 3,447,570 | 638,780 |
| Events in quadrant C | 3,346,842 | 600,606 |
| Events in quadrant D | 3,216,681 | 578,205 |
| Mode SS | |||
|---|---|---|---|
| Quadrant | BADHDUFLAG | Total packets | Discarded packets |
| A | 0 | 124 | 0 |
| B | 0 | 124 | 0 |
| C | 0 | 124 | 0 |
| D | 0 | 124 | 0 |
| Mode M0 | |||
|---|---|---|---|
| Quadrant | BADHDUFLAG | Total packets | Discarded packets |
| A | 0 | 12870 | 2 |
| B | 0 | 13899 | 2 |
| C | 0 | 13521 | 2 |
| D | 0 | 13471 | 2 |
| Mode M9 | |||
|---|---|---|---|
| Quadrant | BADHDUFLAG | Total packets | Discarded packets |
| A | 0 | 19 | 0 |
| B | 0 | 20 | 0 |
| C | 0 | 20 | 0 |
| D | 0 | 20 | 0 |
| Quadrant | Total seconds | Saturated seconds | Saturation percentage |
|---|---|---|---|
| A | 6125 | 20 | 0.326531% |
| B | 6125 | 93 | 1.518367% |
| C | 6125 | 64 | 1.044898% |
| D | 6125 | 42 | 0.685714% |
Noise dominated data is calculated using 1-second bins in cleaned event files. If a bin has >2000 counts, and if more than 50% of those come from <1% of pixels, then it is considered to be noise-dominated and hence unusable.
| Quadrant | # 1 sec bins | Bins with >0 counts | Bins with >2000 counts | High rate bins dominated by noise | Noise dominated (total time) | Noise dominated (detector-on time) | Marked lightcurve |
|---|---|---|---|---|---|---|---|
| A | 7530 | 6126 | 0 | 0 | 0.00% | 0.00% | 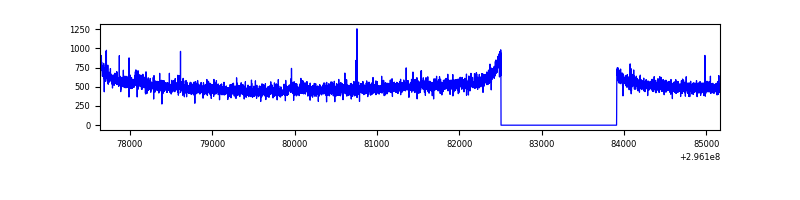 |
| B | 7530 | 6126 | 43 | 43 | 0.57% | 0.70% | 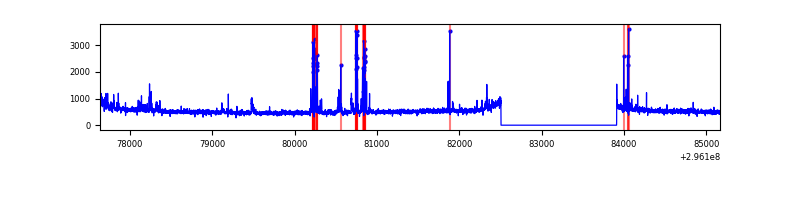 |
| C | 7530 | 6126 | 1 | 1 | 0.01% | 0.02% | 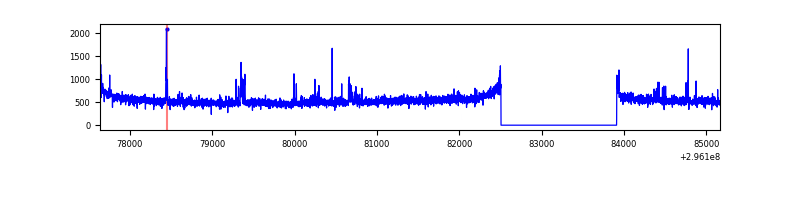 |
| D | 7530 | 6126 | 20 | 20 | 0.27% | 0.33% | 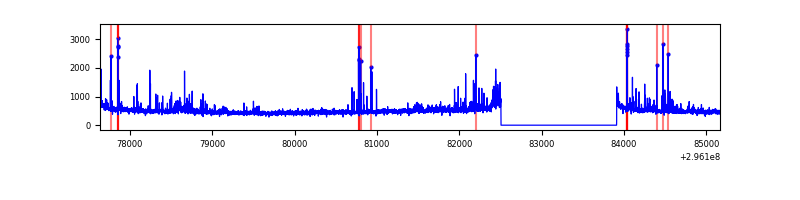 |
Top three noisy pixels from each quadrant. If the there are fewer than three noisy pixels in the level2.evt file, extra rows are filled as -1
| Pixel properties | Quadrant properties | ||||||
|---|---|---|---|---|---|---|---|
| Quadrant | DetID | PixID | Counts | Sigma | Mean | Median | Sigma |
| A | 11 | 29 | 17712 | 106.0 | 799 | 785 | 159.7 |
| A | 0 | 226 | 7022 | 39.06 | 799 | 785 | 159.7 |
| A | 3 | 137 | 6064 | 33.06 | 799 | 785 | 159.7 |
| B | 3 | 64 | 202252 | 1348.49 | 808 | 789 | 149.4 |
| B | 7 | 220 | 25729 | 166.94 | 808 | 789 | 149.4 |
| B | 0 | 197 | 19252 | 123.58 | 808 | 789 | 149.4 |
| C | 14 | 238 | 125038 | 699.52 | 776 | 785 | 177.6 |
| C | 3 | 233 | 94817 | 529.38 | 776 | 785 | 177.6 |
| C | 9 | 54 | 56434 | 313.29 | 776 | 785 | 177.6 |
| D | 1 | 52 | 99528 | 527.8 | 775 | 753 | 187.1 |
| D | 12 | 218 | 83944 | 444.53 | 775 | 753 | 187.1 |
| D | 12 | 225 | 61750 | 325.93 | 775 | 753 | 187.1 |
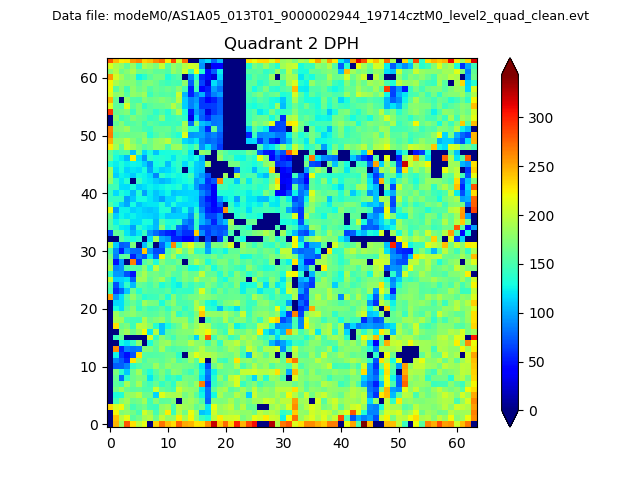
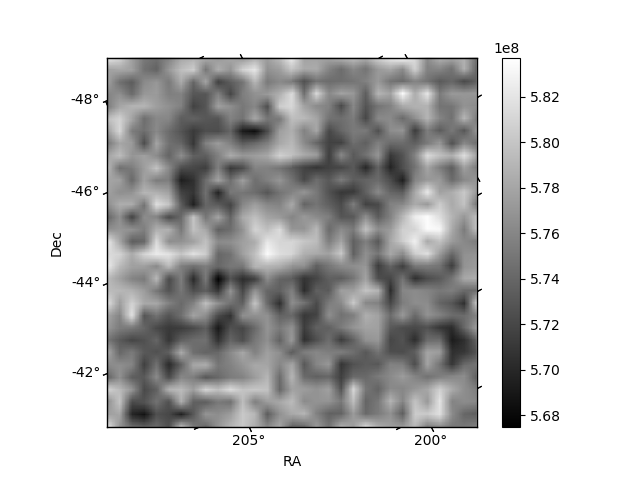
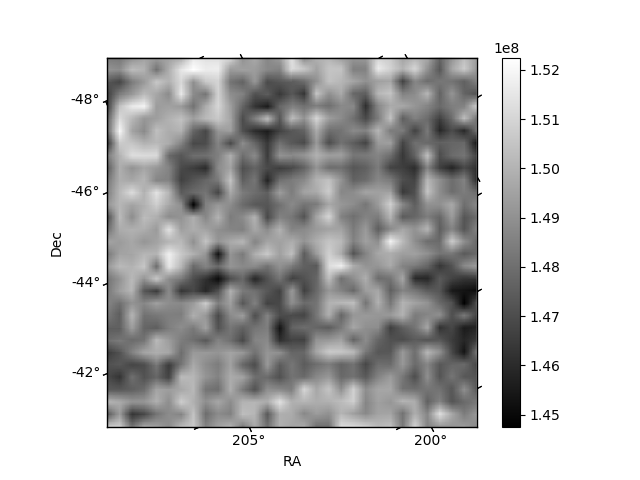
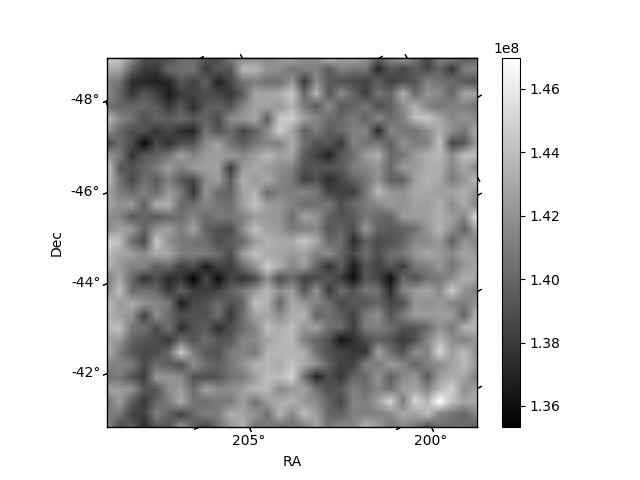
Histogram calculated using DETX and DETY for each event in the final _common_clean file
| Quadrant A | 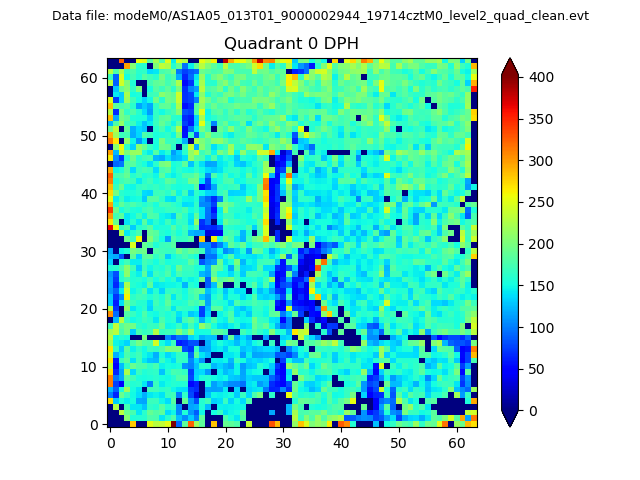 |
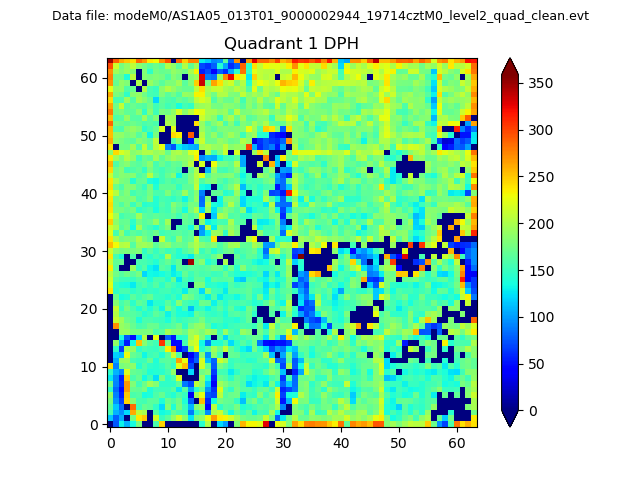 |
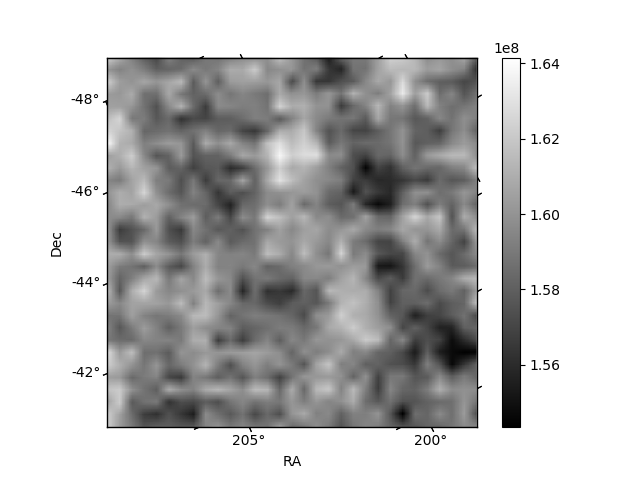
Quadrant B |
|---|---|---|---|
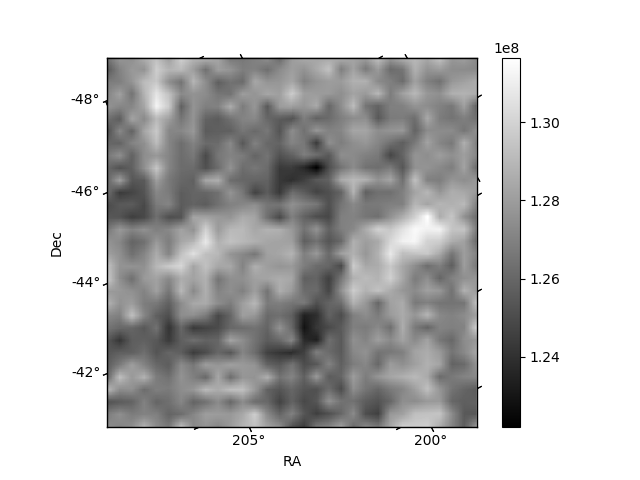
| Quadrant D | 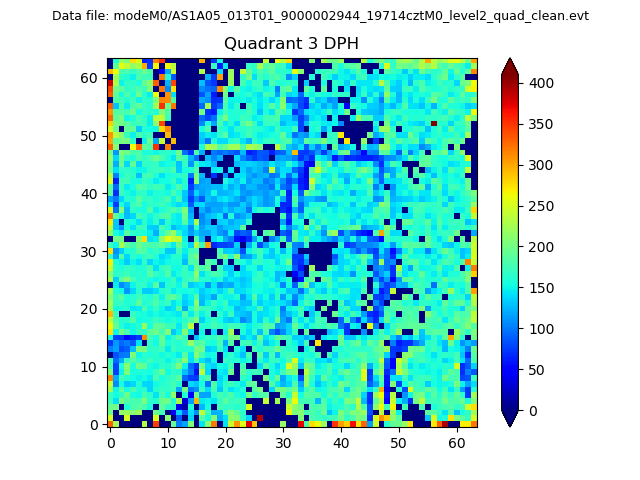 |
 |
Quadrant C |
| Plot type | Count rate plots | Images |
|---|---|---|
| Comparison with Poisson distribution Blue bars denote a histogram of data divided into 1 sec bins. Red curve is a Poisson curve with rate = median count rate of data. |
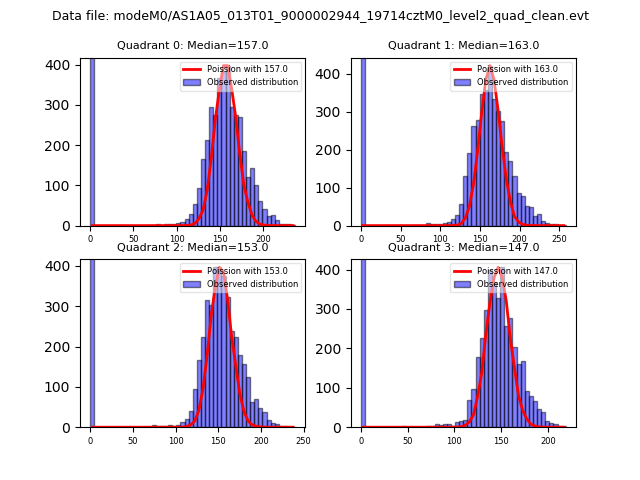 |
 |
| Quadrant-wise count rates Data is divided into 100 sec bins |
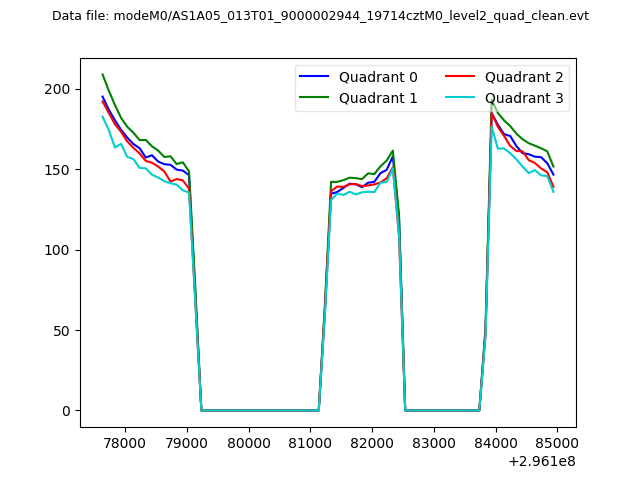 |
|
| Module-wise count rates for Quadrant A Data is divided into 100 sec bins |
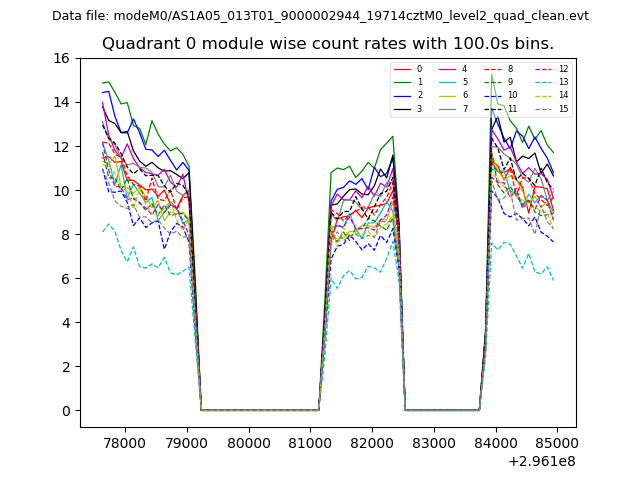 |
 |
| Module-wise count rates for Quadrant B Data is divided into 100 sec bins |
 |
 |
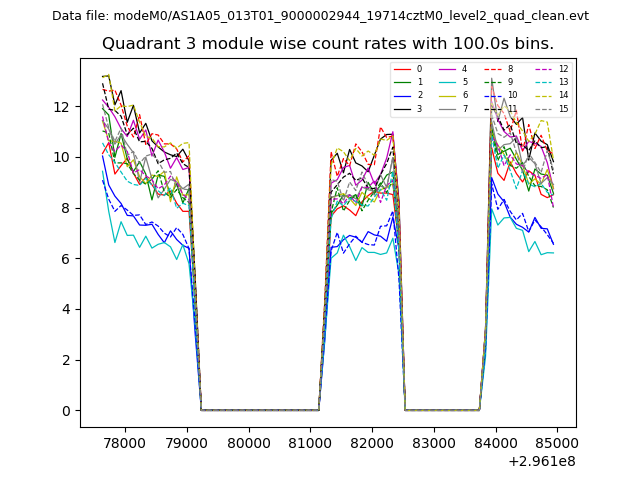
| Module-wise count rates for Quadrant C Data is divided into 100 sec bins |
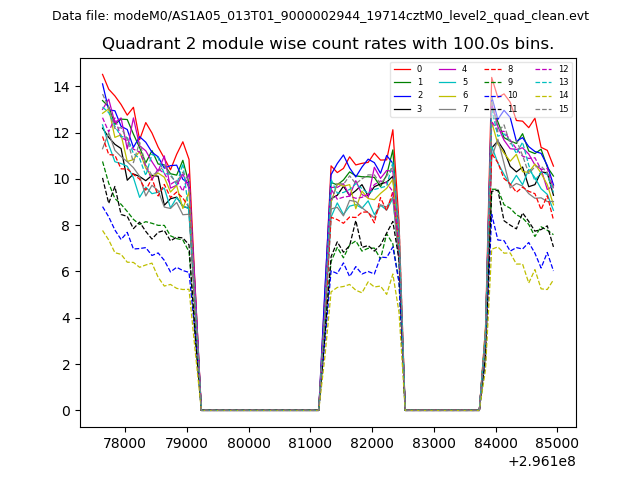 |
 |
| Module-wise count rates for Quadrant D Data is divided into 100 sec bins |
 |
 |
| Parameter | Plot |
|---|---|
| CZT HV Monitor | 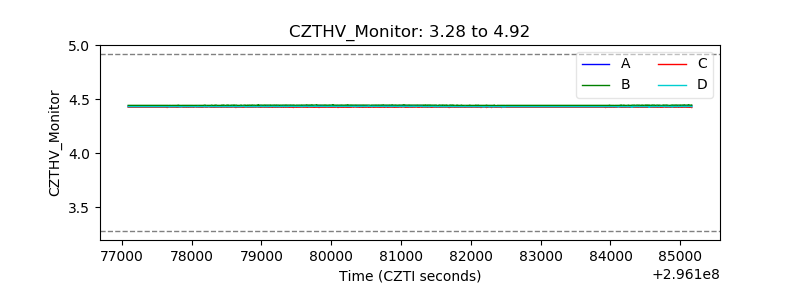 |
| D_VDD | 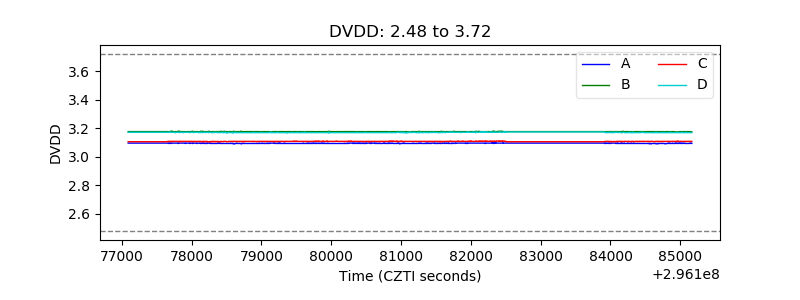 |
| Temperature 1 | 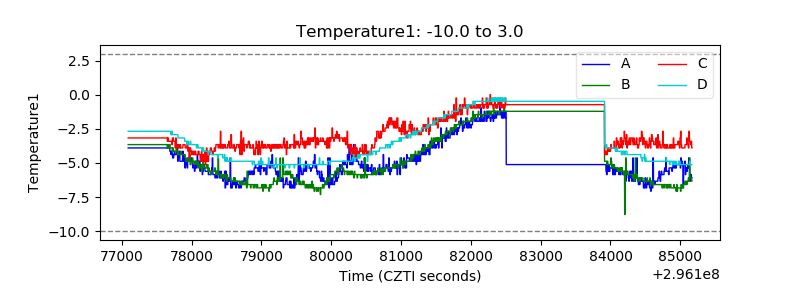 |
| Veto HV Monitor | 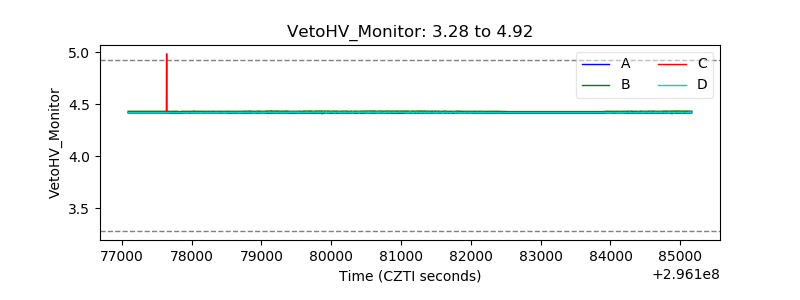 |
| Veto LLD | 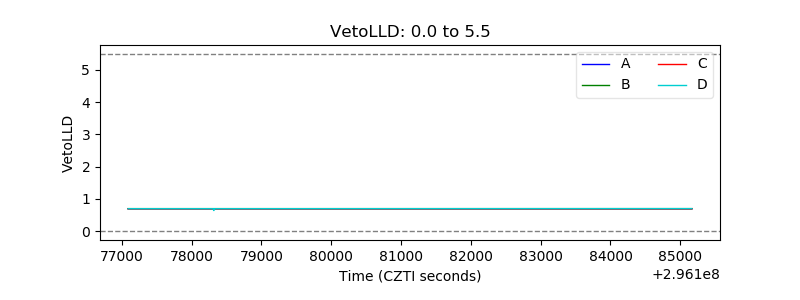 |
| Alpha Counter | 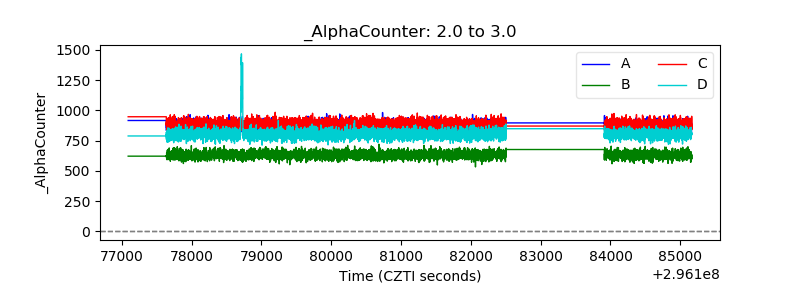 |
| _CPM_Rate | 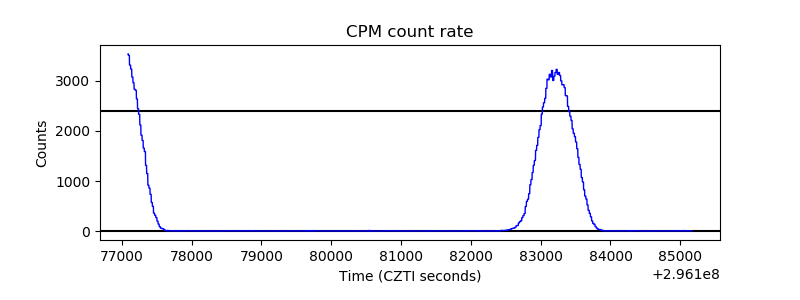 |
| CZT Counter | 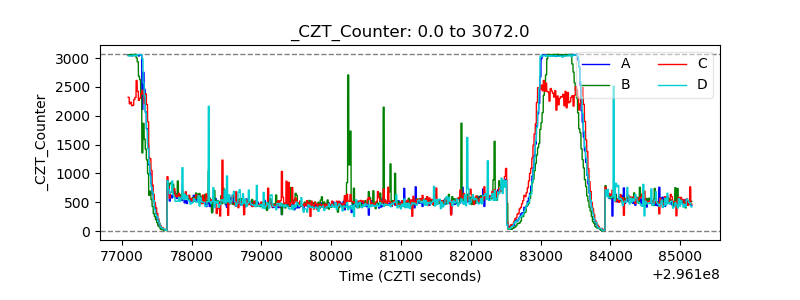 |
| +2.5 Volts monitor |  |
| +5 Volts monitor |  |
| _ROLL_ROT | 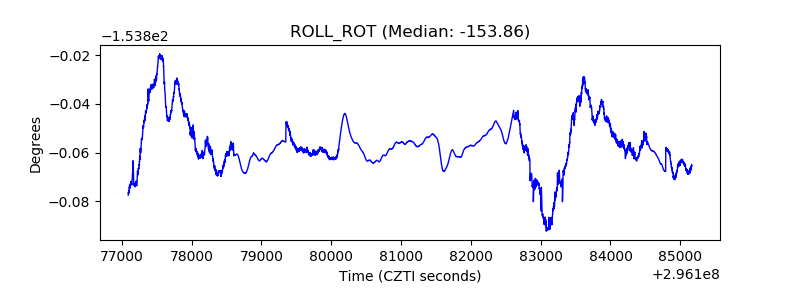 |
| _Roll_DEC |  |
| _Roll_RA | 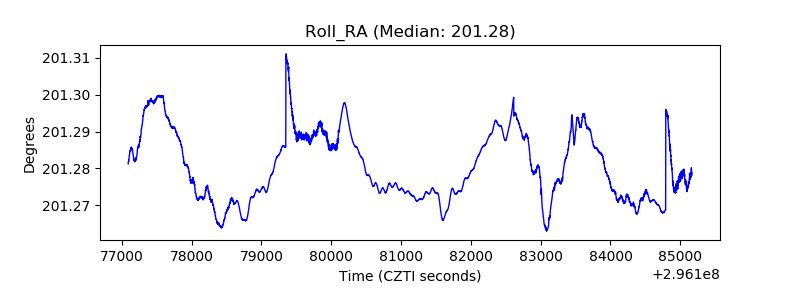 |
| Veto Counter | 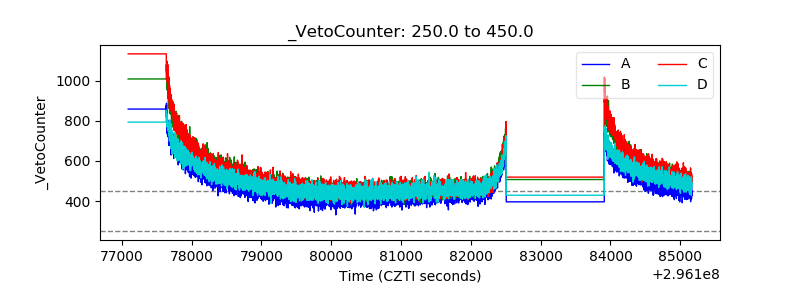 |