| Param | Original file | Final file |
|---|---|---|
| Filename | modeM0/AS1A05_013T01_9000002944_19715cztM0_level2.evt | modeM0/AS1A05_013T01_9000002944_19715cztM0_level2_quad_clean.evt |
| Size (bytes) | 452,661,120 | 84,836,160 |
| Size | 431.7 MB | 80.9 MB |
| Events in quadrant A | 3,213,671 | 536,981 |
| Events in quadrant B | 3,322,670 | 555,304 |
| Events in quadrant C | 3,382,756 | 527,452 |
| Events in quadrant D | 3,358,690 | 506,542 |
| Mode SS | |||
|---|---|---|---|
| Quadrant | BADHDUFLAG | Total packets | Discarded packets |
| A | 0 | 128 | 0 |
| B | 0 | 128 | 0 |
| C | 0 | 128 | 0 |
| D | 0 | 128 | 0 |
| Mode M0 | |||
|---|---|---|---|
| Quadrant | BADHDUFLAG | Total packets | Discarded packets |
| A | 0 | 13337 | 2 |
| B | 0 | 13613 | 2 |
| C | 0 | 13625 | 2 |
| D | 0 | 13943 | 2 |
| Mode M9 | |||
|---|---|---|---|
| Quadrant | BADHDUFLAG | Total packets | Discarded packets |
| A | 0 | 19 | 0 |
| B | 0 | 20 | 0 |
| C | 0 | 20 | 0 |
| D | 0 | 20 | 0 |
| Quadrant | Total seconds | Saturated seconds | Saturation percentage |
|---|---|---|---|
| A | 6348 | 14 | 0.220542% |
| B | 6348 | 37 | 0.582861% |
| C | 6348 | 50 | 0.787650% |
| D | 6348 | 62 | 0.976686% |
Noise dominated data is calculated using 1-second bins in cleaned event files. If a bin has >2000 counts, and if more than 50% of those come from <1% of pixels, then it is considered to be noise-dominated and hence unusable.
| Quadrant | # 1 sec bins | Bins with >0 counts | Bins with >2000 counts | High rate bins dominated by noise | Noise dominated (total time) | Noise dominated (detector-on time) | Marked lightcurve |
|---|---|---|---|---|---|---|---|
| A | 7723 | 6349 | 1 | 1 | 0.01% | 0.02% | 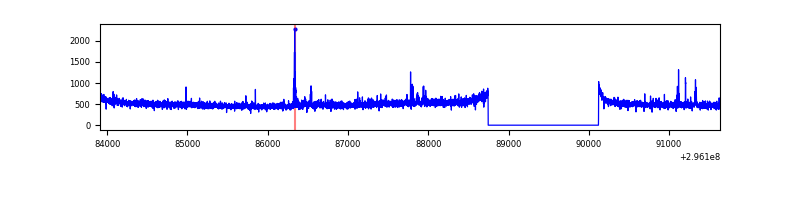 |
| B | 7723 | 6348 | 7 | 7 | 0.09% | 0.11% | 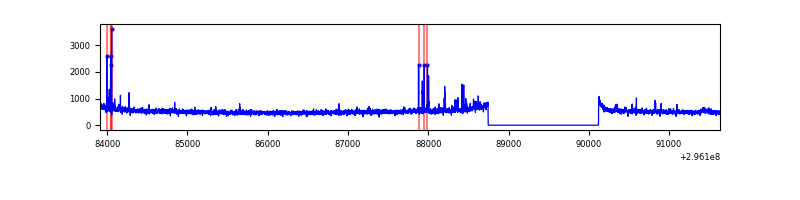 |
| C | 7723 | 6349 | 0 | 0 | 0.00% | 0.00% | 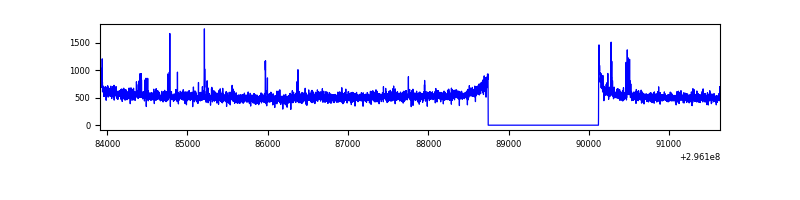 |
| D | 7723 | 6348 | 31 | 31 | 0.40% | 0.49% | 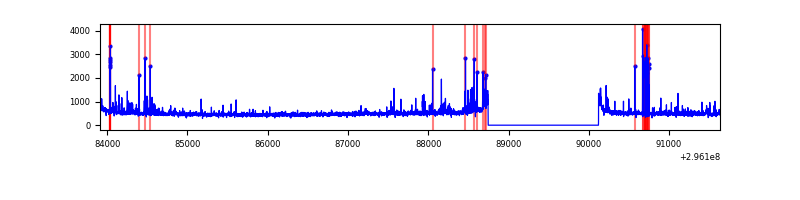 |
Top three noisy pixels from each quadrant. If the there are fewer than three noisy pixels in the level2.evt file, extra rows are filled as -1
| Pixel properties | Quadrant properties | ||||||
|---|---|---|---|---|---|---|---|
| Quadrant | DetID | PixID | Counts | Sigma | Mean | Median | Sigma |
| A | 10 | 253 | 51206 | 308.18 | 817 | 803 | 163.5 |
| A | 0 | 23 | 17764 | 103.71 | 817 | 803 | 163.5 |
| A | 0 | 226 | 7929 | 43.57 | 817 | 803 | 163.5 |
| B | 7 | 220 | 31258 | 198.54 | 826 | 807 | 153.4 |
| B | 4 | 171 | 26916 | 170.23 | 826 | 807 | 153.4 |
| B | 12 | 111 | 18099 | 112.74 | 826 | 807 | 153.4 |
| C | 14 | 238 | 127756 | 695.36 | 797 | 805 | 182.6 |
| C | 3 | 233 | 70454 | 381.49 | 797 | 805 | 182.6 |
| C | 7 | 247 | 45809 | 246.5 | 797 | 805 | 182.6 |
| D | 1 | 52 | 173663 | 896.18 | 795 | 773 | 192.9 |
| D | 12 | 218 | 62697 | 320.99 | 795 | 773 | 192.9 |
| D | 2 | 16 | 60998 | 312.18 | 795 | 773 | 192.9 |
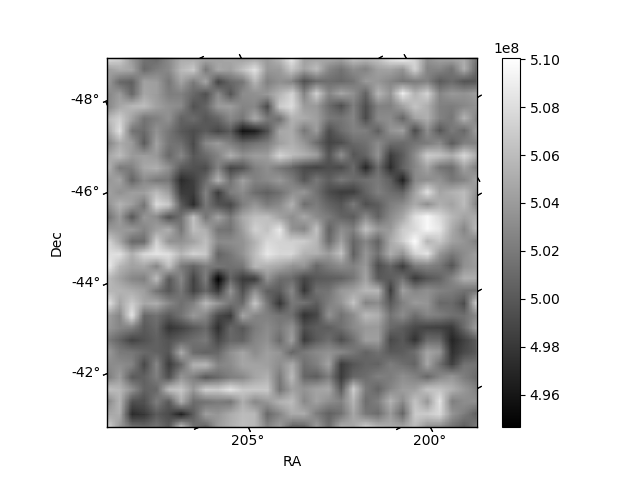
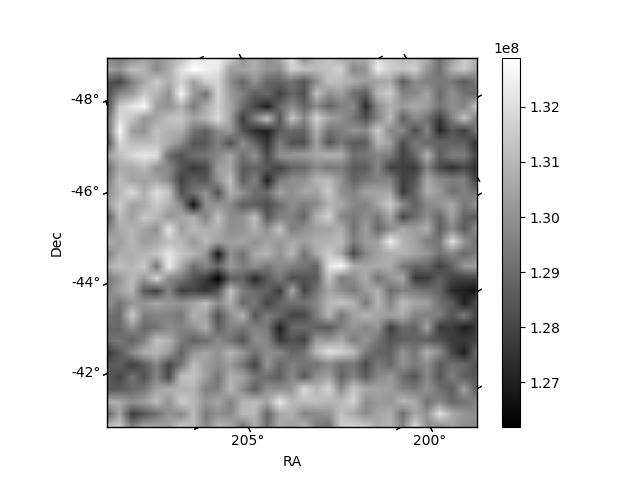
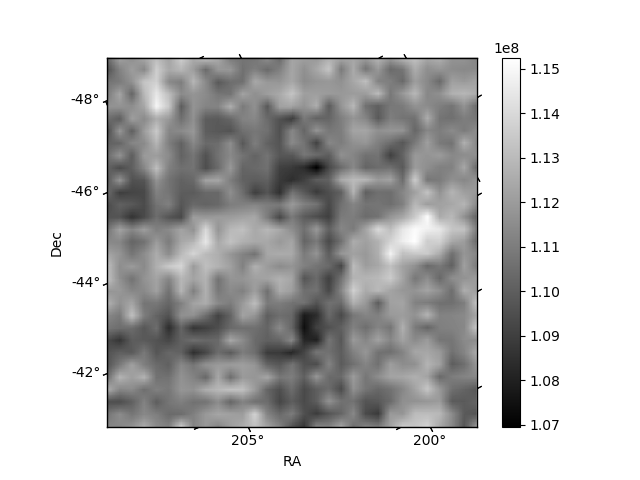
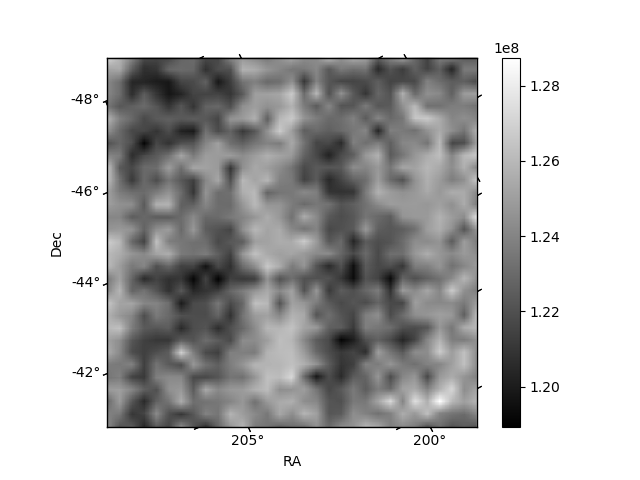
Histogram calculated using DETX and DETY for each event in the final _common_clean file
| Quadrant A | 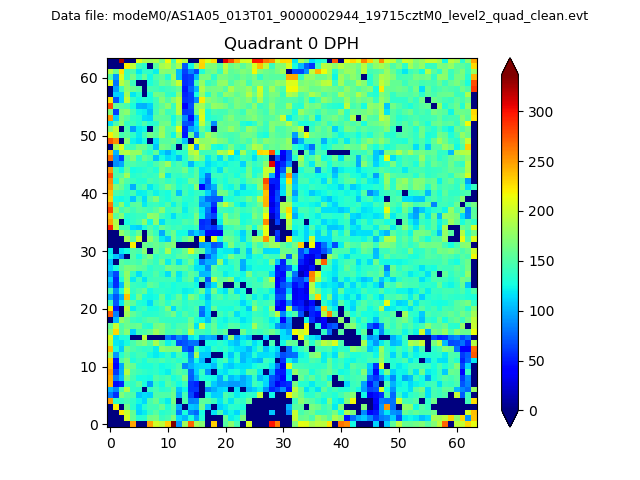 |
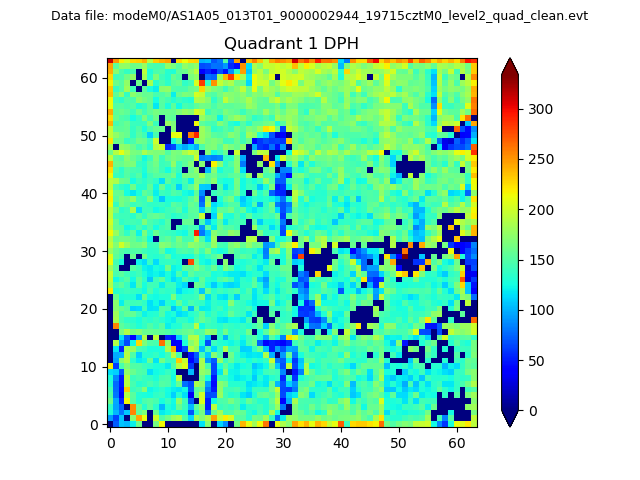 |
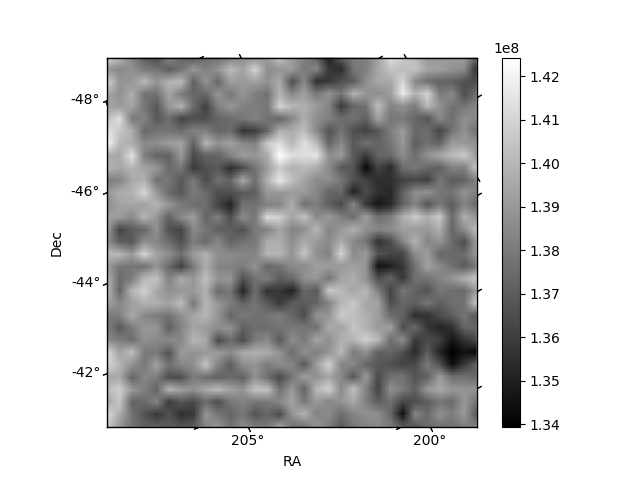
Quadrant B |
|---|---|---|---|
| Quadrant D | 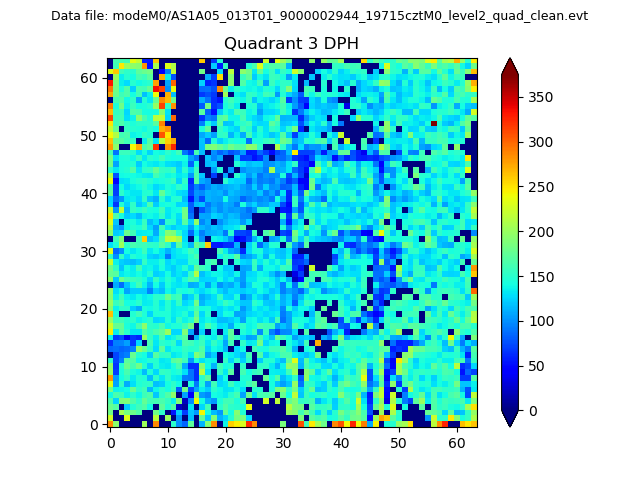 |
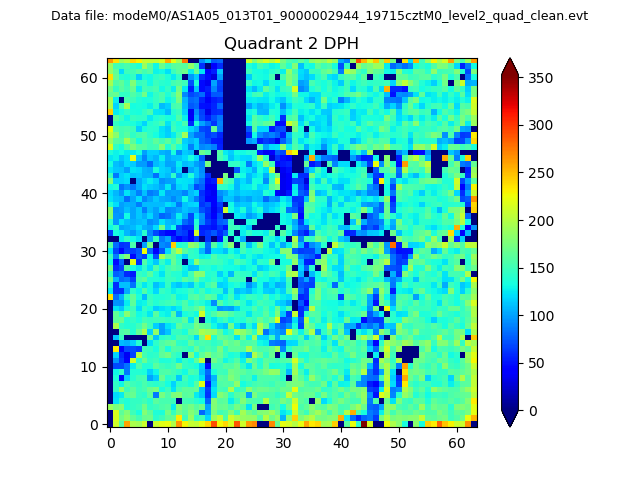 |
Quadrant C |
| Plot type | Count rate plots | Images |
|---|---|---|
| Comparison with Poisson distribution Blue bars denote a histogram of data divided into 1 sec bins. Red curve is a Poisson curve with rate = median count rate of data. |
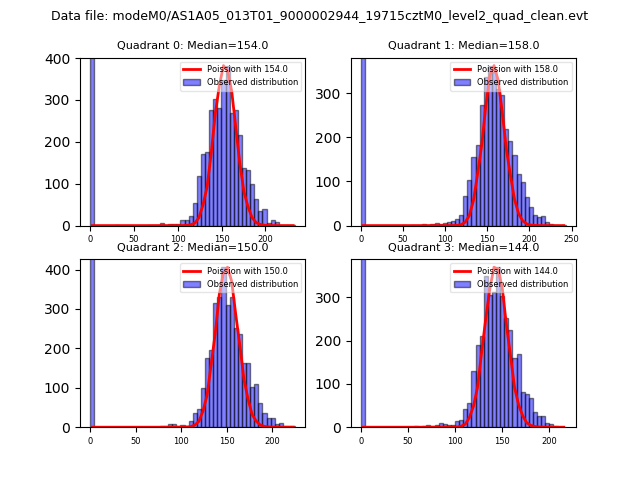 |
 |
| Quadrant-wise count rates Data is divided into 100 sec bins |
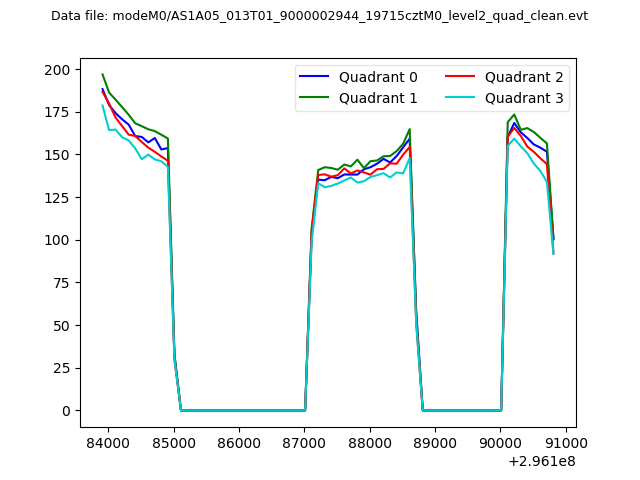 |
|
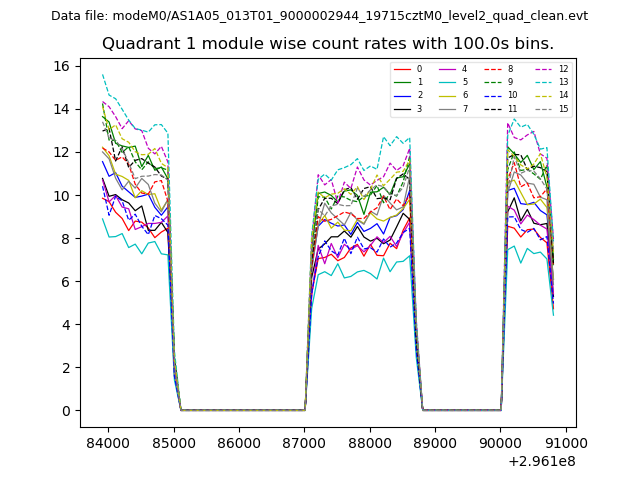
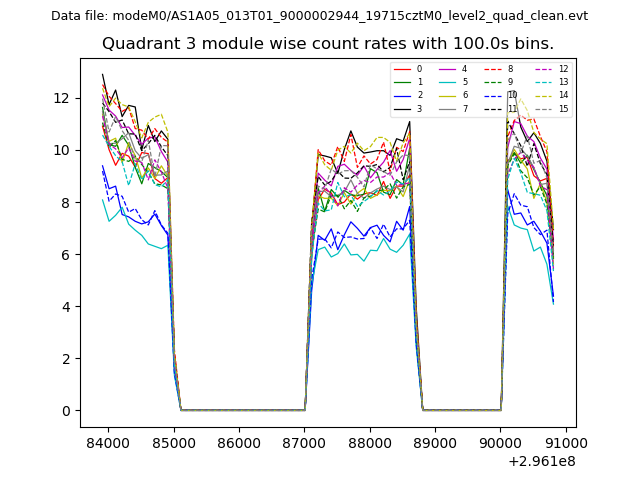
| Module-wise count rates for Quadrant A Data is divided into 100 sec bins |
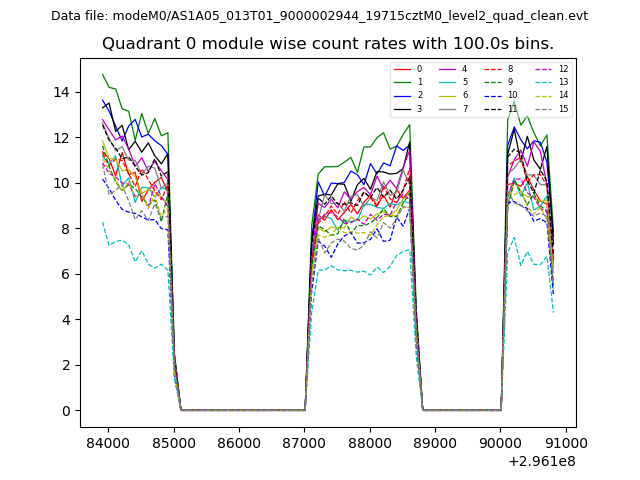 |
 |
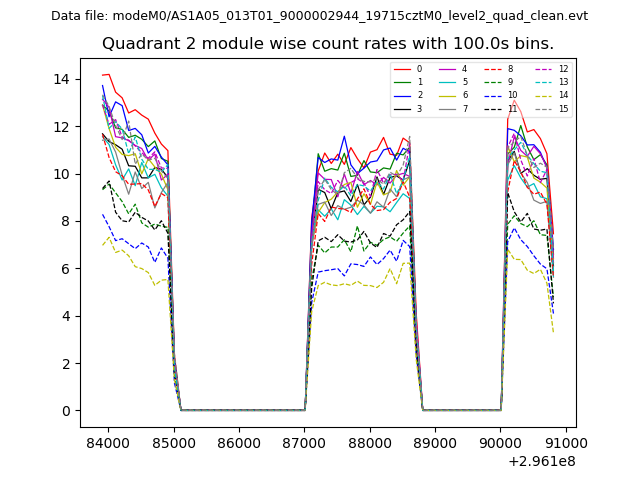
| Module-wise count rates for Quadrant B Data is divided into 100 sec bins |
 |
 |
| Module-wise count rates for Quadrant C Data is divided into 100 sec bins |
 |
 |
| Module-wise count rates for Quadrant D Data is divided into 100 sec bins |
 |
 |
| Parameter | Plot |
|---|---|
| CZT HV Monitor |  |
| D_VDD | 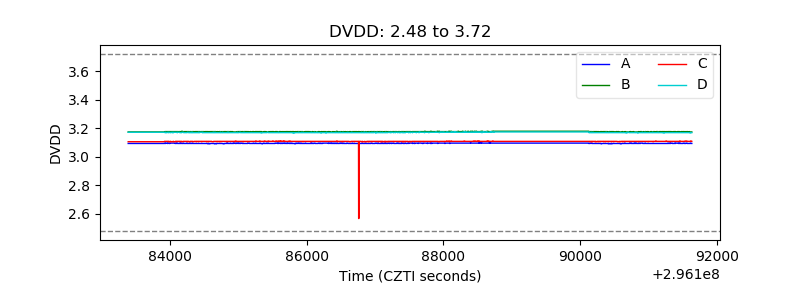 |
| Temperature 1 | 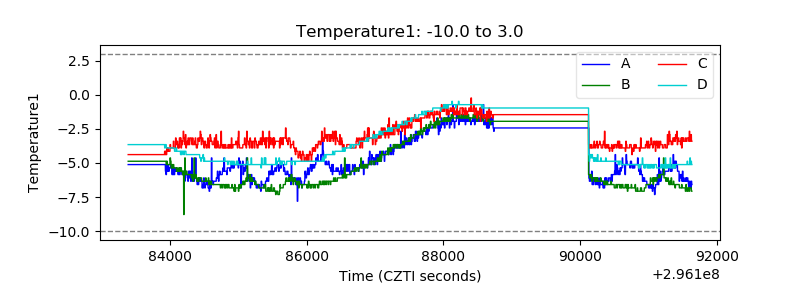 |
| Veto HV Monitor | 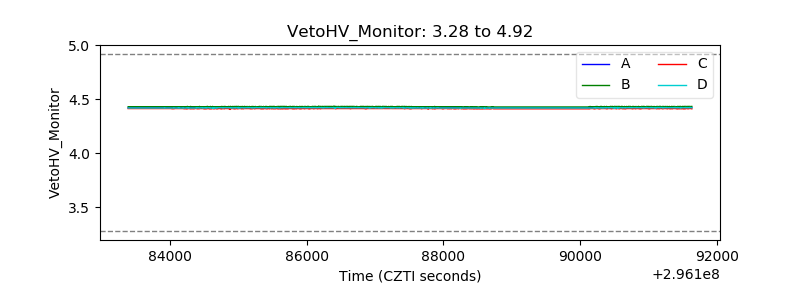 |
| Veto LLD | 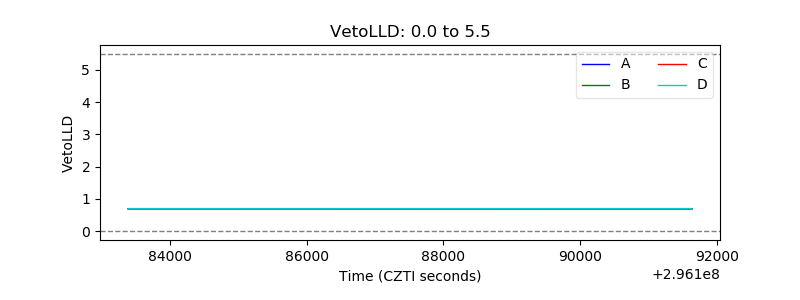 |
| Alpha Counter | 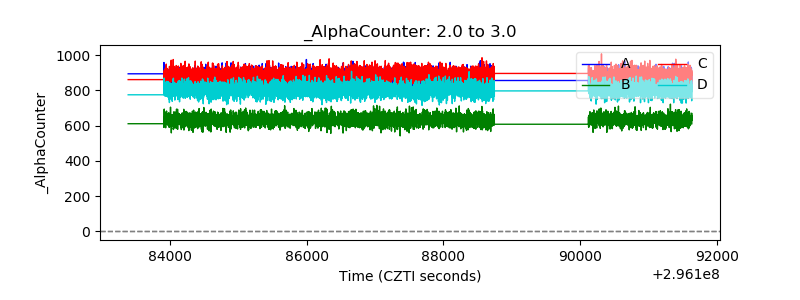 |
| _CPM_Rate | 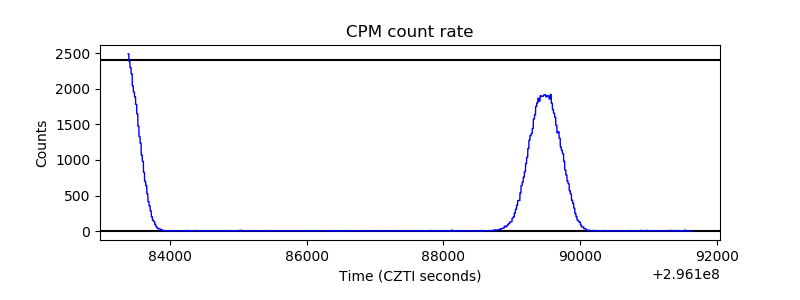 |
| CZT Counter | 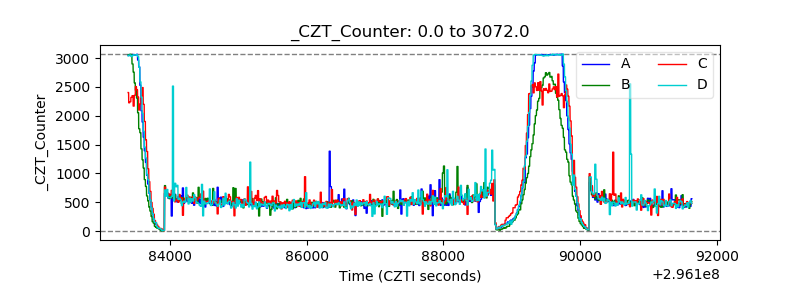 |
| +2.5 Volts monitor |  |
| +5 Volts monitor |  |
| _ROLL_ROT |  |
| _Roll_DEC | 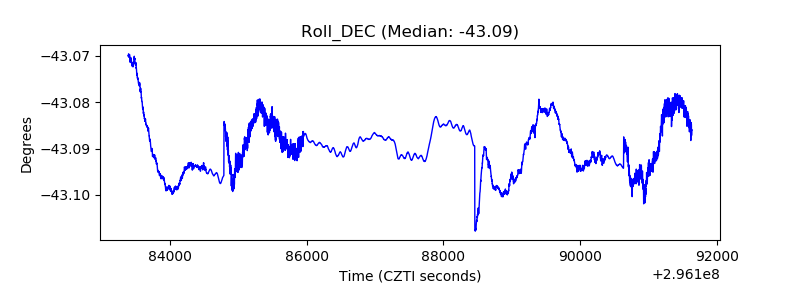 |
| _Roll_RA | 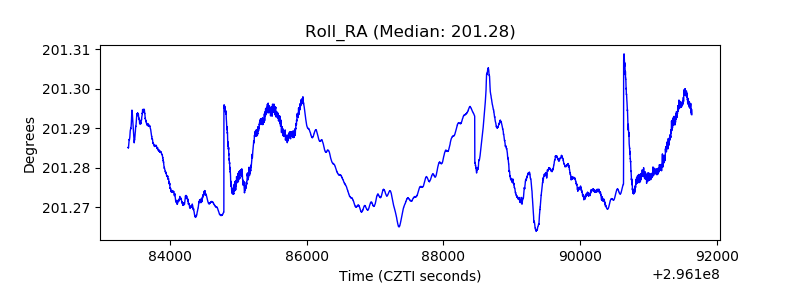 |
| Veto Counter |  |