| Param | Original file | Final file |
|---|---|---|
| Filename | modeM0/AS1A05_013T01_9000002944_19716cztM0_level2.evt | modeM0/AS1A05_013T01_9000002944_19716cztM0_level2_quad_clean.evt |
| Size (bytes) | 462,363,840 | 78,497,280 |
| Size | 440.9 MB | 74.9 MB |
| Events in quadrant A | 3,280,035 | 484,766 |
| Events in quadrant B | 3,339,249 | 496,973 |
| Events in quadrant C | 3,464,365 | 473,535 |
| Events in quadrant D | 3,471,138 | 461,849 |
| Mode SS | |||
|---|---|---|---|
| Quadrant | BADHDUFLAG | Total packets | Discarded packets |
| A | 0 | 134 | 0 |
| B | 0 | 134 | 0 |
| C | 0 | 134 | 0 |
| D | 0 | 134 | 0 |
| Mode M0 | |||
|---|---|---|---|
| Quadrant | BADHDUFLAG | Total packets | Discarded packets |
| A | 0 | 13791 | 2 |
| B | 0 | 13844 | 2 |
| C | 0 | 14082 | 2 |
| D | 0 | 14404 | 2 |
| Mode M9 | |||
|---|---|---|---|
| Quadrant | BADHDUFLAG | Total packets | Discarded packets |
| A | 0 | 13 | 0 |
| B | 0 | 14 | 0 |
| C | 0 | 14 | 0 |
| D | 0 | 14 | 0 |
| Quadrant | Total seconds | Saturated seconds | Saturation percentage |
|---|---|---|---|
| A | 6593 | 66 | 1.001062% |
| B | 6593 | 55 | 0.834218% |
| C | 6593 | 81 | 1.228576% |
| D | 6593 | 75 | 1.137570% |
Noise dominated data is calculated using 1-second bins in cleaned event files. If a bin has >2000 counts, and if more than 50% of those come from <1% of pixels, then it is considered to be noise-dominated and hence unusable.
| Quadrant | # 1 sec bins | Bins with >0 counts | Bins with >2000 counts | High rate bins dominated by noise | Noise dominated (total time) | Noise dominated (detector-on time) | Marked lightcurve |
|---|---|---|---|---|---|---|---|
| A | 7748 | 6594 | 0 | 0 | 0.00% | 0.00% | 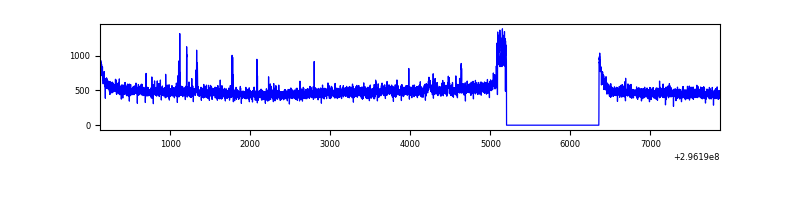 |
| B | 7748 | 6593 | 0 | 0 | 0.00% | 0.00% | 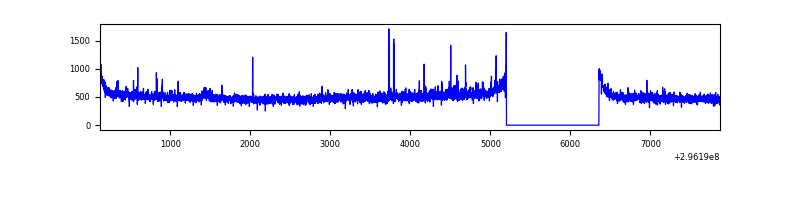 |
| C | 7748 | 6593 | 0 | 0 | 0.00% | 0.00% | 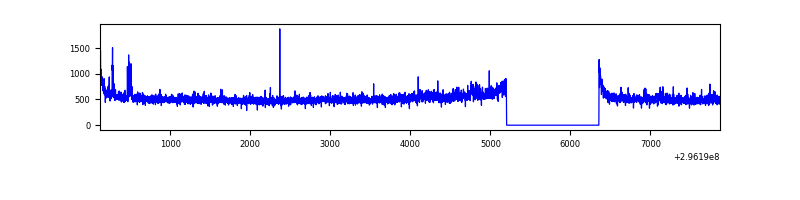 |
| D | 7748 | 6594 | 23 | 23 | 0.30% | 0.35% | 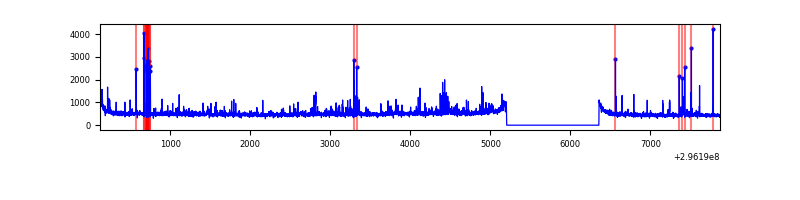 |
Top three noisy pixels from each quadrant. If the there are fewer than three noisy pixels in the level2.evt file, extra rows are filled as -1
| Pixel properties | Quadrant properties | ||||||
|---|---|---|---|---|---|---|---|
| Quadrant | DetID | PixID | Counts | Sigma | Mean | Median | Sigma |
| A | 0 | 23 | 76548 | 453.33 | 830 | 812 | 167.1 |
| A | 0 | 226 | 11793 | 65.73 | 830 | 812 | 167.1 |
| A | 3 | 137 | 6487 | 33.97 | 830 | 812 | 167.1 |
| B | 4 | 171 | 28017 | 173.54 | 837 | 818 | 156.7 |
| B | 12 | 111 | 18929 | 115.55 | 837 | 818 | 156.7 |
| B | 11 | 111 | 16141 | 97.77 | 837 | 818 | 156.7 |
| C | 3 | 233 | 146252 | 781.13 | 809 | 815 | 186.2 |
| C | 14 | 238 | 127156 | 678.57 | 809 | 815 | 186.2 |
| C | 7 | 247 | 39792 | 209.34 | 809 | 815 | 186.2 |
| D | 1 | 52 | 222172 | 1129.66 | 812 | 789 | 196.0 |
| D | 2 | 16 | 125265 | 635.17 | 812 | 789 | 196.0 |
| D | 12 | 225 | 26875 | 133.11 | 812 | 789 | 196.0 |
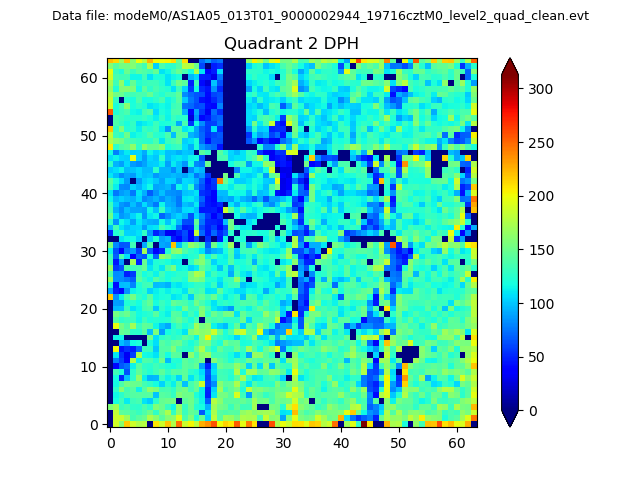
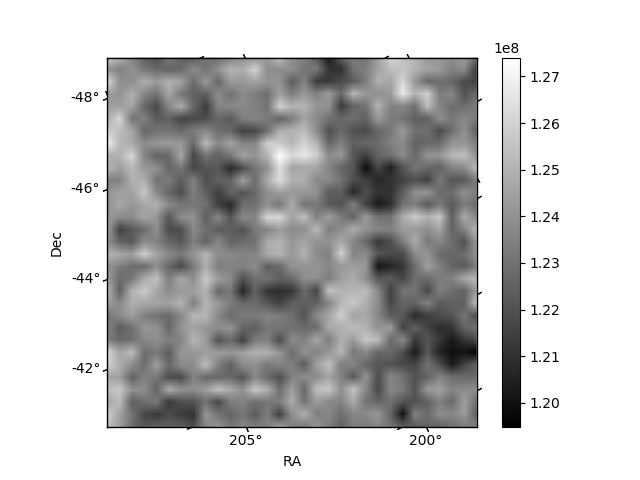
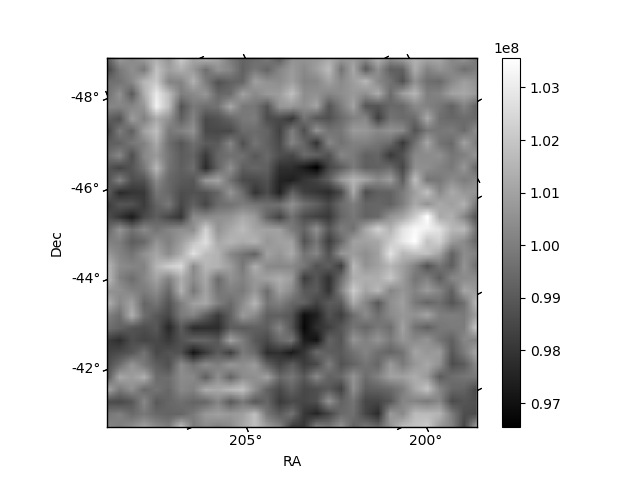
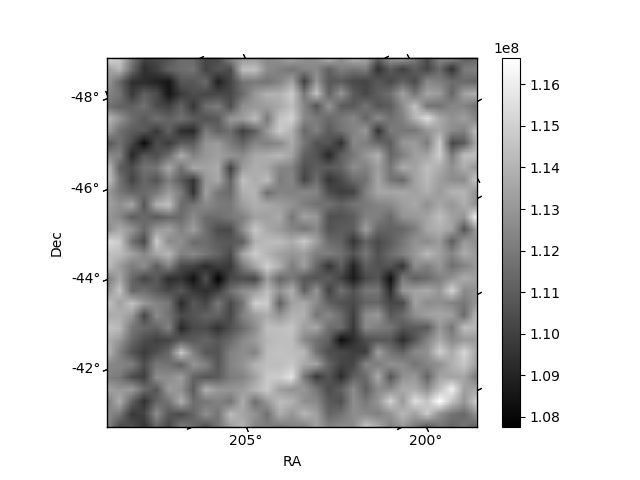
Histogram calculated using DETX and DETY for each event in the final _common_clean file
| Quadrant A | 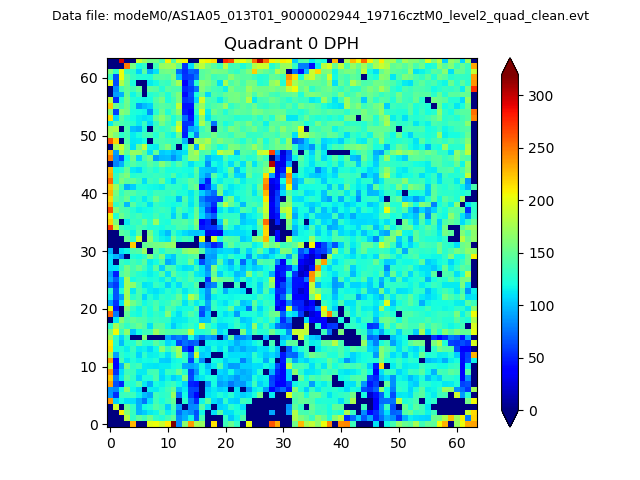 |
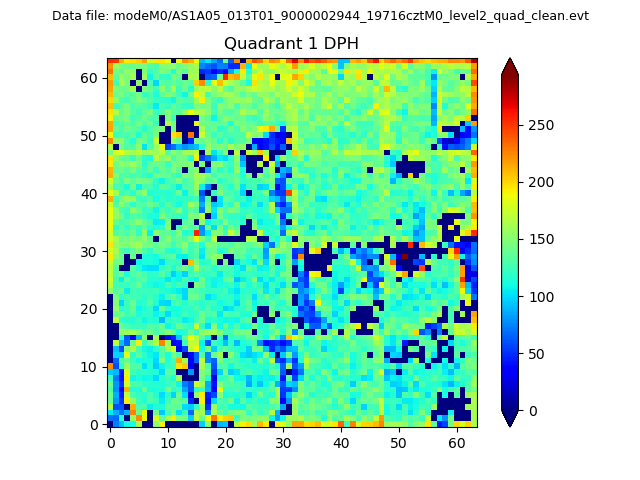 |
Quadrant B |
|---|---|---|---|
| Quadrant D | 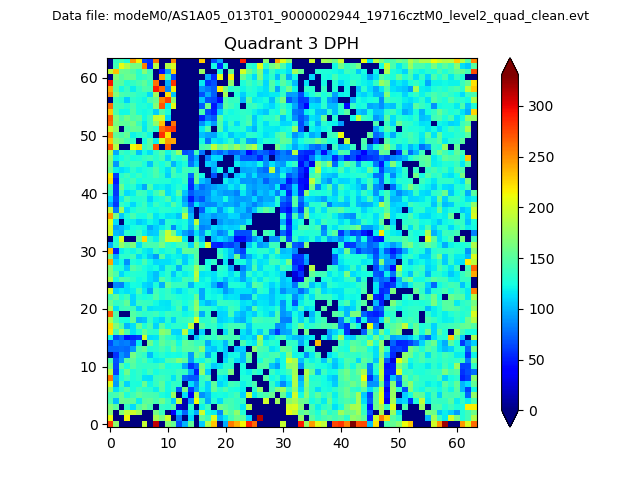 |
 |
Quadrant C |
| Plot type | Count rate plots | Images |
|---|---|---|
| Comparison with Poisson distribution Blue bars denote a histogram of data divided into 1 sec bins. Red curve is a Poisson curve with rate = median count rate of data. |
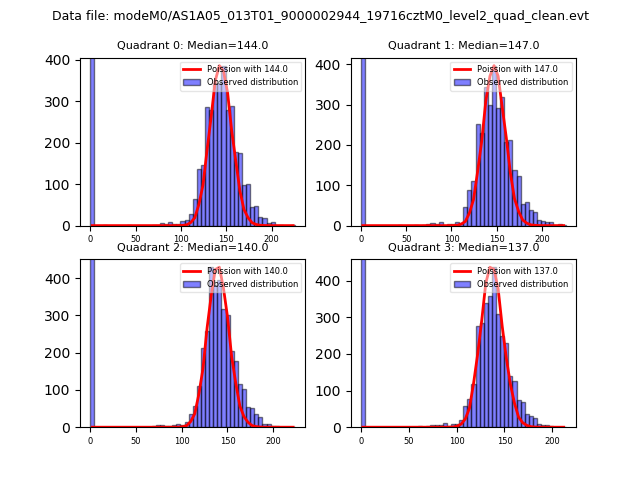 |
 |
| Quadrant-wise count rates Data is divided into 100 sec bins |
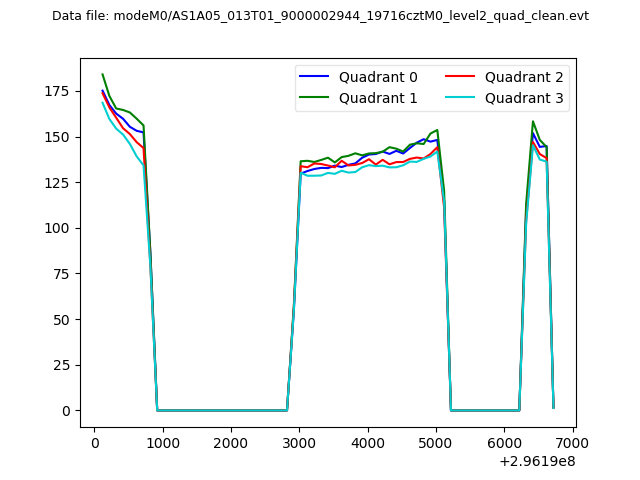 |
|
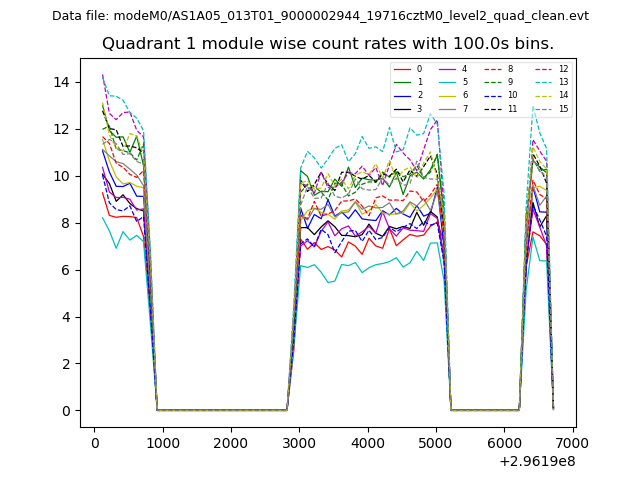
| Module-wise count rates for Quadrant A Data is divided into 100 sec bins |
 |
 |
| Module-wise count rates for Quadrant B Data is divided into 100 sec bins |
 |
 |
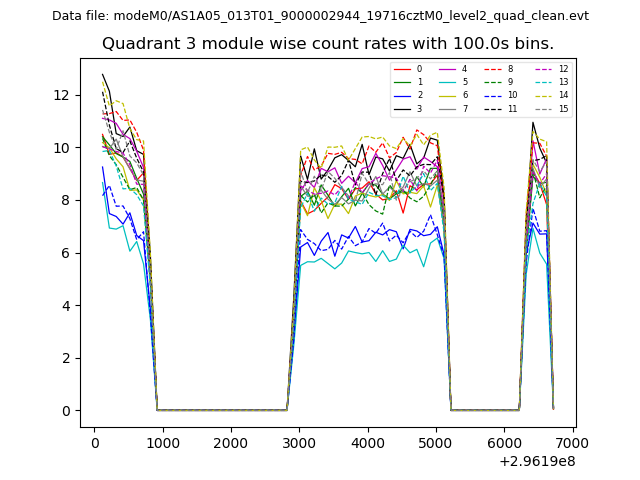
| Module-wise count rates for Quadrant C Data is divided into 100 sec bins |
 |
 |
| Module-wise count rates for Quadrant D Data is divided into 100 sec bins |
 |
 |
| Parameter | Plot |
|---|---|
| CZT HV Monitor | 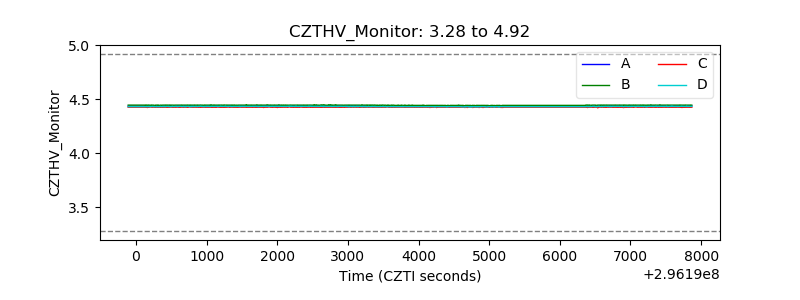 |
| D_VDD | 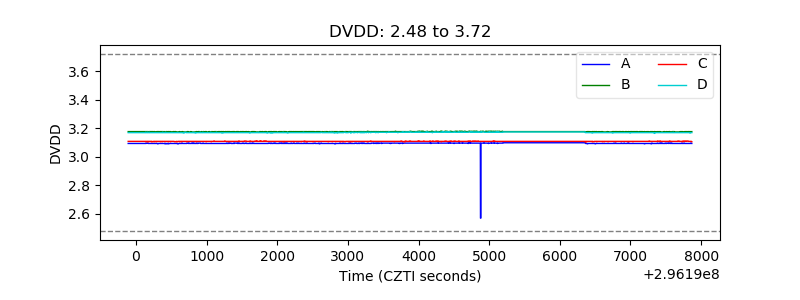 |
| Temperature 1 | 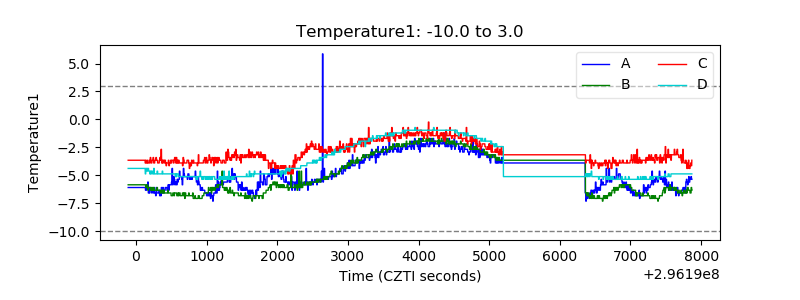 |
| Veto HV Monitor | 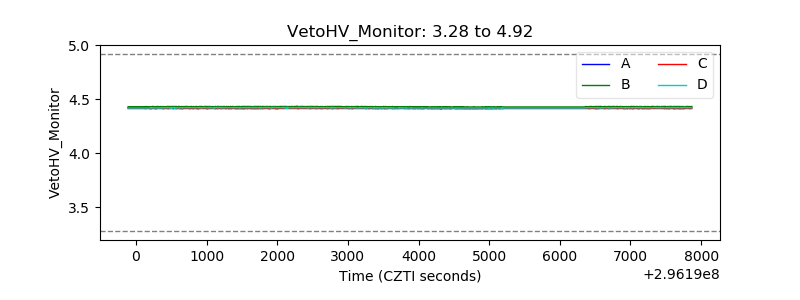 |
| Veto LLD |  |
| Alpha Counter | 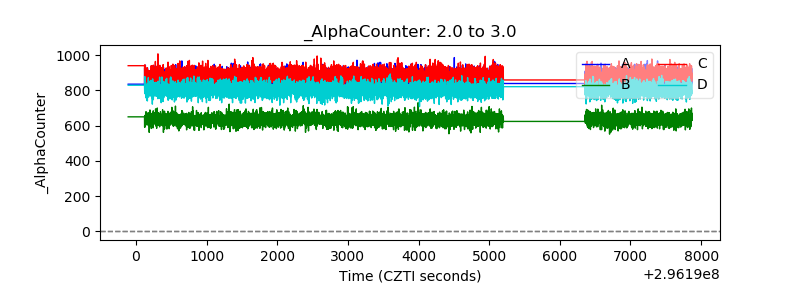 |
| _CPM_Rate | 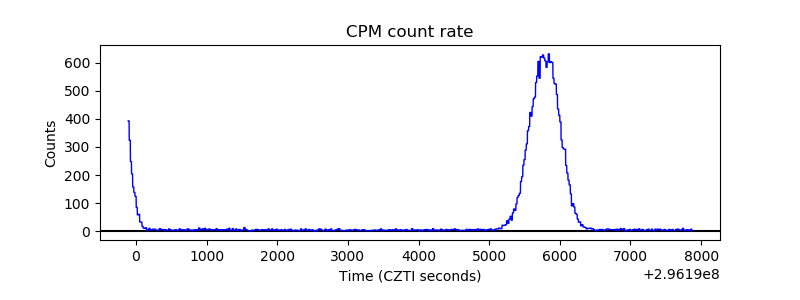 |
| CZT Counter | 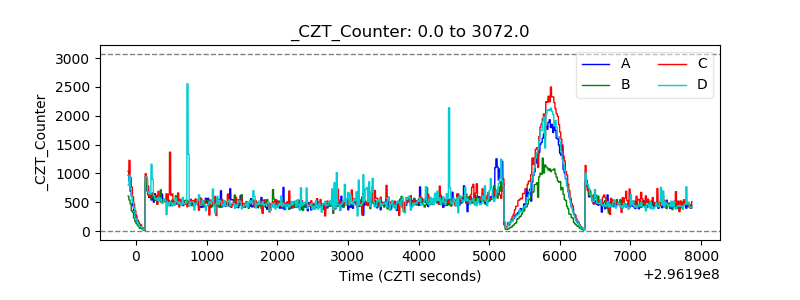 |
| +2.5 Volts monitor |  |
| +5 Volts monitor |  |
| _ROLL_ROT | 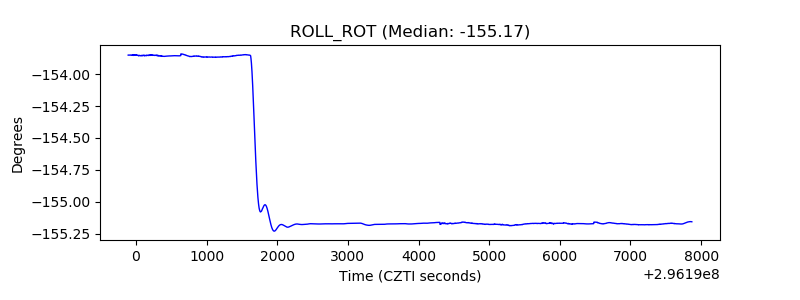 |
| _Roll_DEC | 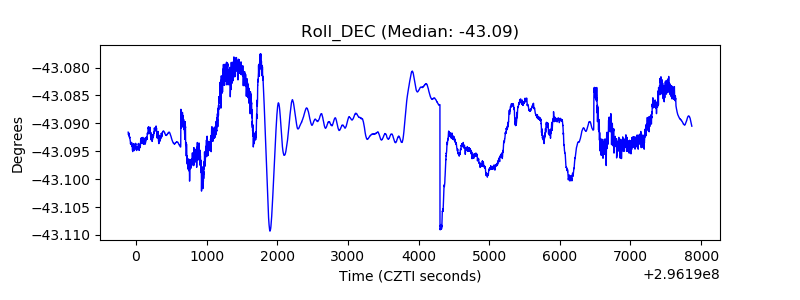 |
| _Roll_RA | 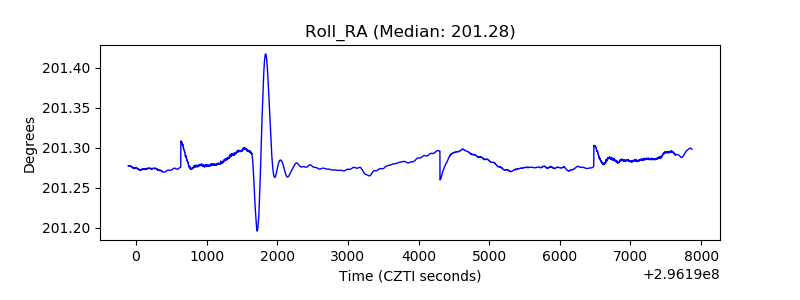 |
| Veto Counter |  |