| Param | Original file | Final file |
|---|---|---|
| Filename | modeM0/AS1A05_013T01_9000002944_19717cztM0_level2.evt | modeM0/AS1A05_013T01_9000002944_19717cztM0_level2_quad_clean.evt |
| Size (bytes) | 511,689,600 | 79,153,920 |
| Size | 488.0 MB | 75.5 MB |
| Events in quadrant A | 3,445,149 | 485,133 |
| Events in quadrant B | 3,556,359 | 493,680 |
| Events in quadrant C | 3,792,826 | 469,727 |
| Events in quadrant D | 4,223,184 | 456,885 |
| Mode SS | |||
|---|---|---|---|
| Quadrant | BADHDUFLAG | Total packets | Discarded packets |
| A | 0 | 146 | 0 |
| B | 0 | 146 | 0 |
| C | 0 | 146 | 0 |
| D | 0 | 146 | 0 |
| Mode M0 | |||
|---|---|---|---|
| Quadrant | BADHDUFLAG | Total packets | Discarded packets |
| A | 0 | 14804 | 2 |
| B | 0 | 14983 | 3 |
| C | 0 | 15463 | 2 |
| D | 0 | 17345 | 2 |
| Mode M9 | |||
|---|---|---|---|
| Quadrant | BADHDUFLAG | Total packets | Discarded packets |
| A | 0 | 18 | 0 |
| B | 0 | 18 | 0 |
| C | 0 | 18 | 0 |
| D | 0 | 18 | 0 |
| Quadrant | Total seconds | Saturated seconds | Saturation percentage |
|---|---|---|---|
| A | 7050 | 139 | 1.971631% |
| B | 7049 | 149 | 2.113775% |
| C | 7050 | 204 | 2.893617% |
| D | 7050 | 391 | 5.546099% |
Noise dominated data is calculated using 1-second bins in cleaned event files. If a bin has >2000 counts, and if more than 50% of those come from <1% of pixels, then it is considered to be noise-dominated and hence unusable.
| Quadrant | # 1 sec bins | Bins with >0 counts | Bins with >2000 counts | High rate bins dominated by noise | Noise dominated (total time) | Noise dominated (detector-on time) | Marked lightcurve |
|---|---|---|---|---|---|---|---|
| A | 8945 | 7052 | 0 | 0 | 0.00% | 0.00% | 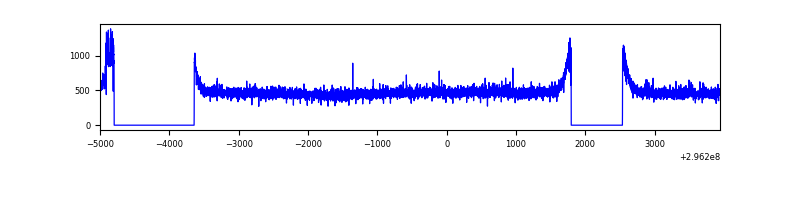 |
| B | 8944 | 7050 | 1 | 1 | 0.01% | 0.01% | 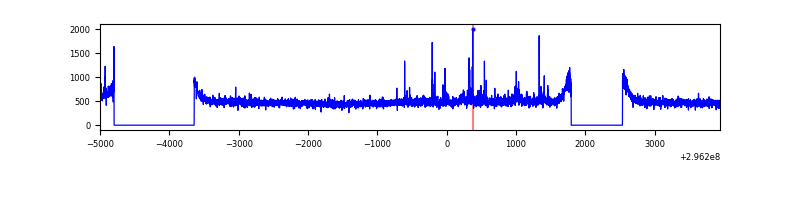 |
| C | 8945 | 7050 | 8 | 8 | 0.09% | 0.11% | 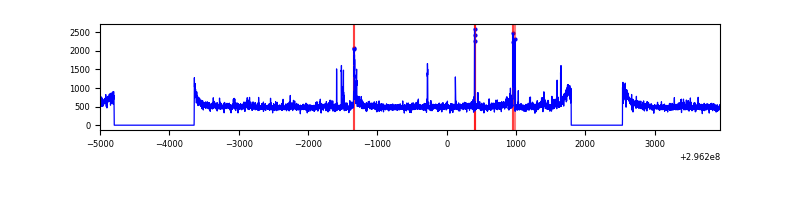 |
| D | 8945 | 7051 | 237 | 237 | 2.65% | 3.36% | 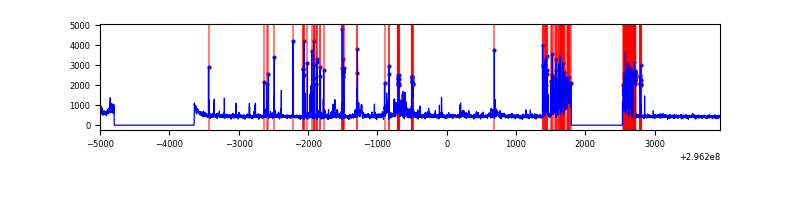 |
Top three noisy pixels from each quadrant. If the there are fewer than three noisy pixels in the level2.evt file, extra rows are filled as -1
| Pixel properties | Quadrant properties | ||||||
|---|---|---|---|---|---|---|---|
| Quadrant | DetID | PixID | Counts | Sigma | Mean | Median | Sigma |
| A | 0 | 23 | 48684 | 268.21 | 879 | 859 | 178.3 |
| A | 0 | 226 | 10613 | 54.7 | 879 | 859 | 178.3 |
| A | 6 | 16 | 10415 | 53.59 | 879 | 859 | 178.3 |
| B | 4 | 171 | 28079 | 161.72 | 882 | 861 | 168.3 |
| B | 0 | 190 | 23098 | 132.13 | 882 | 861 | 168.3 |
| B | 12 | 111 | 20340 | 115.74 | 882 | 861 | 168.3 |
| C | 3 | 233 | 232015 | 1172.2 | 850 | 857 | 197.2 |
| C | 14 | 238 | 132561 | 667.87 | 850 | 857 | 197.2 |
| C | 7 | 247 | 111247 | 559.79 | 850 | 857 | 197.2 |
| D | 1 | 52 | 935080 | 4546.38 | 839 | 814 | 205.5 |
| D | 2 | 16 | 36280 | 172.59 | 839 | 814 | 205.5 |
| D | 12 | 225 | 33527 | 159.19 | 839 | 814 | 205.5 |
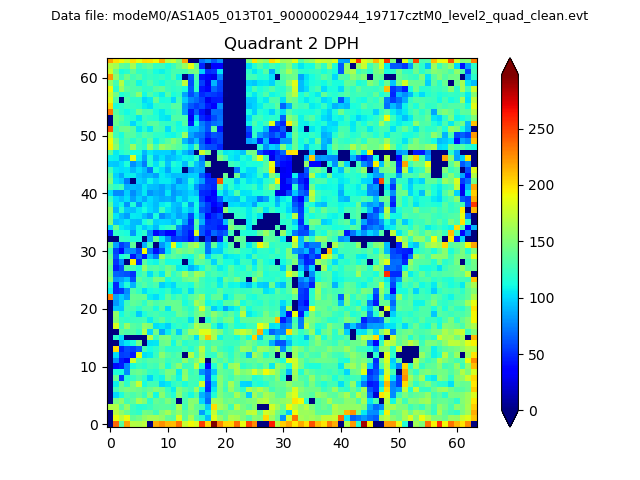
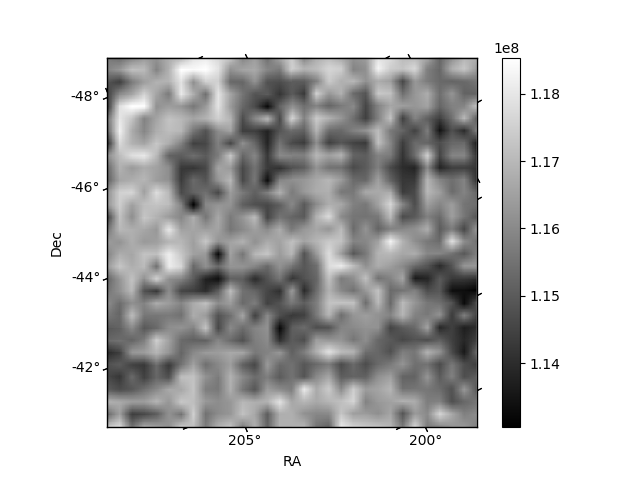
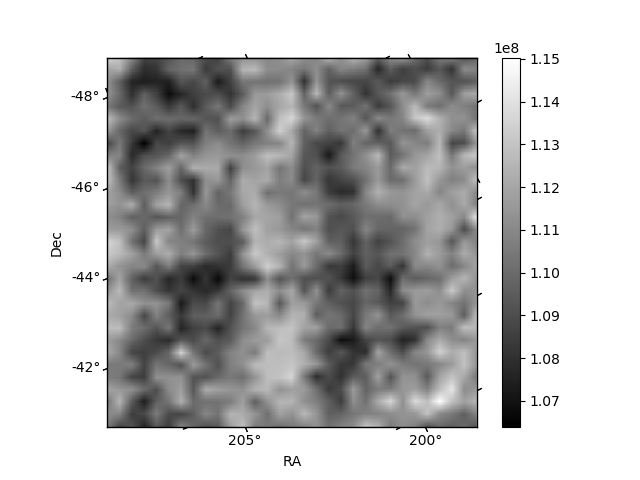
Histogram calculated using DETX and DETY for each event in the final _common_clean file
| Quadrant A |  |
 |
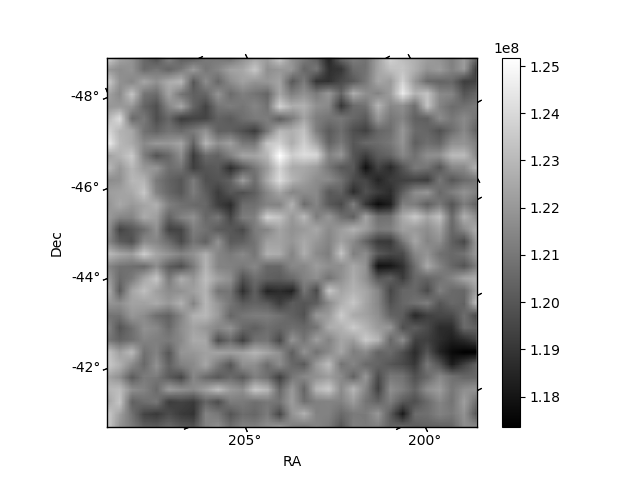
Quadrant B |
|---|---|---|---|
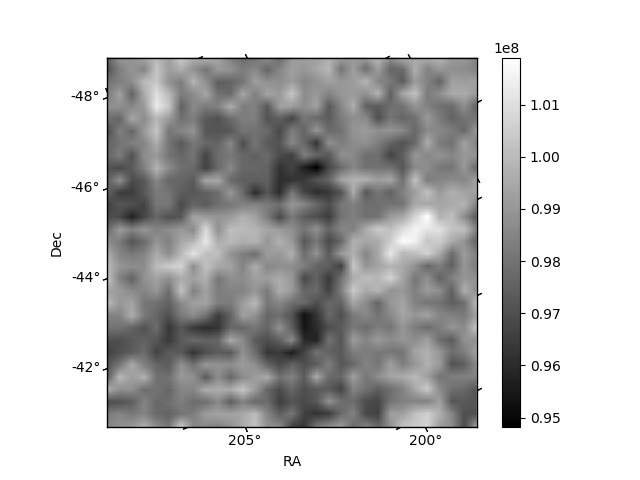
| Quadrant D |  |
 |
Quadrant C |
| Plot type | Count rate plots | Images |
|---|---|---|
| Comparison with Poisson distribution Blue bars denote a histogram of data divided into 1 sec bins. Red curve is a Poisson curve with rate = median count rate of data. |
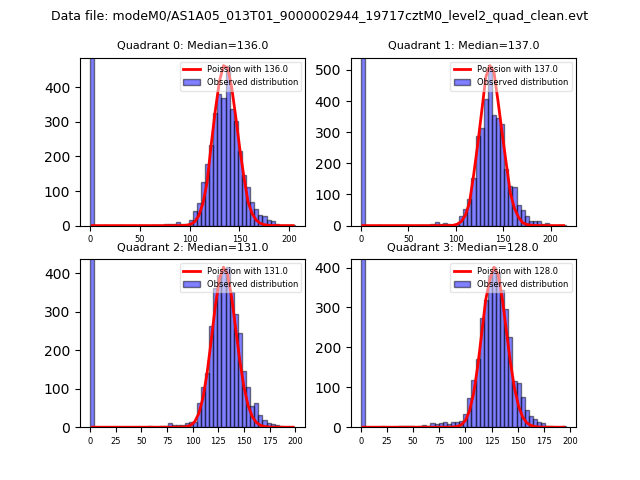 |
 |
| Quadrant-wise count rates Data is divided into 100 sec bins |
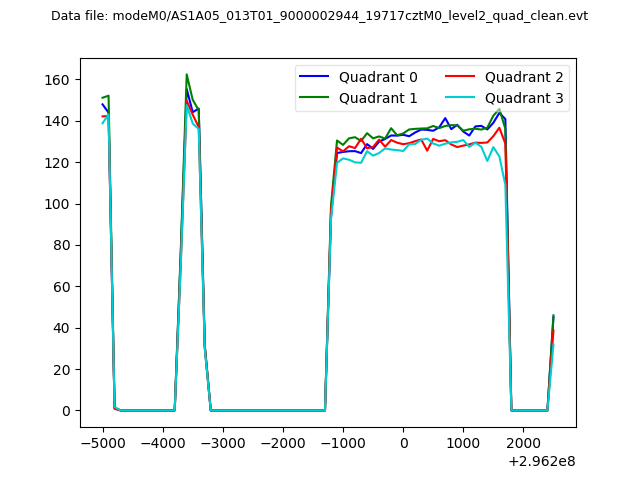 |
|
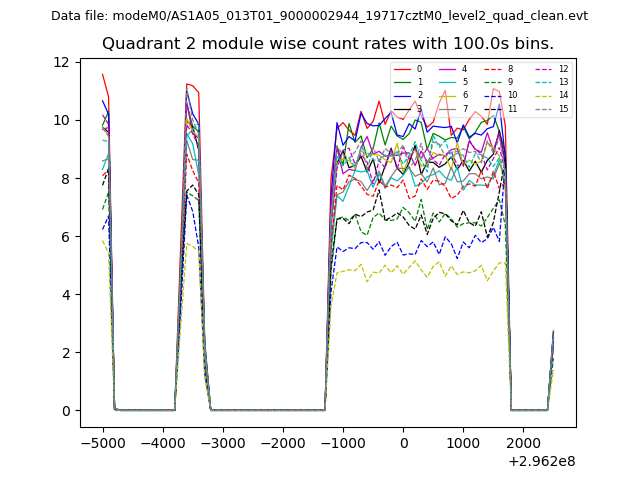
| Module-wise count rates for Quadrant A Data is divided into 100 sec bins |
 |
 |
| Module-wise count rates for Quadrant B Data is divided into 100 sec bins |
 |
 |
| Module-wise count rates for Quadrant C Data is divided into 100 sec bins |
 |
 |
| Module-wise count rates for Quadrant D Data is divided into 100 sec bins |
 |
 |
| Parameter | Plot |
|---|---|
| CZT HV Monitor | 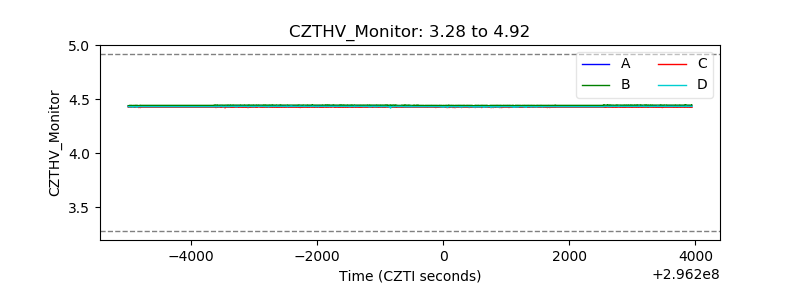 |
| D_VDD | 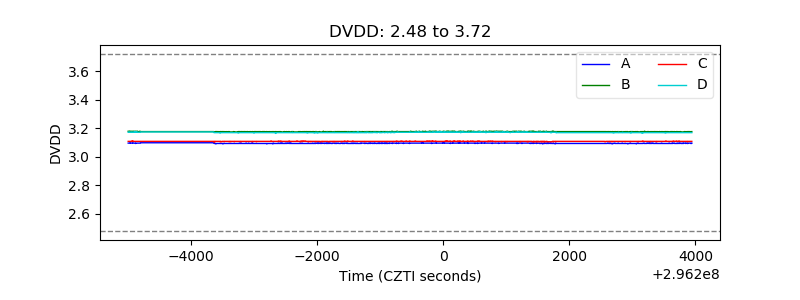 |
| Temperature 1 | 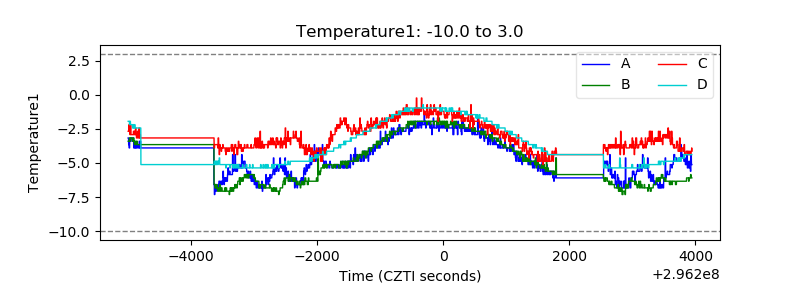 |
| Veto HV Monitor | 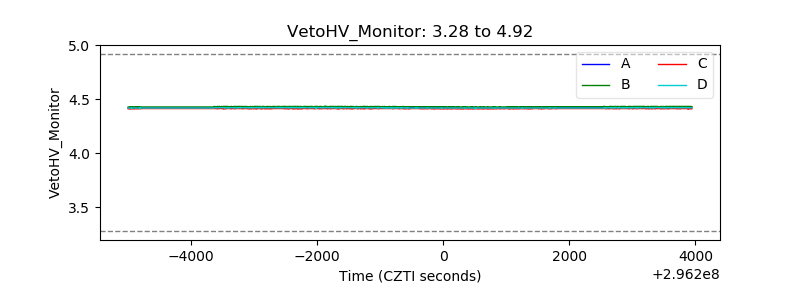 |
| Veto LLD | 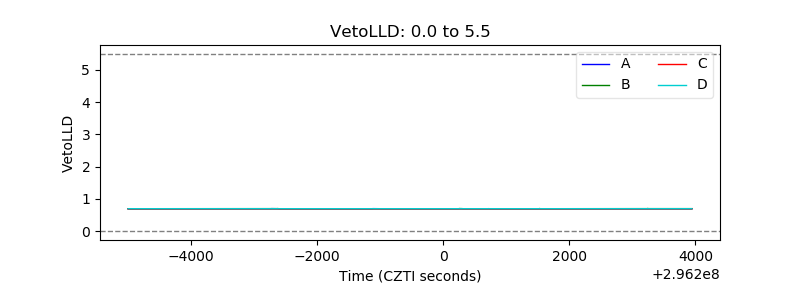 |
| Alpha Counter | 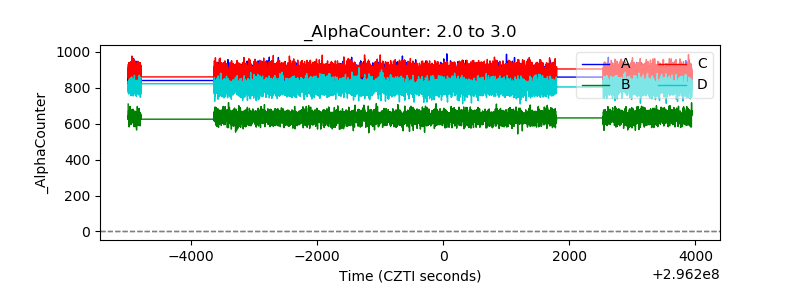 |
| _CPM_Rate | 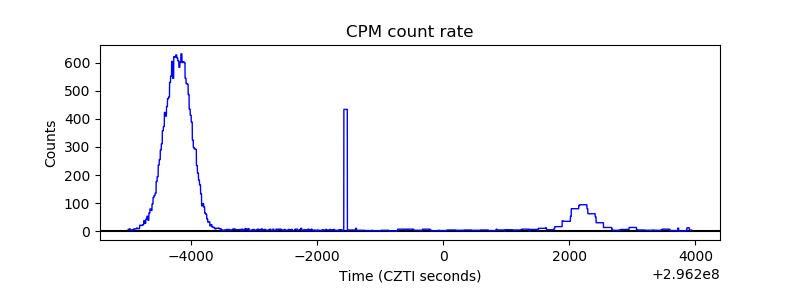 |
| CZT Counter | 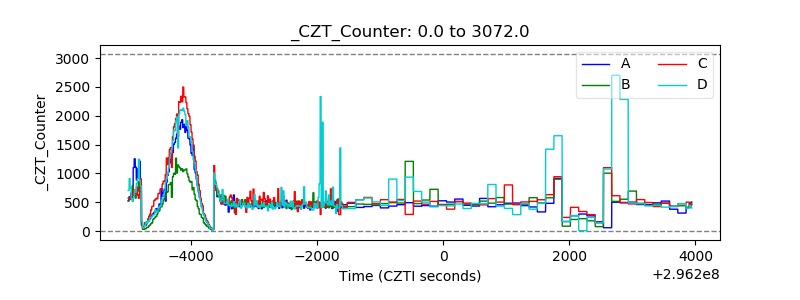 |
| +2.5 Volts monitor |  |
| +5 Volts monitor | 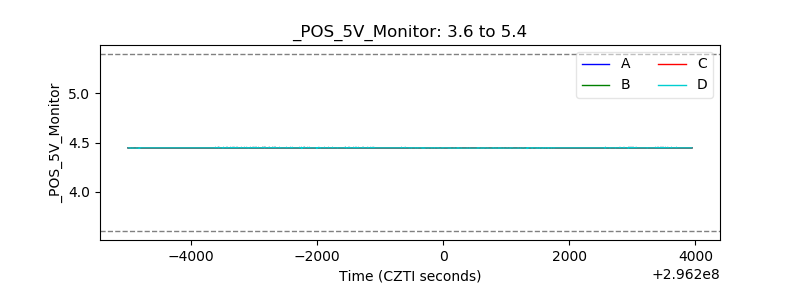 |
| _ROLL_ROT | 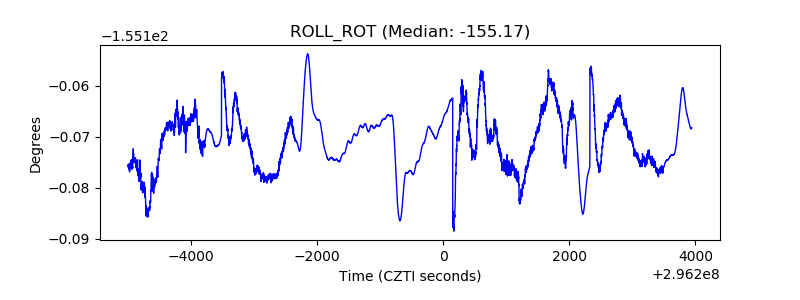 |
| _Roll_DEC | 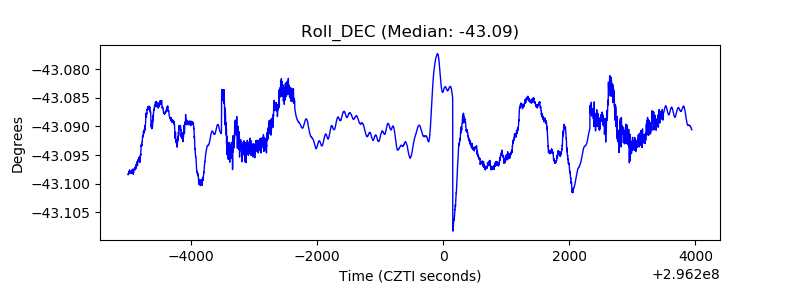 |
| _Roll_RA | 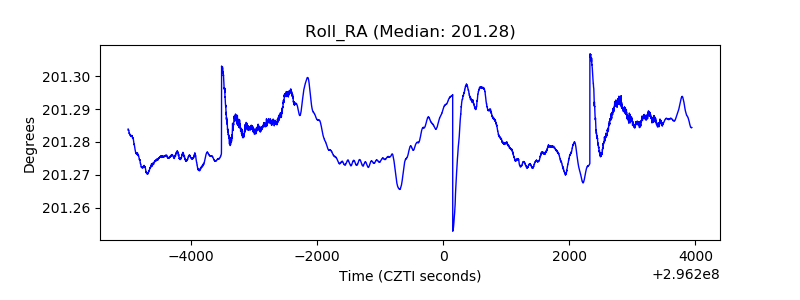 |
| Veto Counter | 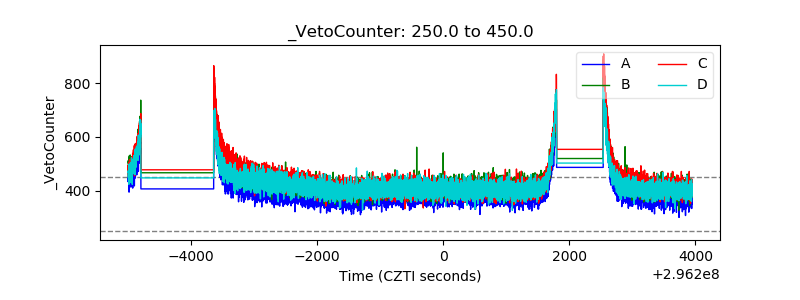 |