| Param | Original file | Final file |
|---|---|---|
| Filename | modeM0/AS1A05_013T01_9000002944_19718cztM0_level2.evt | modeM0/AS1A05_013T01_9000002944_19718cztM0_level2_quad_clean.evt |
| Size (bytes) | 540,576,000 | 80,193,600 |
| Size | 515.5 MB | 76.5 MB |
| Events in quadrant A | 3,887,420 | 486,687 |
| Events in quadrant B | 3,669,242 | 493,196 |
| Events in quadrant C | 4,432,209 | 467,814 |
| Events in quadrant D | 3,877,288 | 462,850 |
| Mode SS | |||
|---|---|---|---|
| Quadrant | BADHDUFLAG | Total packets | Discarded packets |
| A | 0 | 152 | 0 |
| B | 0 | 152 | 0 |
| C | 0 | 152 | 0 |
| D | 0 | 152 | 0 |
| Mode M0 | |||
|---|---|---|---|
| Quadrant | BADHDUFLAG | Total packets | Discarded packets |
| A | 0 | 16323 | 2 |
| B | 0 | 15652 | 3 |
| C | 0 | 17777 | 2 |
| D | 0 | 16742 | 2 |
| Mode M9 | |||
|---|---|---|---|
| Quadrant | BADHDUFLAG | Total packets | Discarded packets |
| A | 0 | 7 | 0 |
| B | 0 | 8 | 0 |
| C | 0 | 8 | 0 |
| D | 0 | 8 | 0 |
| Quadrant | Total seconds | Saturated seconds | Saturation percentage |
|---|---|---|---|
| A | 7435 | 217 | 2.918628% |
| B | 7434 | 236 | 3.174603% |
| C | 7434 | 404 | 5.434490% |
| D | 7434 | 336 | 4.519774% |
Noise dominated data is calculated using 1-second bins in cleaned event files. If a bin has >2000 counts, and if more than 50% of those come from <1% of pixels, then it is considered to be noise-dominated and hence unusable.
| Quadrant | # 1 sec bins | Bins with >0 counts | Bins with >2000 counts | High rate bins dominated by noise | Noise dominated (total time) | Noise dominated (detector-on time) | Marked lightcurve |
|---|---|---|---|---|---|---|---|
| A | 7690 | 7436 | 0 | 0 | 0.00% | 0.00% |  |
| B | 7689 | 7435 | 4 | 4 | 0.05% | 0.05% |  |
| C | 7688 | 7433 | 109 | 109 | 1.42% | 1.47% |  |
| D | 7689 | 7434 | 154 | 154 | 2.00% | 2.07% |  |
Top three noisy pixels from each quadrant. If the there are fewer than three noisy pixels in the level2.evt file, extra rows are filled as -1
| Pixel properties | Quadrant properties | ||||||
|---|---|---|---|---|---|---|---|
| Quadrant | DetID | PixID | Counts | Sigma | Mean | Median | Sigma |
| A | 10 | 1 | 316704 | 1703.11 | 917 | 897 | 185.4 |
| A | 6 | 16 | 27346 | 142.63 | 917 | 897 | 185.4 |
| A | 0 | 23 | 8957 | 43.46 | 917 | 897 | 185.4 |
| B | 12 | 111 | 22004 | 119.18 | 917 | 893 | 177.1 |
| B | 11 | 111 | 19302 | 103.92 | 917 | 893 | 177.1 |
| B | 0 | 230 | 18878 | 101.53 | 917 | 893 | 177.1 |
| C | 3 | 233 | 823429 | 4011.65 | 876 | 882 | 205.0 |
| C | 14 | 238 | 134776 | 653.01 | 876 | 882 | 205.0 |
| C | 7 | 247 | 56088 | 269.24 | 876 | 882 | 205.0 |
| D | 1 | 52 | 339034 | 1557.4 | 886 | 859 | 217.1 |
| D | 12 | 218 | 97714 | 446.05 | 886 | 859 | 217.1 |
| D | 2 | 16 | 26890 | 119.88 | 886 | 859 | 217.1 |
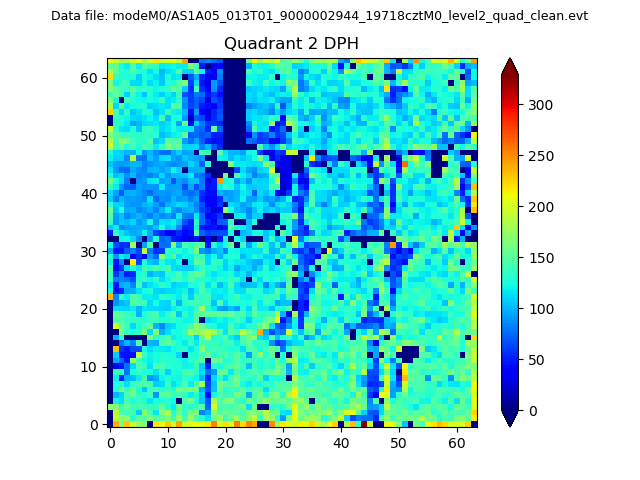
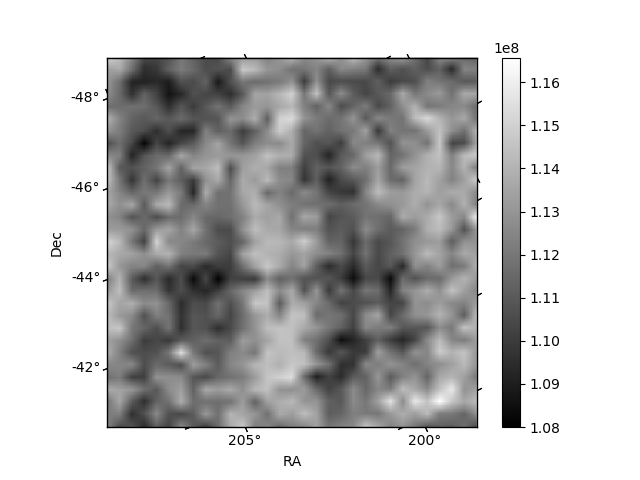
Histogram calculated using DETX and DETY for each event in the final _common_clean file
| Quadrant A | 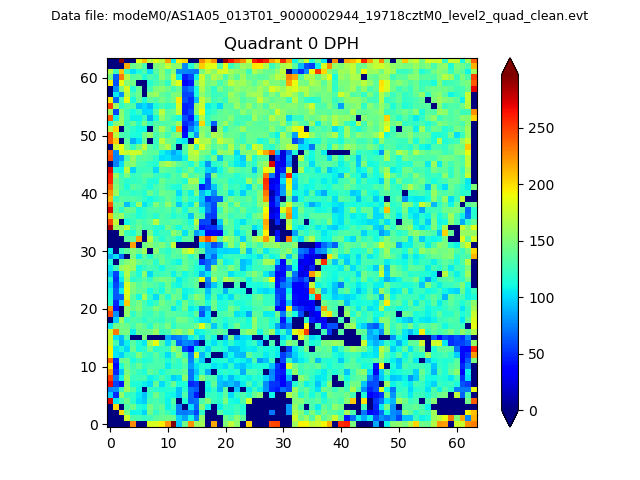 |
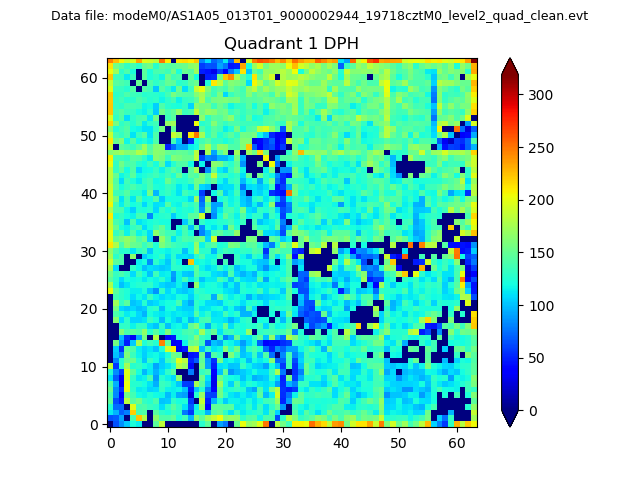 |
Quadrant B |
|---|---|---|---|
| Quadrant D | 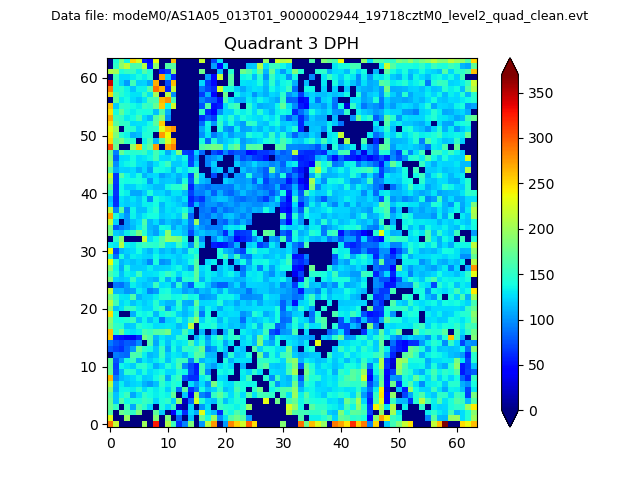 |
 |
Quadrant C |
| Plot type | Count rate plots | Images |
|---|---|---|
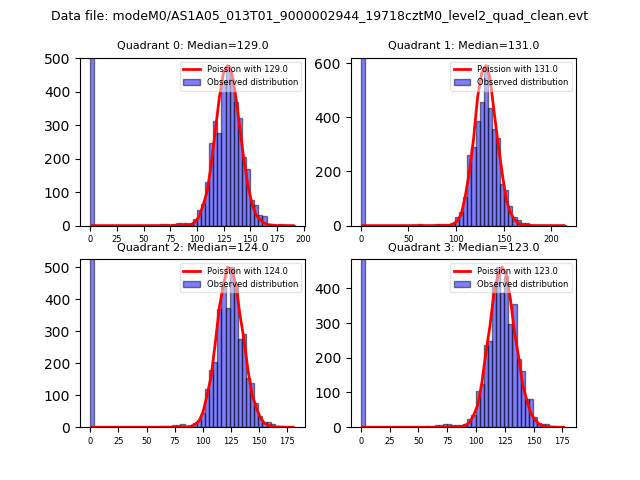
| Comparison with Poisson distribution Blue bars denote a histogram of data divided into 1 sec bins. Red curve is a Poisson curve with rate = median count rate of data. |
 |
 |
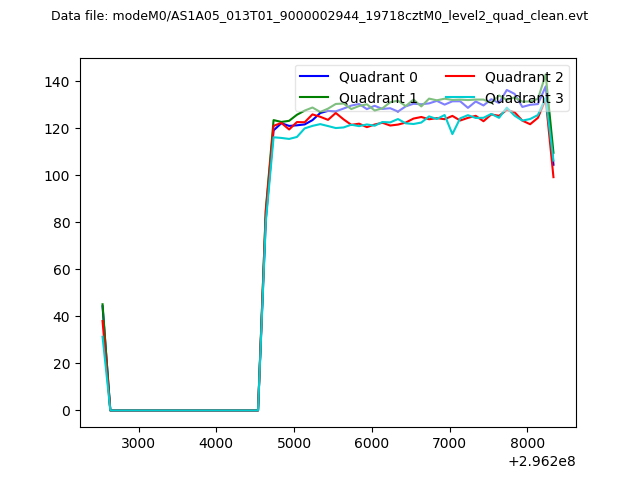
| Quadrant-wise count rates Data is divided into 100 sec bins |
 |
|
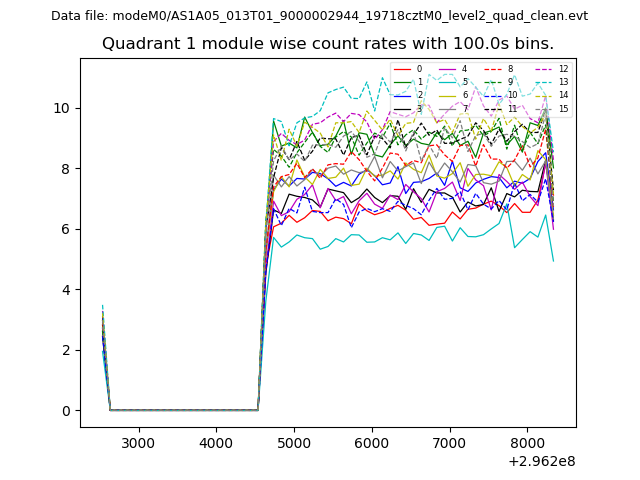
| Module-wise count rates for Quadrant A Data is divided into 100 sec bins |
 |
 |
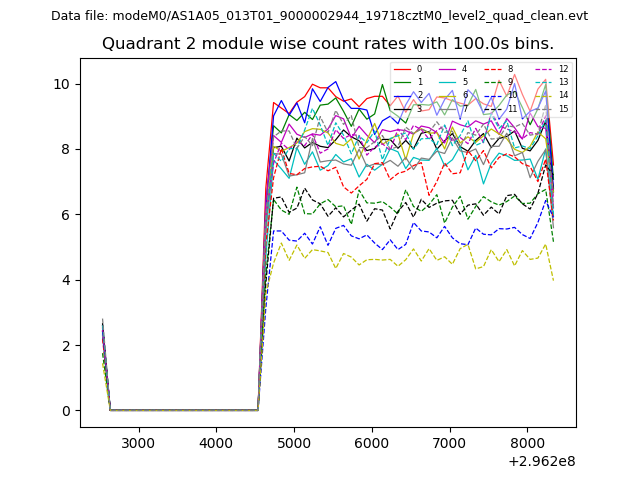
| Module-wise count rates for Quadrant B Data is divided into 100 sec bins |
 |
 |
| Module-wise count rates for Quadrant C Data is divided into 100 sec bins |
 |
 |
| Module-wise count rates for Quadrant D Data is divided into 100 sec bins |
 |
 |
| Parameter | Plot |
|---|---|
| CZT HV Monitor |  |
| D_VDD | 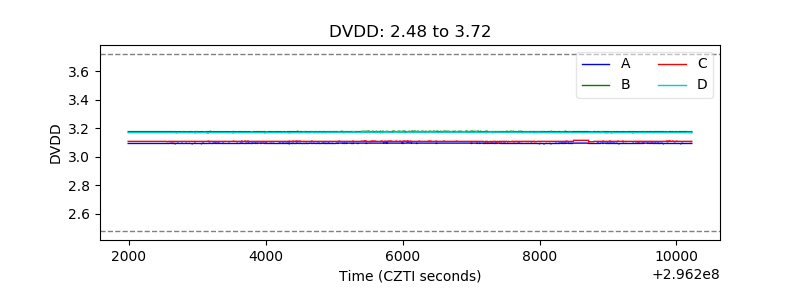 |
| Temperature 1 | 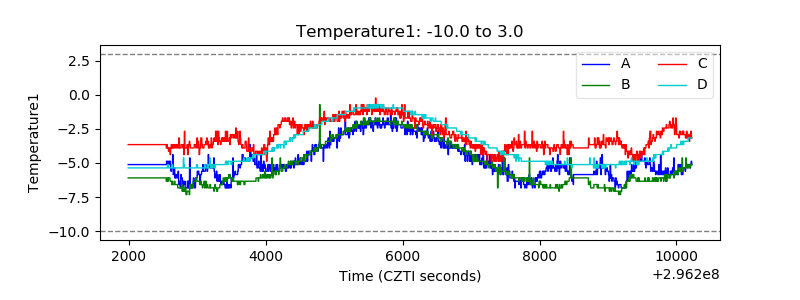 |
| Veto HV Monitor | 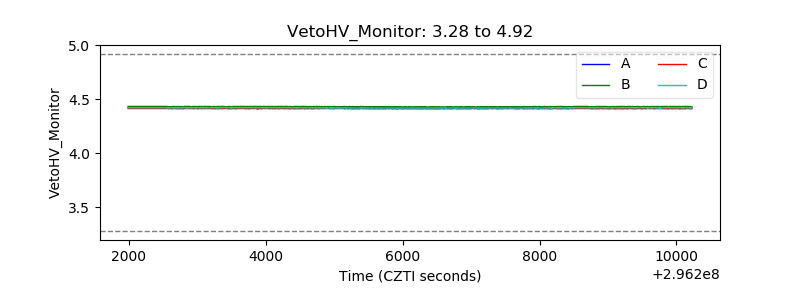 |
| Veto LLD |  |
| Alpha Counter | 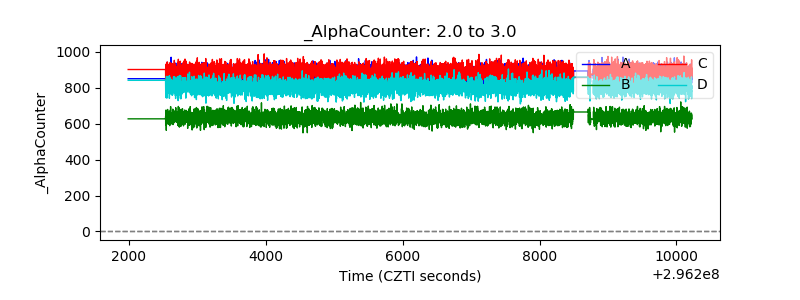 |
| _CPM_Rate | 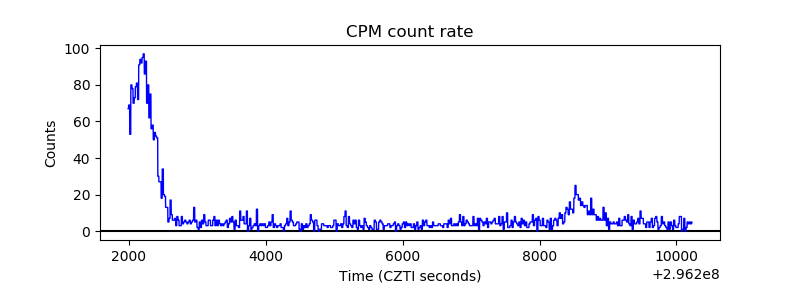 |
| CZT Counter | 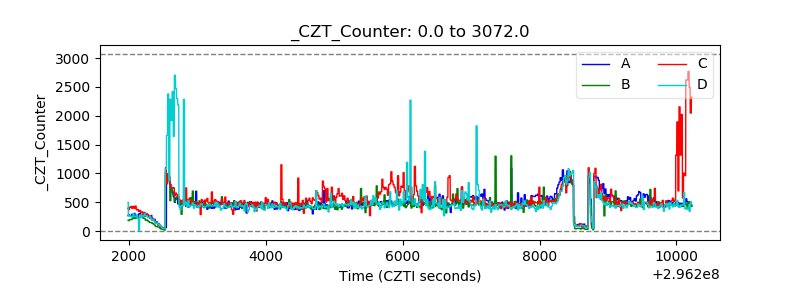 |
| +2.5 Volts monitor |  |
| +5 Volts monitor |  |
| _ROLL_ROT |  |
| _Roll_DEC | 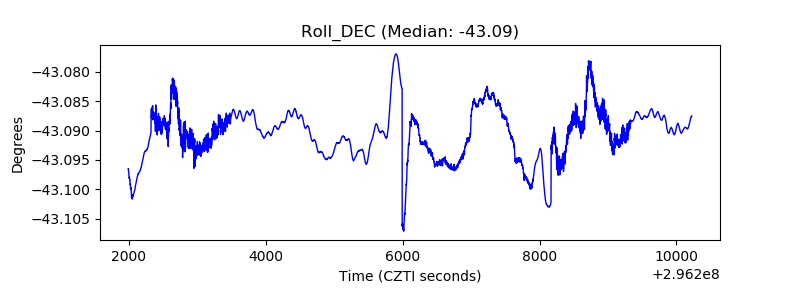 |
| _Roll_RA | 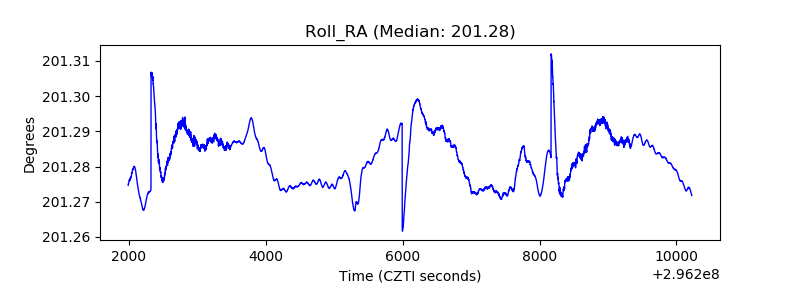 |
| Veto Counter |  |