| Param | Original file | Final file |
|---|---|---|
| Filename | modeM0/AS1A05_013T01_9000002944_19719cztM0_level2.evt | modeM0/AS1A05_013T01_9000002944_19719cztM0_level2_quad_clean.evt |
| Size (bytes) | 580,849,920 | 84,628,800 |
| Size | 553.9 MB | 80.7 MB |
| Events in quadrant A | 3,879,178 | 511,809 |
| Events in quadrant B | 3,893,397 | 519,520 |
| Events in quadrant C | 5,478,842 | 494,252 |
| Events in quadrant D | 3,806,769 | 491,143 |
| Mode SS | |||
|---|---|---|---|
| Quadrant | BADHDUFLAG | Total packets | Discarded packets |
| A | 0 | 160 | 0 |
| B | 0 | 160 | 0 |
| C | 0 | 160 | 0 |
| D | 0 | 160 | 0 |
| Mode M0 | |||
|---|---|---|---|
| Quadrant | BADHDUFLAG | Total packets | Discarded packets |
| A | 0 | 16604 | 2 |
| B | 0 | 16495 | 2 |
| C | 0 | 21469 | 2 |
| D | 0 | 16693 | 2 |
| Mode M9 | |||
|---|---|---|---|
| Quadrant | BADHDUFLAG | Total packets | Discarded packets |
| A | 0 | 1 | 0 |
| B | 0 | 2 | 0 |
| C | 0 | 2 | 0 |
| D | 0 | 2 | 0 |
| Quadrant | Total seconds | Saturated seconds | Saturation percentage |
|---|---|---|---|
| A | 7848 | 247 | 3.147299% |
| B | 7848 | 266 | 3.389399% |
| C | 7848 | 671 | 8.549949% |
| D | 7848 | 207 | 2.637615% |
Noise dominated data is calculated using 1-second bins in cleaned event files. If a bin has >2000 counts, and if more than 50% of those come from <1% of pixels, then it is considered to be noise-dominated and hence unusable.
| Quadrant | # 1 sec bins | Bins with >0 counts | Bins with >2000 counts | High rate bins dominated by noise | Noise dominated (total time) | Noise dominated (detector-on time) | Marked lightcurve |
|---|---|---|---|---|---|---|---|
| A | 7993 | 7849 | 0 | 0 | 0.00% | 0.00% | 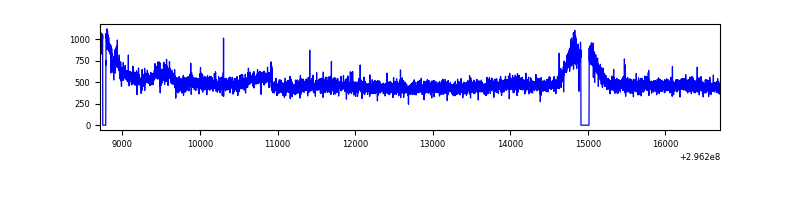 |
| B | 7993 | 7849 | 6 | 6 | 0.08% | 0.08% | 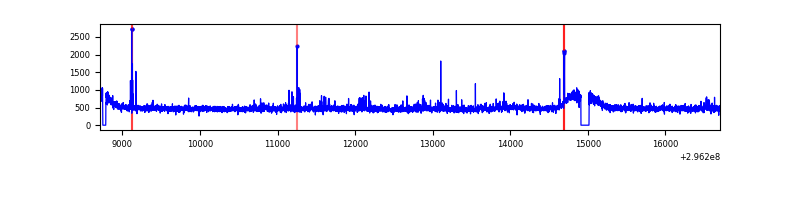 |
| C | 7993 | 7848 | 197 | 197 | 2.46% | 2.51% | 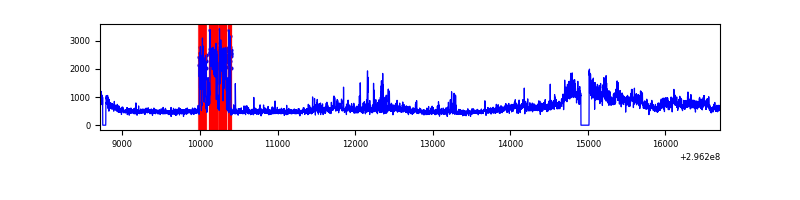 |
| D | 7993 | 7848 | 6 | 6 | 0.08% | 0.08% | 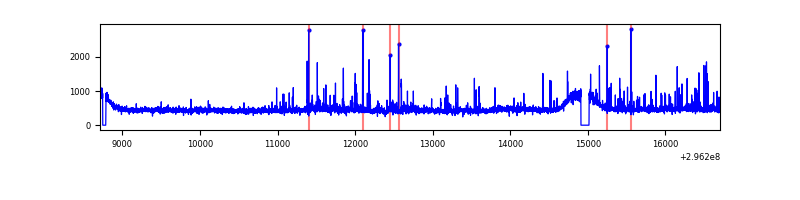 |
Top three noisy pixels from each quadrant. If the there are fewer than three noisy pixels in the level2.evt file, extra rows are filled as -1
| Pixel properties | Quadrant properties | ||||||
|---|---|---|---|---|---|---|---|
| Quadrant | DetID | PixID | Counts | Sigma | Mean | Median | Sigma |
| A | 10 | 1 | 173558 | 885.94 | 961 | 940 | 194.8 |
| A | 0 | 226 | 8441 | 38.5 | 961 | 940 | 194.8 |
| A | 3 | 137 | 8085 | 36.67 | 961 | 940 | 194.8 |
| B | 15 | 201 | 24120 | 125.78 | 958 | 931 | 184.4 |
| B | 12 | 111 | 22841 | 118.84 | 958 | 931 | 184.4 |
| B | 4 | 171 | 22473 | 116.84 | 958 | 931 | 184.4 |
| C | 3 | 233 | 1763387 | 8330.07 | 899 | 904 | 211.6 |
| C | 14 | 238 | 140186 | 658.29 | 899 | 904 | 211.6 |
| C | 7 | 247 | 60563 | 281.97 | 899 | 904 | 211.6 |
| D | 1 | 52 | 159221 | 691.13 | 942 | 913 | 229.1 |
| D | 2 | 234 | 31389 | 133.05 | 942 | 913 | 229.1 |
| D | 12 | 218 | 29275 | 123.82 | 942 | 913 | 229.1 |
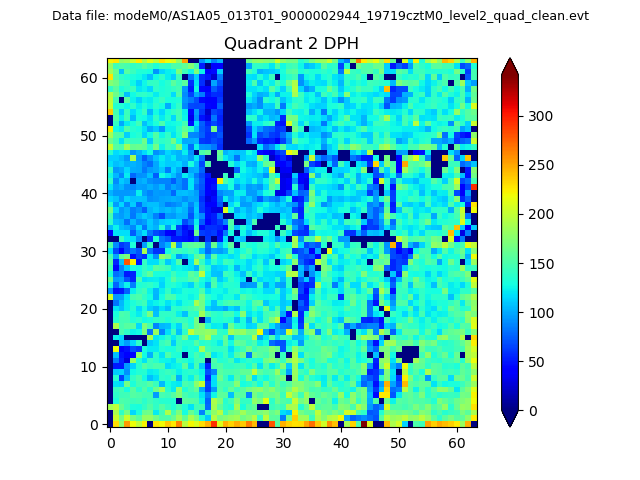
Histogram calculated using DETX and DETY for each event in the final _common_clean file
| Quadrant A | 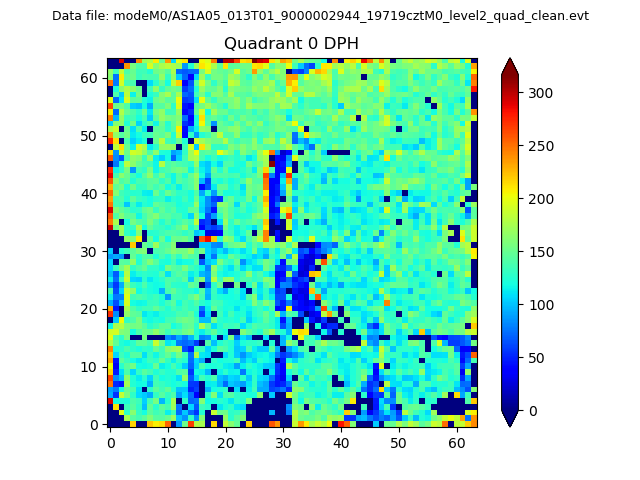 |
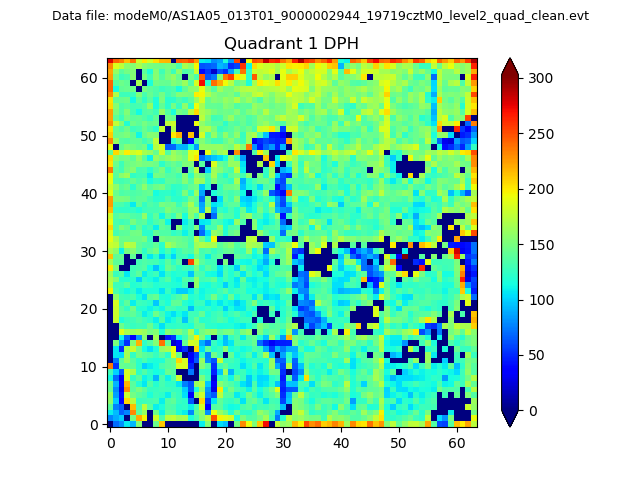 |
Quadrant B |
|---|---|---|---|
| Quadrant D | 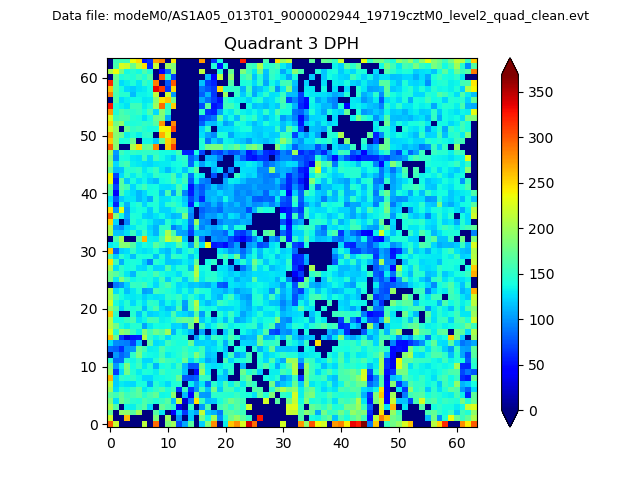 |
 |
Quadrant C |
| Plot type | Count rate plots | Images |
|---|---|---|
| Comparison with Poisson distribution Blue bars denote a histogram of data divided into 1 sec bins. Red curve is a Poisson curve with rate = median count rate of data. |
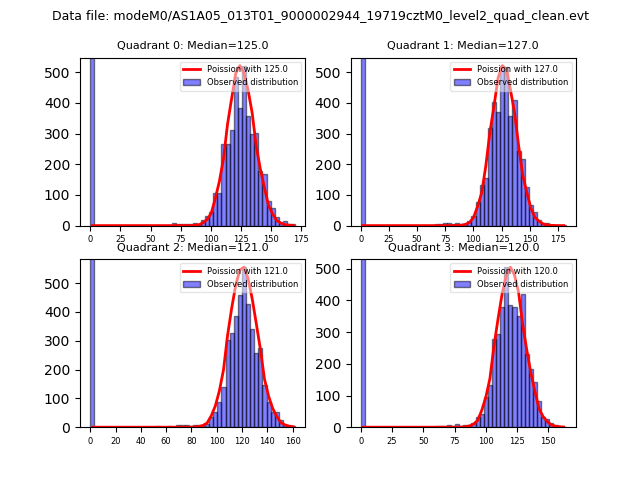 |
 |
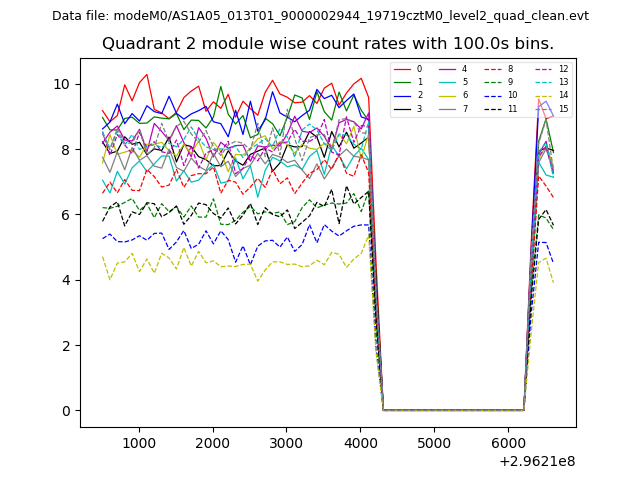
| Quadrant-wise count rates Data is divided into 100 sec bins |
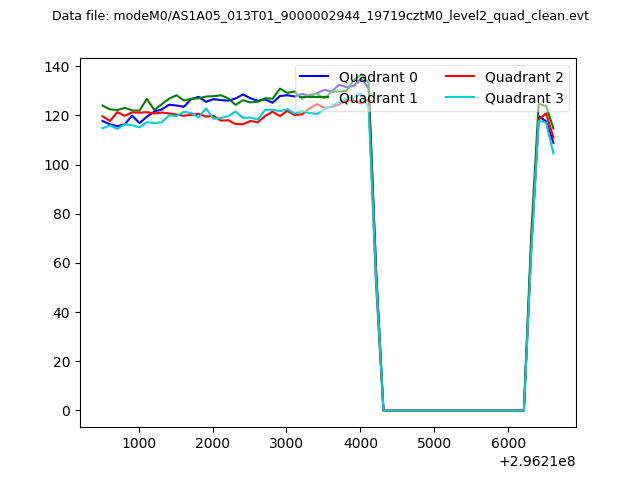 |
|
| Module-wise count rates for Quadrant A Data is divided into 100 sec bins |
 |
 |
| Module-wise count rates for Quadrant B Data is divided into 100 sec bins |
 |
 |
| Module-wise count rates for Quadrant C Data is divided into 100 sec bins |
 |
 |
| Module-wise count rates for Quadrant D Data is divided into 100 sec bins |
 |
 |
| Parameter | Plot |
|---|---|
| CZT HV Monitor |  |
| D_VDD | 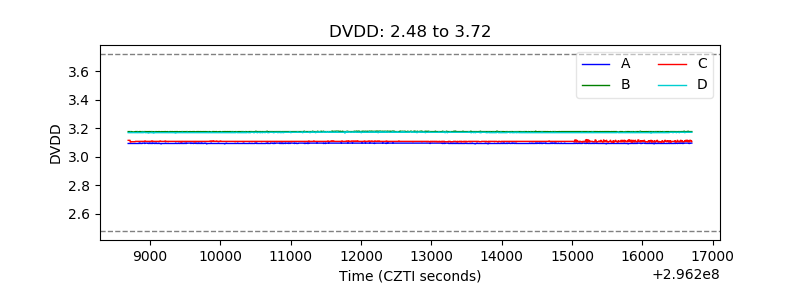 |
| Temperature 1 | 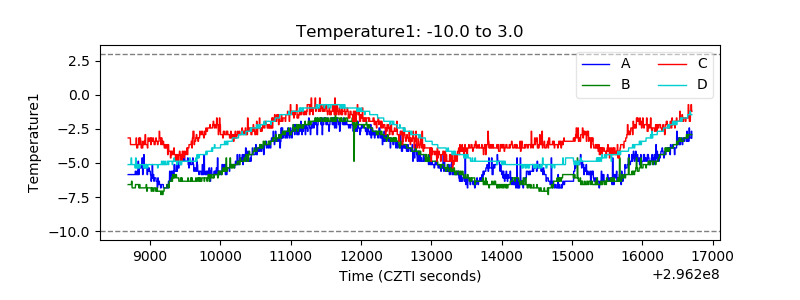 |
| Veto HV Monitor | 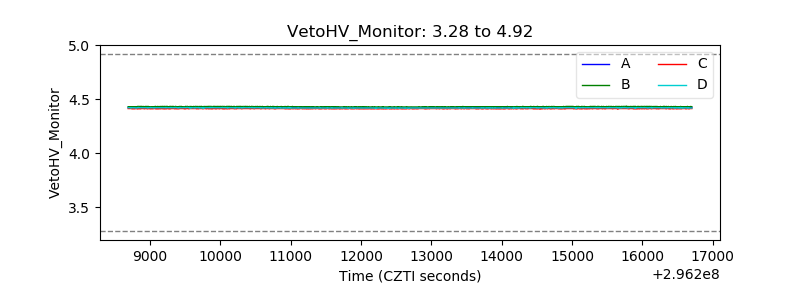 |
| Veto LLD | 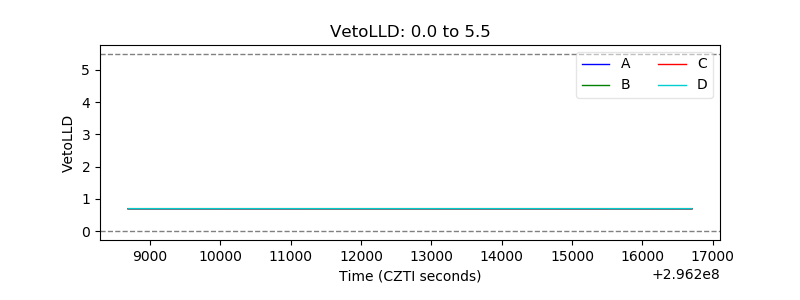 |
| Alpha Counter | 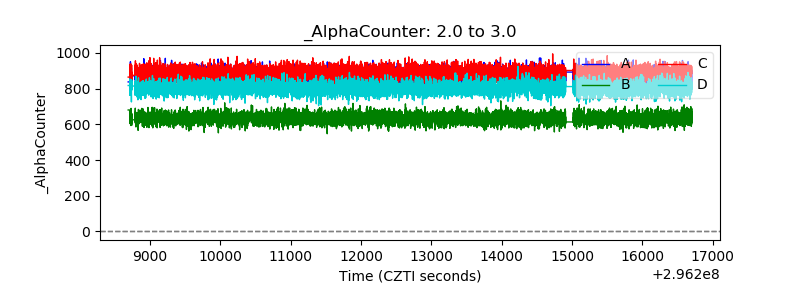 |
| _CPM_Rate | 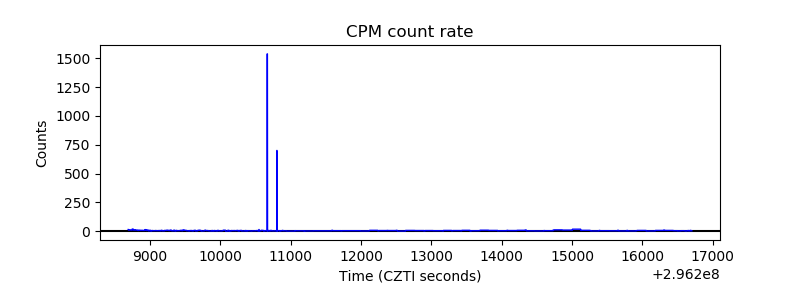 |
| CZT Counter | 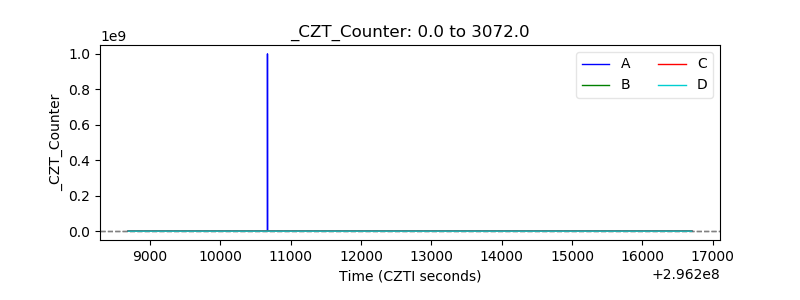 |
| +2.5 Volts monitor | 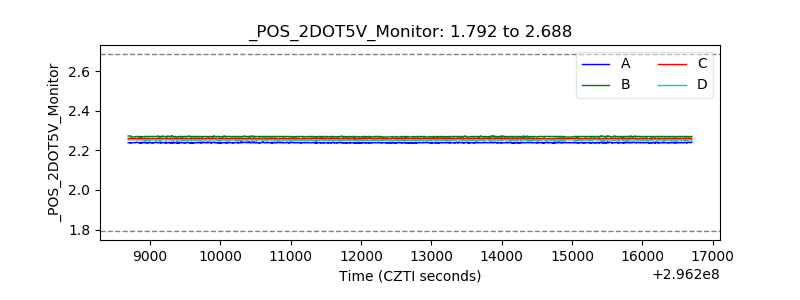 |
| +5 Volts monitor | 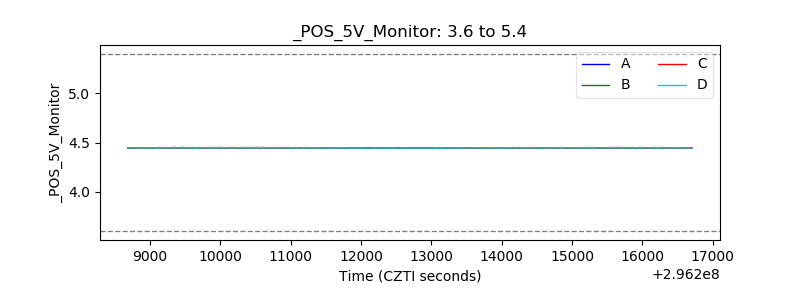 |
| _ROLL_ROT |  |
| _Roll_DEC | 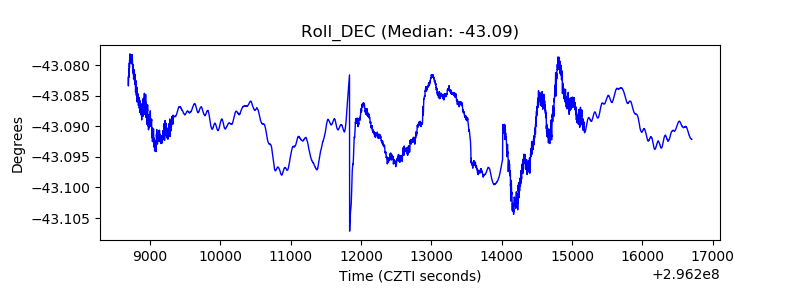 |
| _Roll_RA | 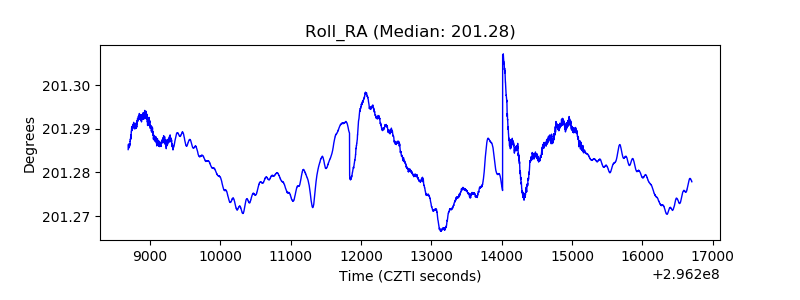 |
| Veto Counter | 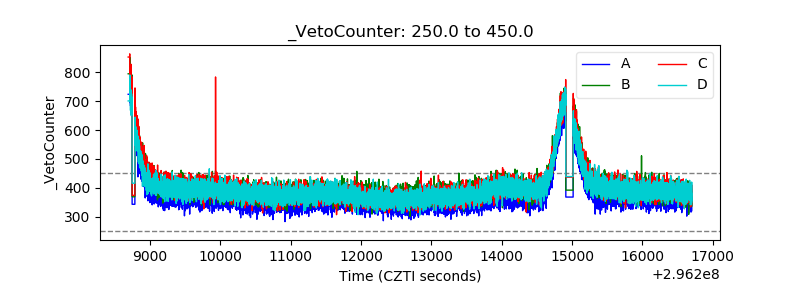 |