| Param | Original file | Final file |
|---|---|---|
| Filename | modeM0/AS1A05_013T01_9000002944_19722cztM0_level2.evt | modeM0/AS1A05_013T01_9000002944_19722cztM0_level2_quad_clean.evt |
| Size (bytes) | 951,445,440 | 172,958,400 |
| Size | 907.4 MB | 164.9 MB |
| Events in quadrant A | 5,851,994 | 1,123,943 |
| Events in quadrant B | 6,223,397 | 1,135,543 |
| Events in quadrant C | 7,805,502 | 1,068,166 |
| Events in quadrant D | 8,088,985 | 1,047,572 |
| Mode SS | |||
|---|---|---|---|
| Quadrant | BADHDUFLAG | Total packets | Discarded packets |
| A | 0 | 252 | 0 |
| B | 0 | 252 | 0 |
| C | 0 | 252 | 0 |
| D | 0 | 252 | 0 |
| Mode M0 | |||
|---|---|---|---|
| Quadrant | BADHDUFLAG | Total packets | Discarded packets |
| A | 0 | 25554 | 2 |
| B | 0 | 26468 | 2 |
| C | 0 | 31558 | 2 |
| D | 0 | 32381 | 2 |
| Mode M9 | |||
|---|---|---|---|
| Quadrant | BADHDUFLAG | Total packets | Discarded packets |
| A | 0 | 13 | 0 |
| B | 0 | 13 | 0 |
| C | 0 | 13 | 0 |
| D | 0 | 13 | 0 |
| Quadrant | Total seconds | Saturated seconds | Saturation percentage |
|---|---|---|---|
| A | 12493 | 116 | 0.928520% |
| B | 12494 | 149 | 1.192572% |
| C | 12494 | 255 | 2.040980% |
| D | 12494 | 858 | 6.867296% |
Noise dominated data is calculated using 1-second bins in cleaned event files. If a bin has >2000 counts, and if more than 50% of those come from <1% of pixels, then it is considered to be noise-dominated and hence unusable.
| Quadrant | # 1 sec bins | Bins with >0 counts | Bins with >2000 counts | High rate bins dominated by noise | Noise dominated (total time) | Noise dominated (detector-on time) | Marked lightcurve |
|---|---|---|---|---|---|---|---|
| A | 13738 | 12493 | 13 | 13 | 0.09% | 0.10% | 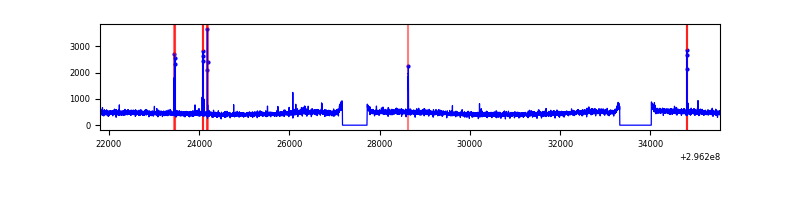 |
| B | 13739 | 12495 | 28 | 28 | 0.20% | 0.22% | 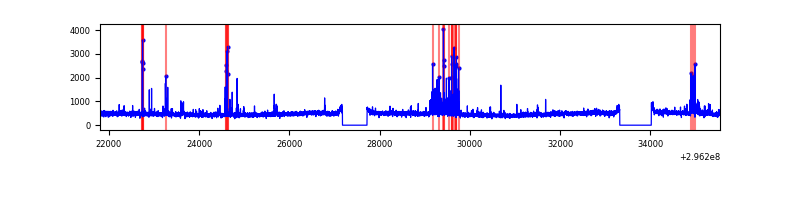 |
| C | 13739 | 12494 | 39 | 39 | 0.28% | 0.31% | 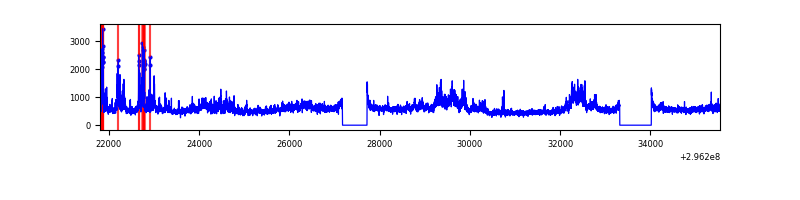 |
| D | 13739 | 12494 | 680 | 680 | 4.95% | 5.44% | 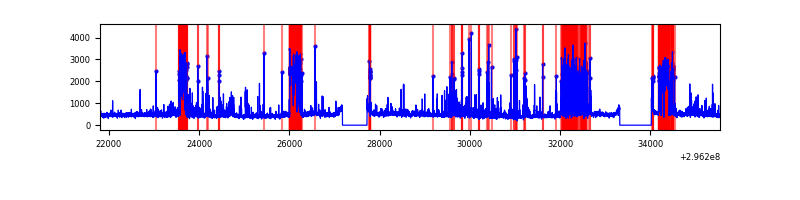 |
Top three noisy pixels from each quadrant. If the there are fewer than three noisy pixels in the level2.evt file, extra rows are filled as -1
| Pixel properties | Quadrant properties | ||||||
|---|---|---|---|---|---|---|---|
| Quadrant | DetID | PixID | Counts | Sigma | Mean | Median | Sigma |
| A | 0 | 254 | 40316 | 127.89 | 1494 | 1460 | 303.8 |
| A | 0 | 23 | 32399 | 101.83 | 1494 | 1460 | 303.8 |
| A | 0 | 226 | 14680 | 43.51 | 1494 | 1460 | 303.8 |
| B | 7 | 220 | 231860 | 808.02 | 1485 | 1449 | 285.2 |
| B | 4 | 216 | 58328 | 199.47 | 1485 | 1449 | 285.2 |
| B | 12 | 111 | 34709 | 116.64 | 1485 | 1449 | 285.2 |
| C | 3 | 233 | 1979689 | 5971.12 | 1415 | 1425 | 331.3 |
| C | 14 | 238 | 219365 | 657.82 | 1415 | 1425 | 331.3 |
| C | 7 | 247 | 65070 | 192.1 | 1415 | 1425 | 331.3 |
| D | 1 | 52 | 1526611 | 4454.47 | 1409 | 1364 | 342.4 |
| D | 12 | 218 | 479284 | 1395.76 | 1409 | 1364 | 342.4 |
| D | 12 | 233 | 342955 | 997.61 | 1409 | 1364 | 342.4 |
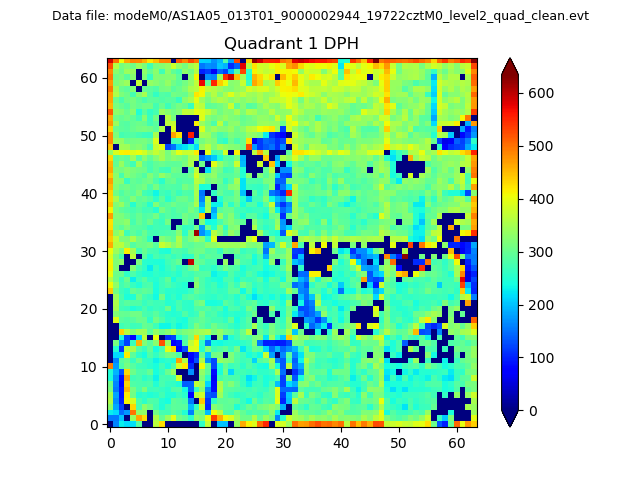
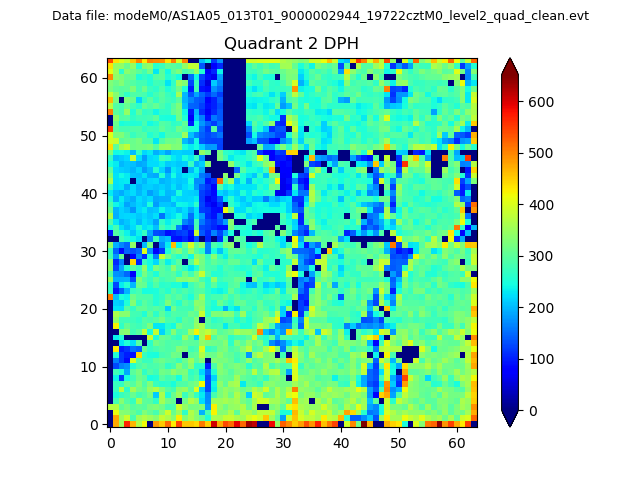
Histogram calculated using DETX and DETY for each event in the final _common_clean file
| Quadrant A |  |
 |
Quadrant B |
|---|---|---|---|
| Quadrant D | 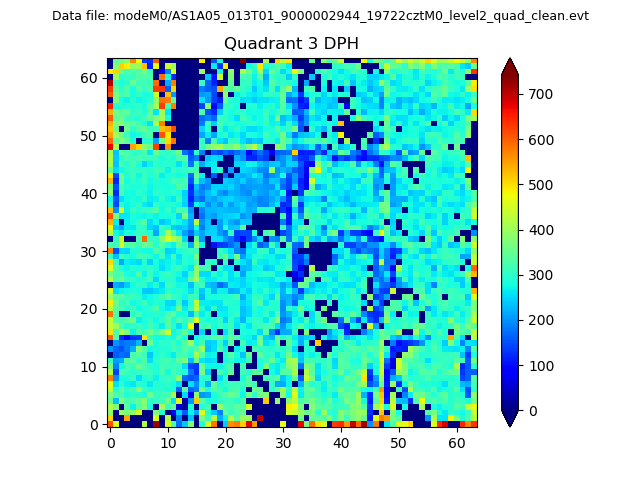 |
 |
Quadrant C |
| Plot type | Count rate plots | Images |
|---|---|---|
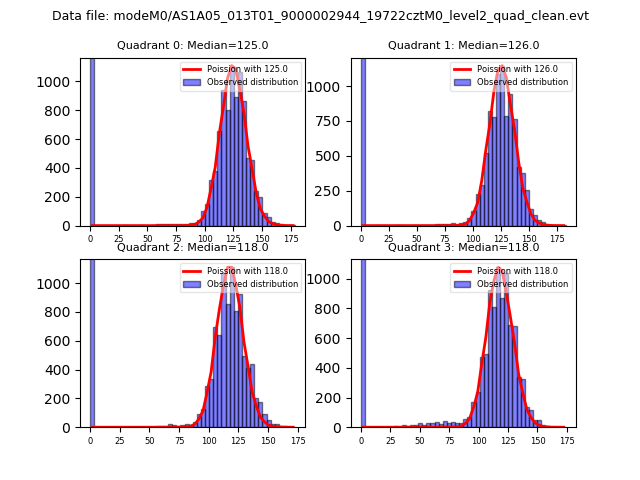
| Comparison with Poisson distribution Blue bars denote a histogram of data divided into 1 sec bins. Red curve is a Poisson curve with rate = median count rate of data. |
 |
 |
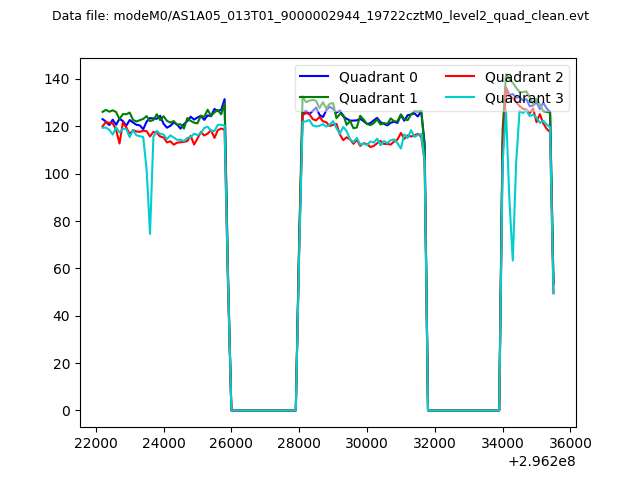
| Quadrant-wise count rates Data is divided into 100 sec bins |
 |
|
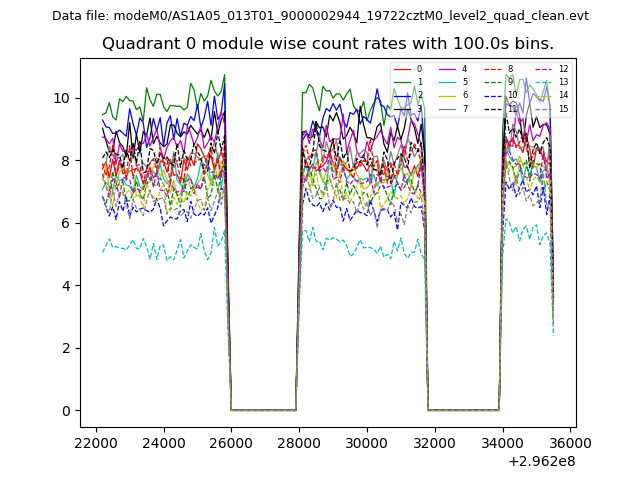
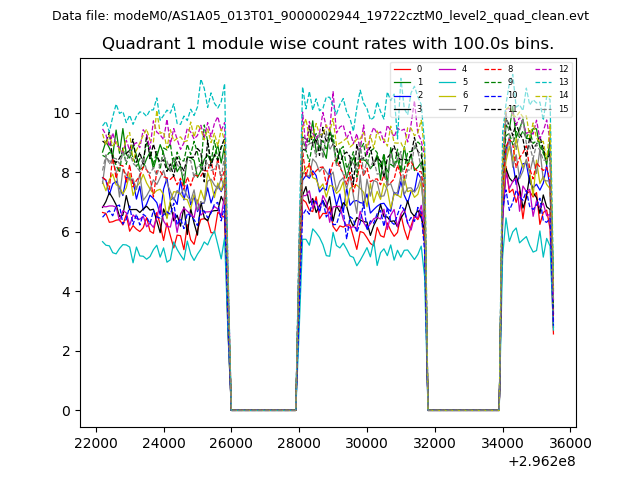
| Module-wise count rates for Quadrant A Data is divided into 100 sec bins |
 |
 |
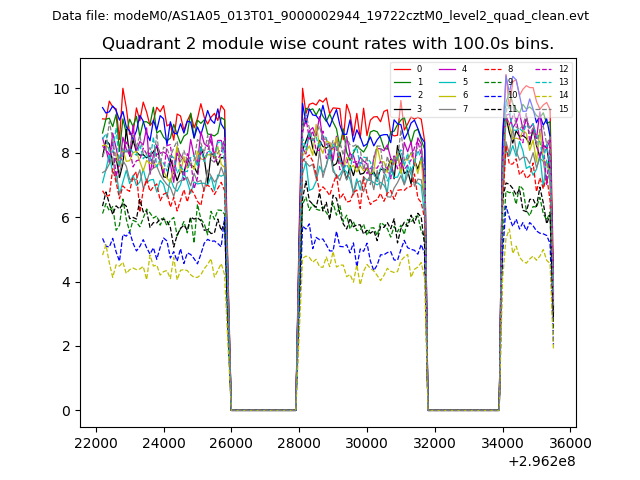
| Module-wise count rates for Quadrant B Data is divided into 100 sec bins |
 |
 |
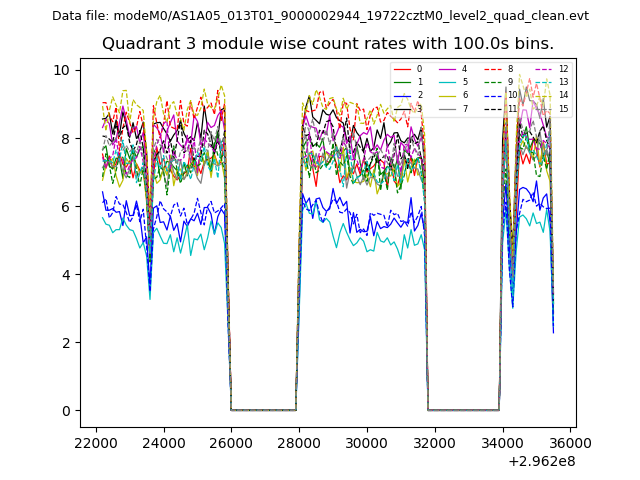
| Module-wise count rates for Quadrant C Data is divided into 100 sec bins |
 |
 |
| Module-wise count rates for Quadrant D Data is divided into 100 sec bins |
 |
 |
| Parameter | Plot |
|---|---|
| CZT HV Monitor | 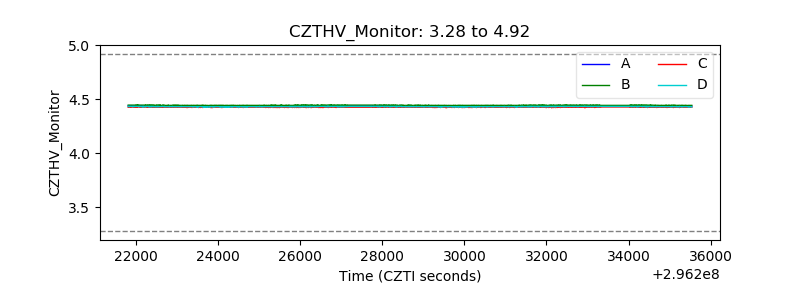 |
| D_VDD | 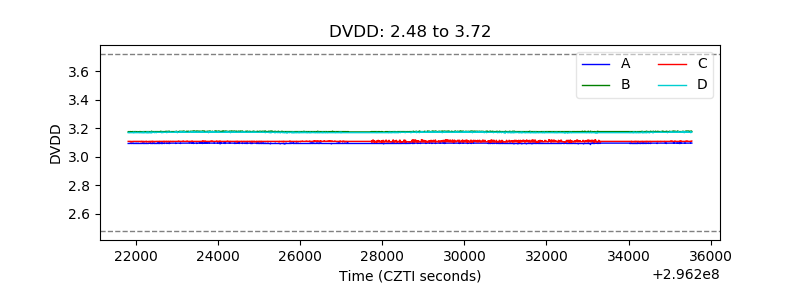 |
| Temperature 1 |  |
| Veto HV Monitor | 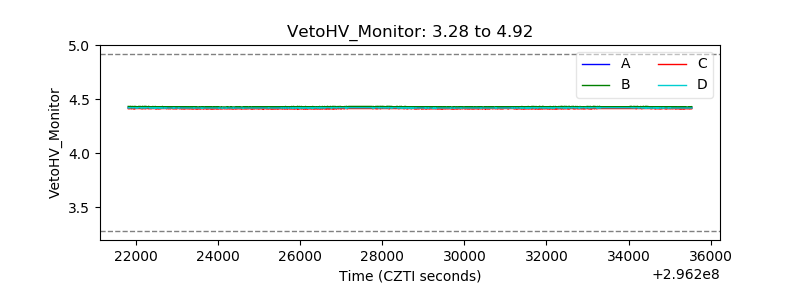 |
| Veto LLD | 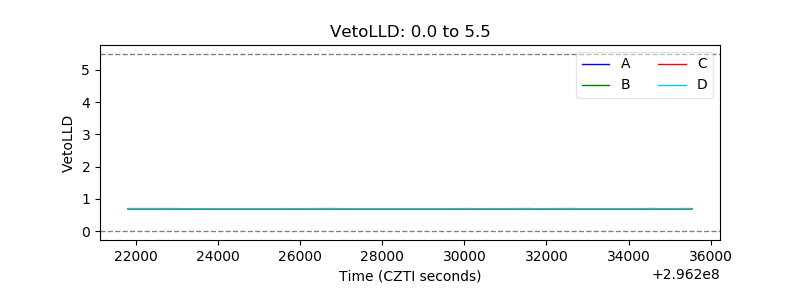 |
| Alpha Counter | 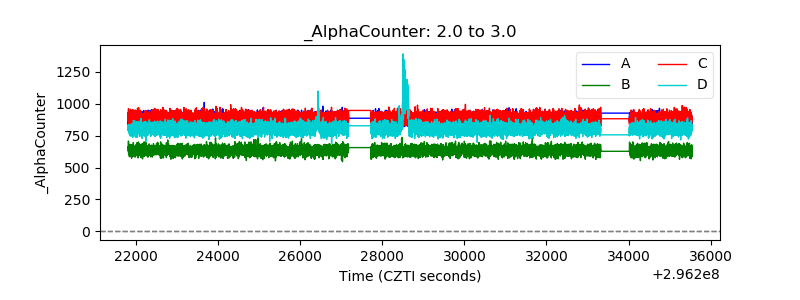 |
| _CPM_Rate | 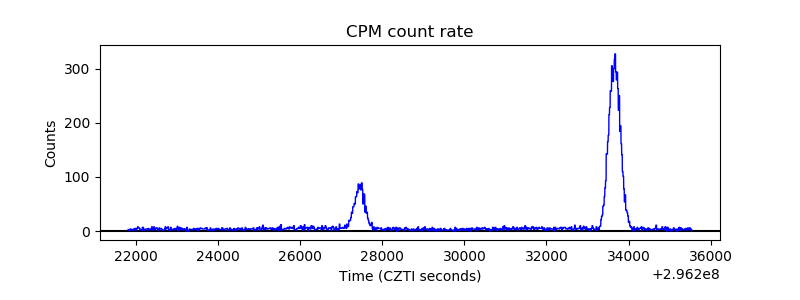 |
| CZT Counter | 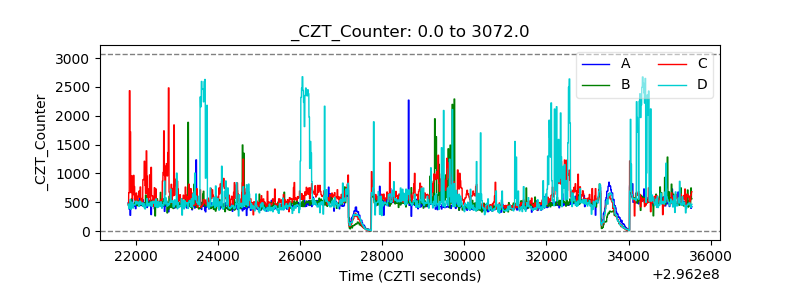 |
| +2.5 Volts monitor |  |
| +5 Volts monitor |  |
| _ROLL_ROT | 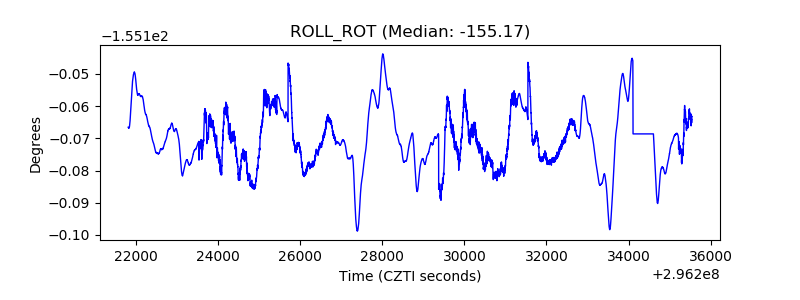 |
| _Roll_DEC | 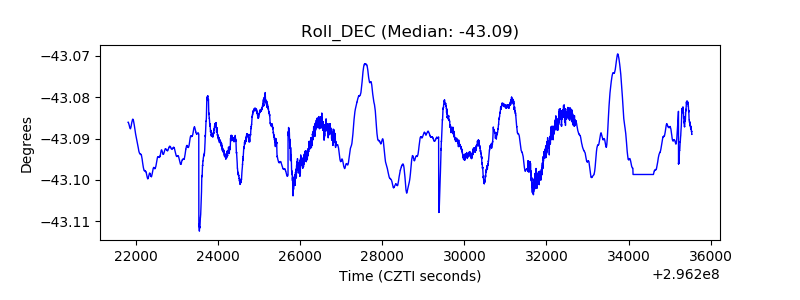 |
| _Roll_RA | 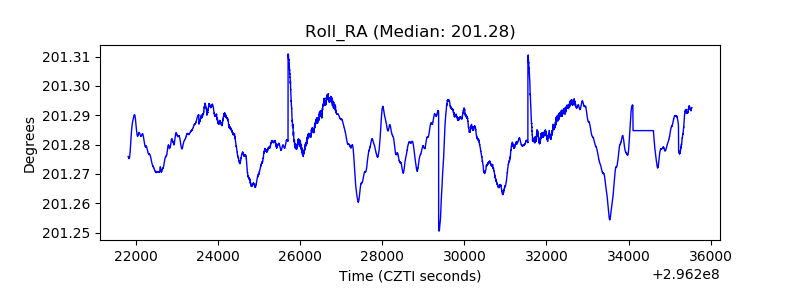 |
| Veto Counter | 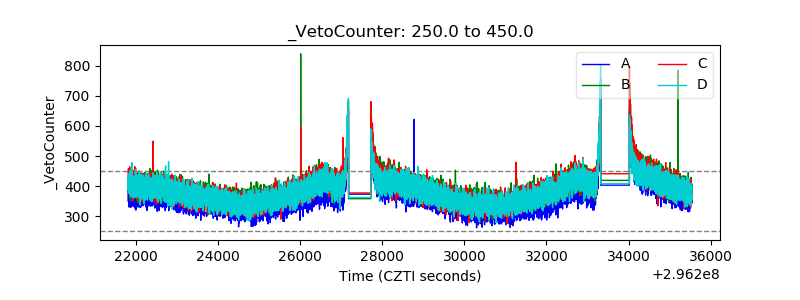 |