| Param | Original file | Final file |
|---|---|---|
| Filename | modeM0/AS1A05_013T01_9000002944_19724cztM0_level2.evt | modeM0/AS1A05_013T01_9000002944_19724cztM0_level2_quad_clean.evt |
| Size (bytes) | 486,192,960 | 96,278,400 |
| Size | 463.7 MB | 91.8 MB |
| Events in quadrant A | 3,211,959 | 633,828 |
| Events in quadrant B | 3,607,396 | 635,476 |
| Events in quadrant C | 3,631,465 | 590,076 |
| Events in quadrant D | 3,813,728 | 584,340 |
| Mode SS | |||
|---|---|---|---|
| Quadrant | BADHDUFLAG | Total packets | Discarded packets |
| A | 0 | 136 | 0 |
| B | 0 | 136 | 0 |
| C | 0 | 136 | 0 |
| D | 0 | 136 | 0 |
| Mode M0 | |||
|---|---|---|---|
| Quadrant | BADHDUFLAG | Total packets | Discarded packets |
| A | 0 | 14027 | 2 |
| B | 0 | 15189 | 2 |
| C | 0 | 15346 | 2 |
| D | 0 | 16031 | 2 |
| Mode M9 | |||
|---|---|---|---|
| Quadrant | BADHDUFLAG | Total packets | Discarded packets |
| A | 0 | 13 | 0 |
| B | 0 | 14 | 0 |
| C | 0 | 14 | 0 |
| D | 0 | 14 | 0 |
| Quadrant | Total seconds | Saturated seconds | Saturation percentage |
|---|---|---|---|
| A | 6778 | 20 | 0.295072% |
| B | 6778 | 67 | 0.988492% |
| C | 6778 | 64 | 0.944231% |
| D | 6778 | 217 | 3.201534% |
Noise dominated data is calculated using 1-second bins in cleaned event files. If a bin has >2000 counts, and if more than 50% of those come from <1% of pixels, then it is considered to be noise-dominated and hence unusable.
| Quadrant | # 1 sec bins | Bins with >0 counts | Bins with >2000 counts | High rate bins dominated by noise | Noise dominated (total time) | Noise dominated (detector-on time) | Marked lightcurve |
|---|---|---|---|---|---|---|---|
| A | 7838 | 6779 | 0 | 0 | 0.00% | 0.00% | 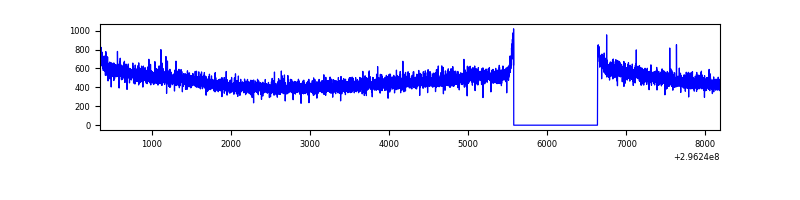 |
| B | 7838 | 6779 | 35 | 35 | 0.45% | 0.52% | 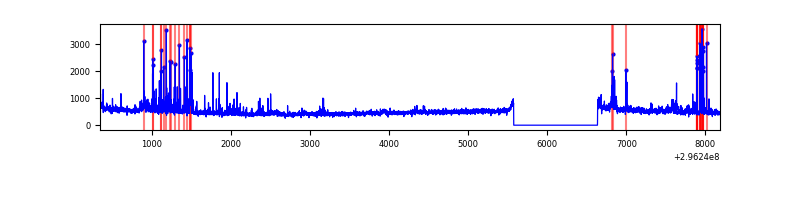 |
| C | 7838 | 6779 | 0 | 0 | 0.00% | 0.00% | 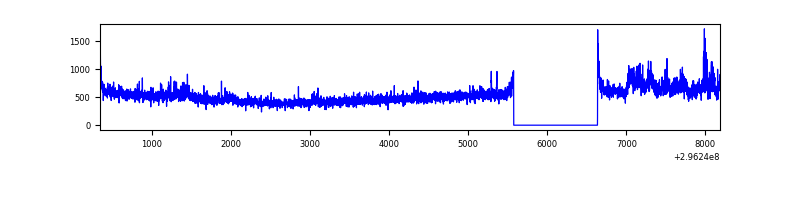 |
| D | 7838 | 6779 | 147 | 147 | 1.88% | 2.17% | 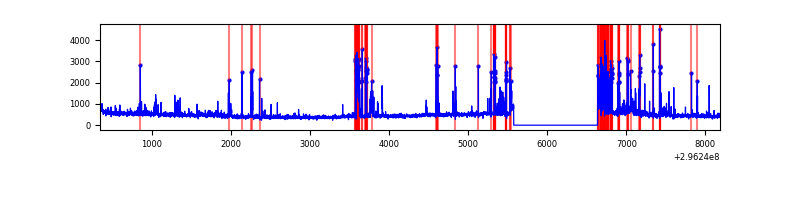 |
Top three noisy pixels from each quadrant. If the there are fewer than three noisy pixels in the level2.evt file, extra rows are filled as -1
| Pixel properties | Quadrant properties | ||||||
|---|---|---|---|---|---|---|---|
| Quadrant | DetID | PixID | Counts | Sigma | Mean | Median | Sigma |
| A | 6 | 16 | 8466 | 45.35 | 832 | 815 | 168.7 |
| A | 0 | 226 | 7236 | 38.06 | 832 | 815 | 168.7 |
| A | 3 | 137 | 6624 | 34.43 | 832 | 815 | 168.7 |
| B | 7 | 220 | 227890 | 1419.47 | 826 | 807 | 160.0 |
| B | 4 | 171 | 40920 | 250.74 | 826 | 807 | 160.0 |
| B | 4 | 216 | 40211 | 246.31 | 826 | 807 | 160.0 |
| C | 3 | 233 | 455709 | 2512.09 | 778 | 784 | 181.1 |
| C | 14 | 238 | 123272 | 676.38 | 778 | 784 | 181.1 |
| C | 7 | 247 | 13934 | 72.61 | 778 | 784 | 181.1 |
| D | 1 | 52 | 639787 | 3344.22 | 787 | 764 | 191.1 |
| D | 2 | 16 | 71962 | 372.6 | 787 | 764 | 191.1 |
| D | 7 | 96 | 33698 | 172.35 | 787 | 764 | 191.1 |
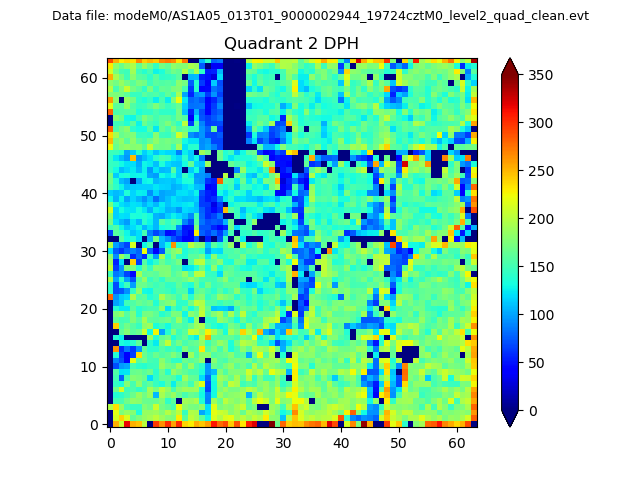
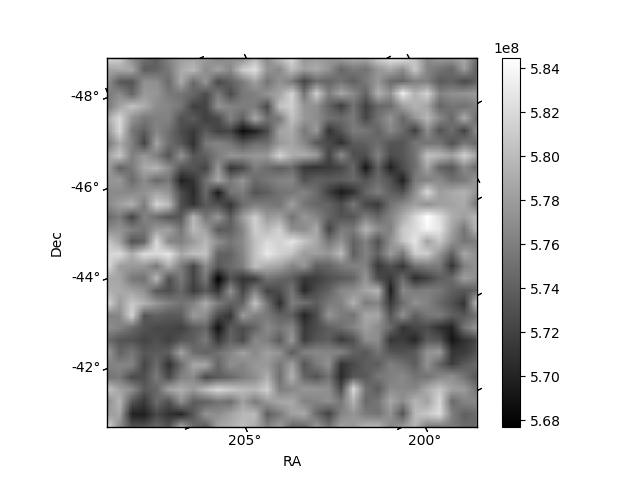
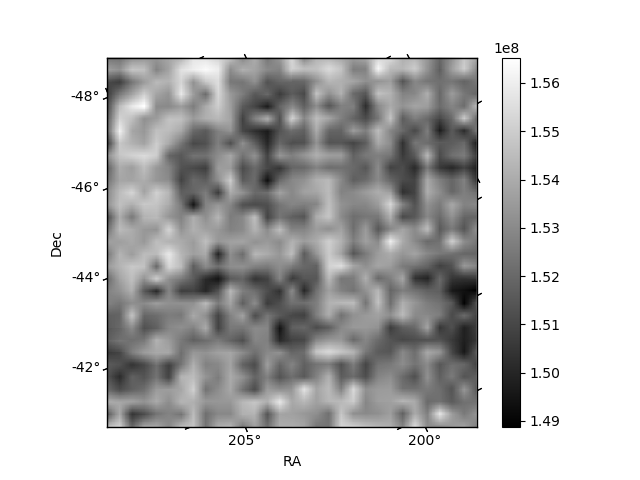
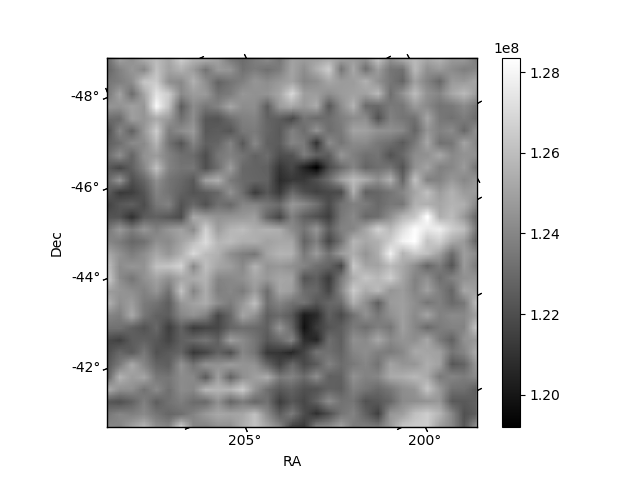
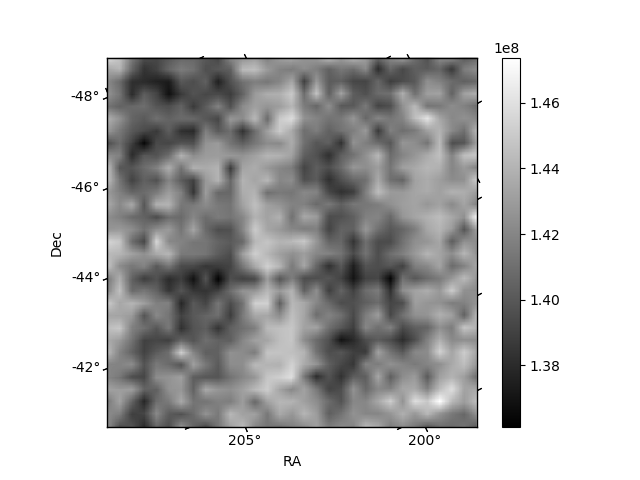
Histogram calculated using DETX and DETY for each event in the final _common_clean file
| Quadrant A | 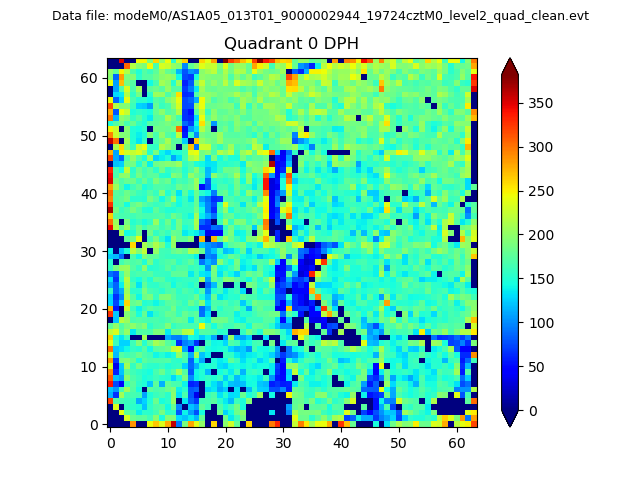 |
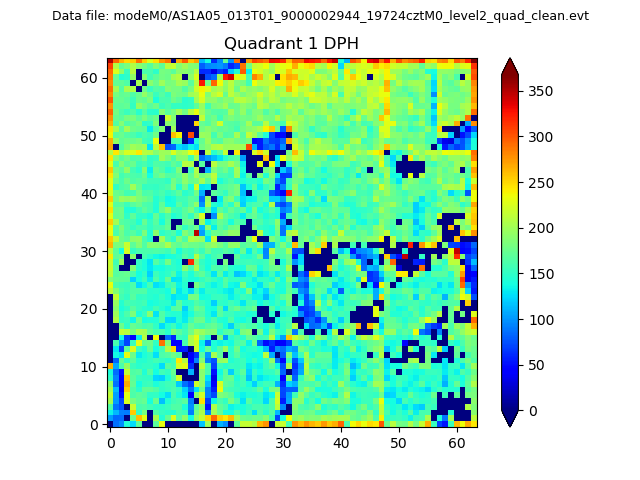 |
Quadrant B |
|---|---|---|---|
| Quadrant D | 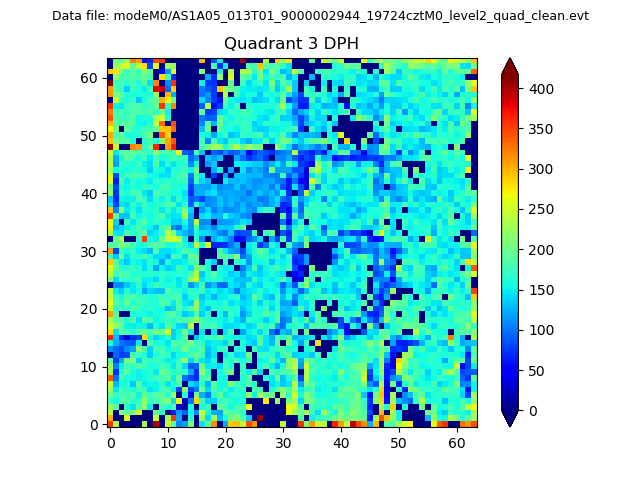 |
 |
Quadrant C |
| Plot type | Count rate plots | Images |
|---|---|---|
| Comparison with Poisson distribution Blue bars denote a histogram of data divided into 1 sec bins. Red curve is a Poisson curve with rate = median count rate of data. |
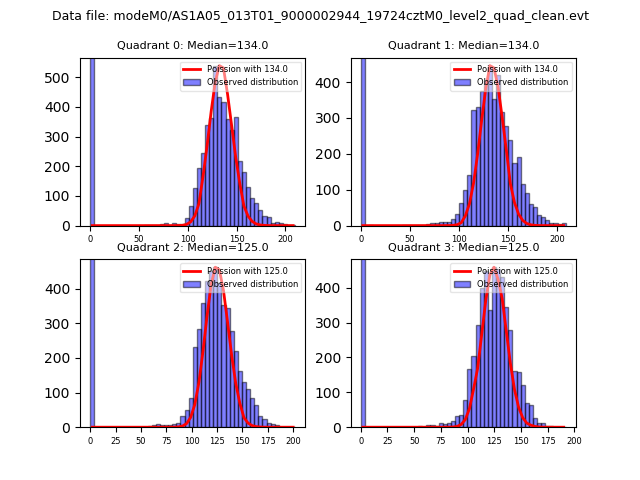 |
 |
| Quadrant-wise count rates Data is divided into 100 sec bins |
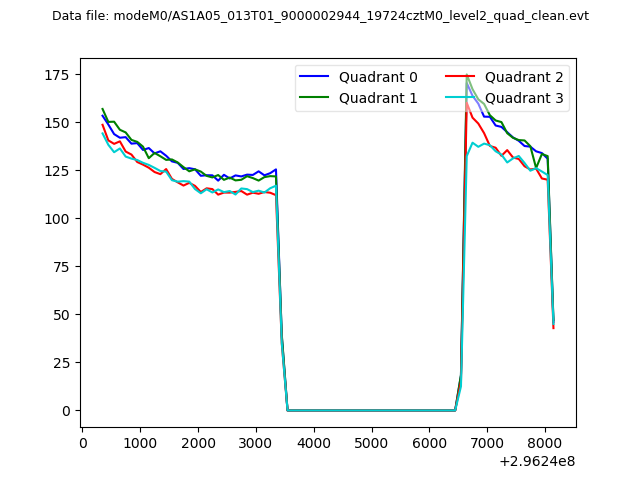 |
|
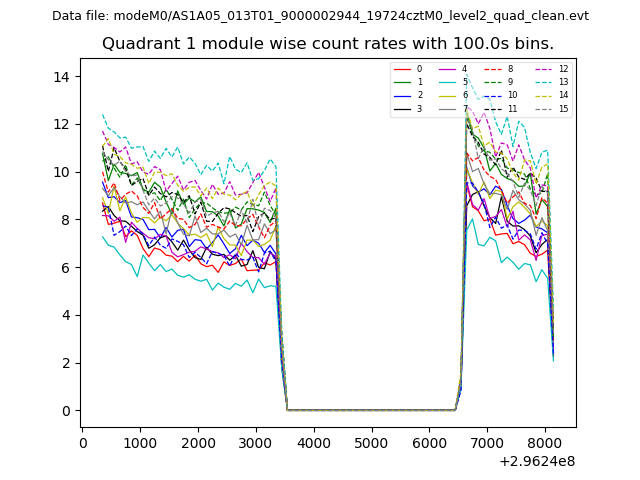
| Module-wise count rates for Quadrant A Data is divided into 100 sec bins |
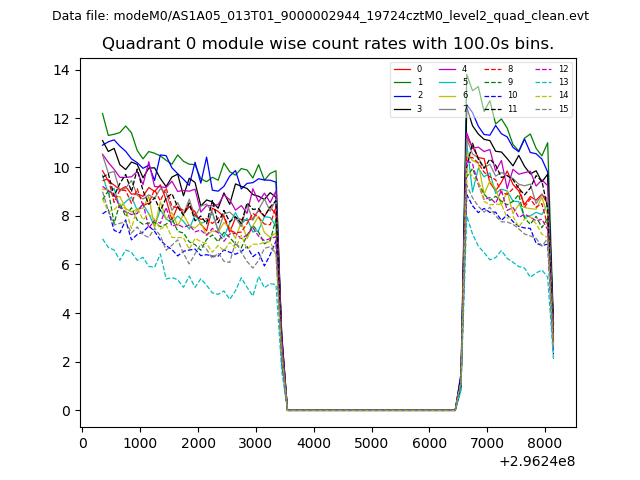 |
 |
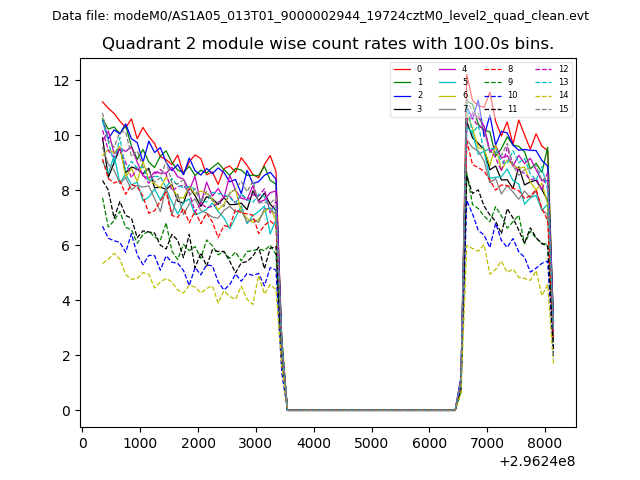
| Module-wise count rates for Quadrant B Data is divided into 100 sec bins |
 |
 |
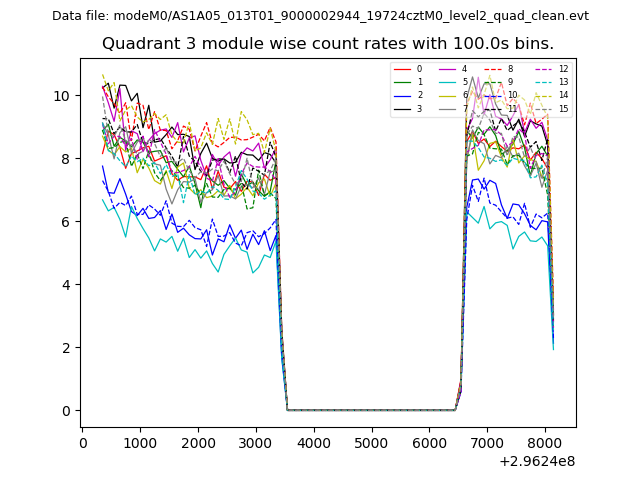
| Module-wise count rates for Quadrant C Data is divided into 100 sec bins |
 |
 |
| Module-wise count rates for Quadrant D Data is divided into 100 sec bins |
 |
 |
| Parameter | Plot |
|---|---|
| CZT HV Monitor | 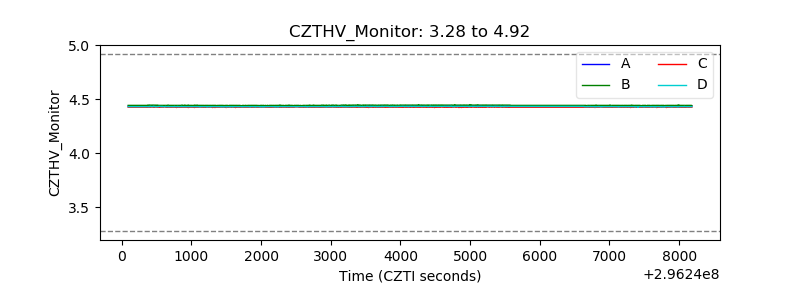 |
| D_VDD | 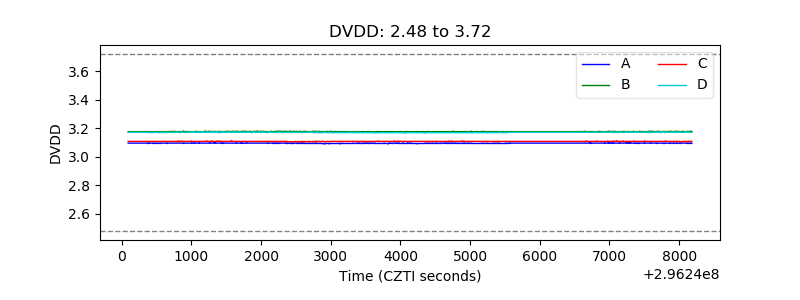 |
| Temperature 1 | 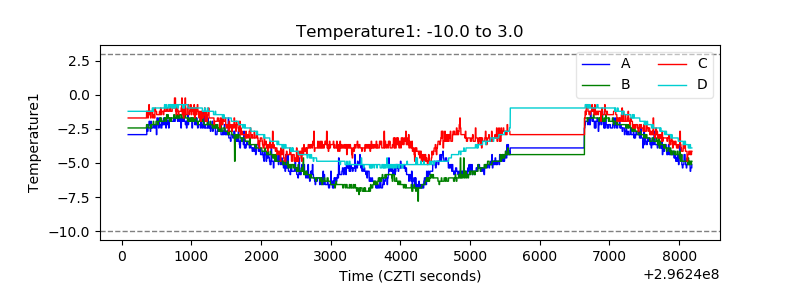 |
| Veto HV Monitor | 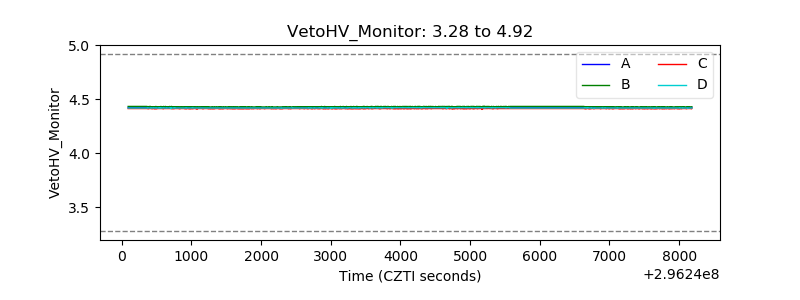 |
| Veto LLD | 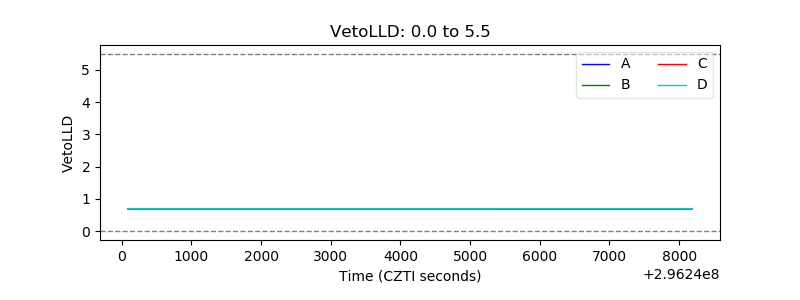 |
| Alpha Counter | 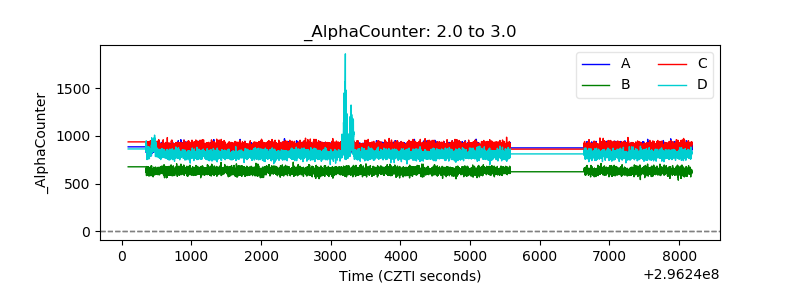 |
| _CPM_Rate | 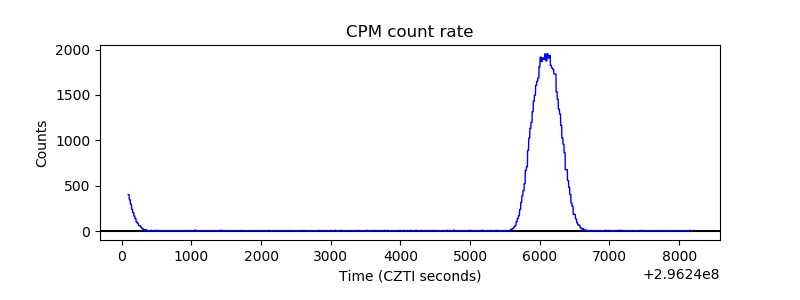 |
| CZT Counter | 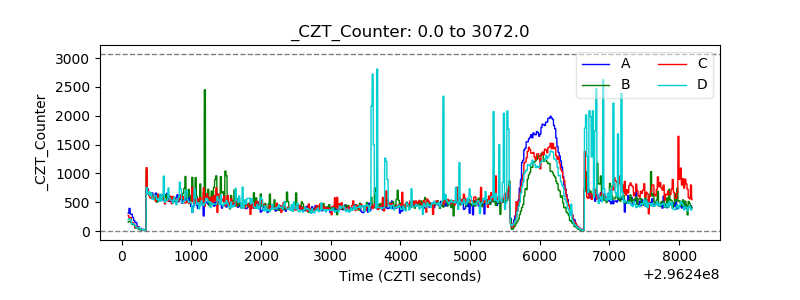 |
| +2.5 Volts monitor |  |
| +5 Volts monitor |  |
| _ROLL_ROT | 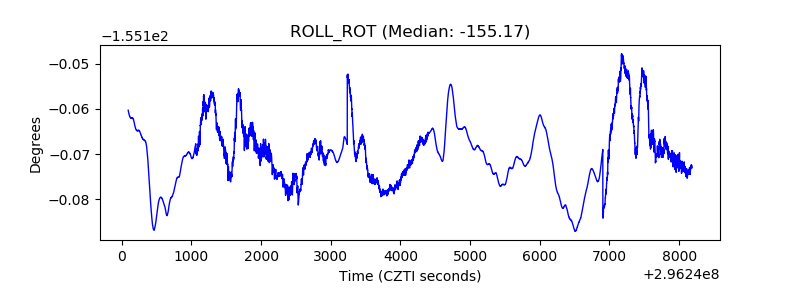 |
| _Roll_DEC | 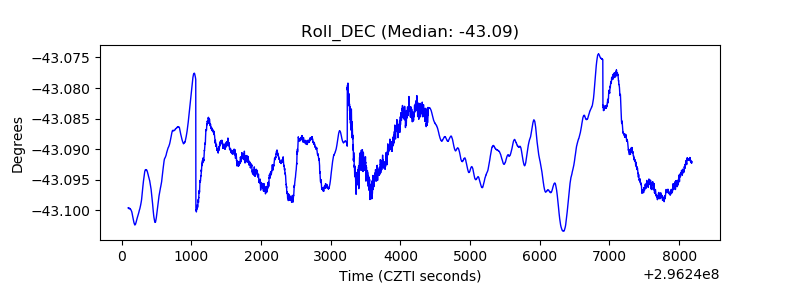 |
| _Roll_RA | 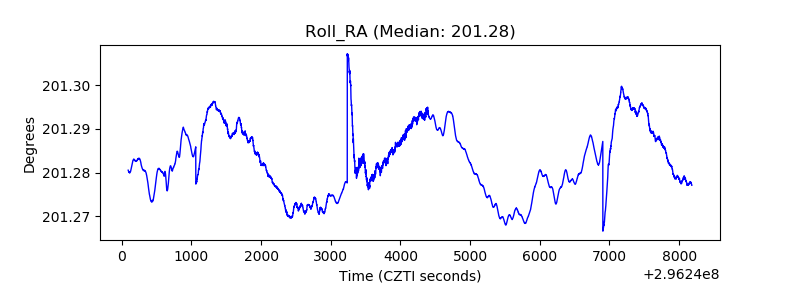 |
| Veto Counter | 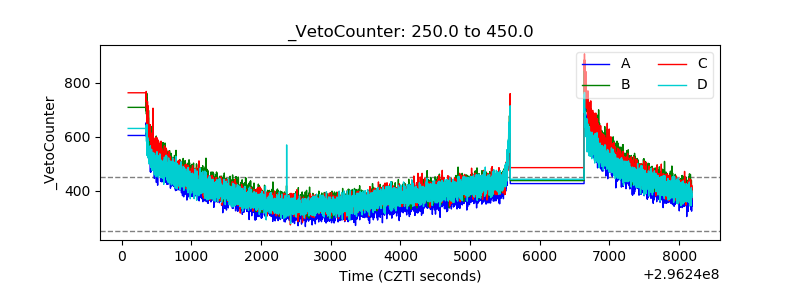 |