| Param | Original file | Final file |
|---|---|---|
| Filename | modeM0/AS1A05_013T01_9000002944_19726cztM0_level2.evt | modeM0/AS1A05_013T01_9000002944_19726cztM0_level2_quad_clean.evt |
| Size (bytes) | 473,420,160 | 93,905,280 |
| Size | 451.5 MB | 89.6 MB |
| Events in quadrant A | 3,079,108 | 621,422 |
| Events in quadrant B | 3,438,996 | 631,471 |
| Events in quadrant C | 3,607,319 | 581,046 |
| Events in quadrant D | 3,776,940 | 562,757 |
| Mode SS | |||
|---|---|---|---|
| Quadrant | BADHDUFLAG | Total packets | Discarded packets |
| A | 0 | 130 | 0 |
| B | 0 | 130 | 0 |
| C | 0 | 130 | 0 |
| D | 0 | 130 | 0 |
| Mode M0 | |||
|---|---|---|---|
| Quadrant | BADHDUFLAG | Total packets | Discarded packets |
| A | 0 | 13382 | 2 |
| B | 0 | 14422 | 6 |
| C | 0 | 14974 | 2 |
| D | 0 | 15735 | 2 |
| Mode M9 | |||
|---|---|---|---|
| Quadrant | BADHDUFLAG | Total packets | Discarded packets |
| A | 0 | 12 | 0 |
| B | 0 | 13 | 0 |
| C | 0 | 13 | 0 |
| D | 0 | 13 | 0 |
| Quadrant | Total seconds | Saturated seconds | Saturation percentage |
|---|---|---|---|
| A | 6409 | 18 | 0.280855% |
| B | 6408 | 53 | 0.827091% |
| C | 6408 | 67 | 1.045568% |
| D | 6408 | 196 | 3.058677% |
Noise dominated data is calculated using 1-second bins in cleaned event files. If a bin has >2000 counts, and if more than 50% of those come from <1% of pixels, then it is considered to be noise-dominated and hence unusable.
| Quadrant | # 1 sec bins | Bins with >0 counts | Bins with >2000 counts | High rate bins dominated by noise | Noise dominated (total time) | Noise dominated (detector-on time) | Marked lightcurve |
|---|---|---|---|---|---|---|---|
| A | 7599 | 6410 | 0 | 0 | 0.00% | 0.00% | 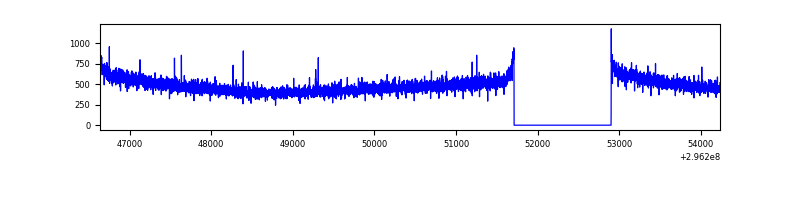 |
| B | 7598 | 6409 | 24 | 24 | 0.32% | 0.37% | 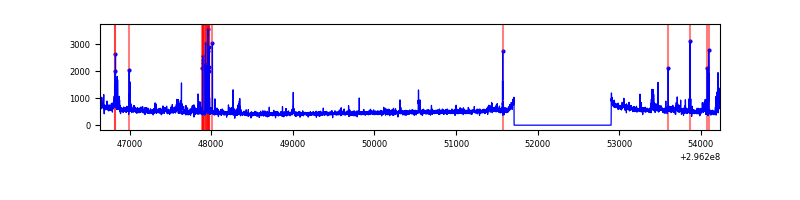 |
| C | 7598 | 6409 | 1 | 1 | 0.01% | 0.02% | 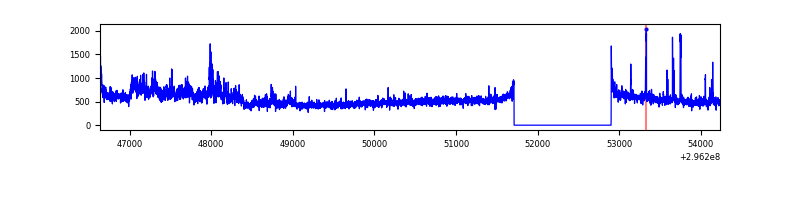 |
| D | 7598 | 6409 | 145 | 145 | 1.91% | 2.26% | 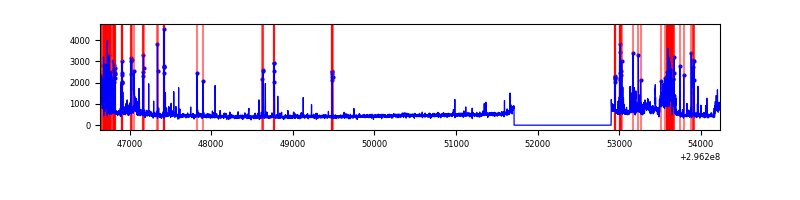 |
Top three noisy pixels from each quadrant. If the there are fewer than three noisy pixels in the level2.evt file, extra rows are filled as -1
| Pixel properties | Quadrant properties | ||||||
|---|---|---|---|---|---|---|---|
| Quadrant | DetID | PixID | Counts | Sigma | Mean | Median | Sigma |
| A | 0 | 226 | 6856 | 37.65 | 799 | 784 | 161.3 |
| A | 3 | 137 | 6344 | 34.48 | 799 | 784 | 161.3 |
| A | 12 | 194 | 5753 | 30.81 | 799 | 784 | 161.3 |
| B | 7 | 220 | 105442 | 683.12 | 801 | 783 | 153.2 |
| B | 0 | 189 | 71449 | 461.25 | 801 | 783 | 153.2 |
| B | 4 | 171 | 44065 | 282.51 | 801 | 783 | 153.2 |
| C | 3 | 233 | 510442 | 2899.46 | 754 | 760 | 175.8 |
| C | 14 | 238 | 118394 | 669.19 | 754 | 760 | 175.8 |
| C | 7 | 247 | 34789 | 193.58 | 754 | 760 | 175.8 |
| D | 1 | 52 | 420431 | 2282.49 | 754 | 733 | 183.9 |
| D | 12 | 218 | 376772 | 2045.06 | 754 | 733 | 183.9 |
| D | 2 | 16 | 41780 | 223.23 | 754 | 733 | 183.9 |
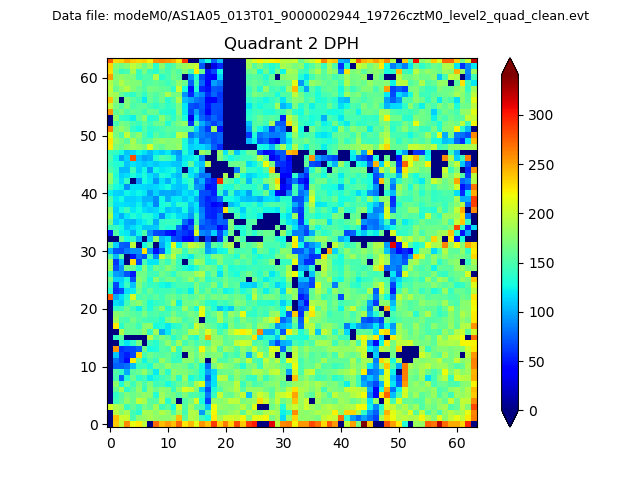
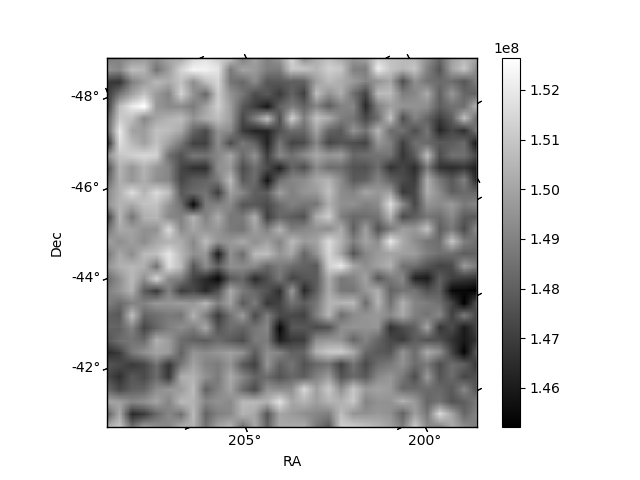
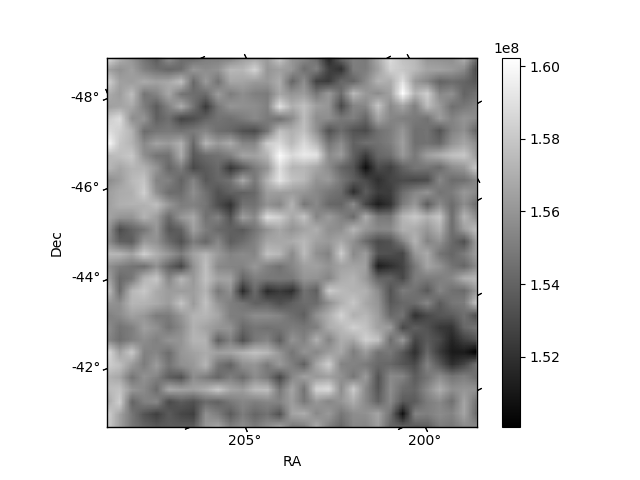
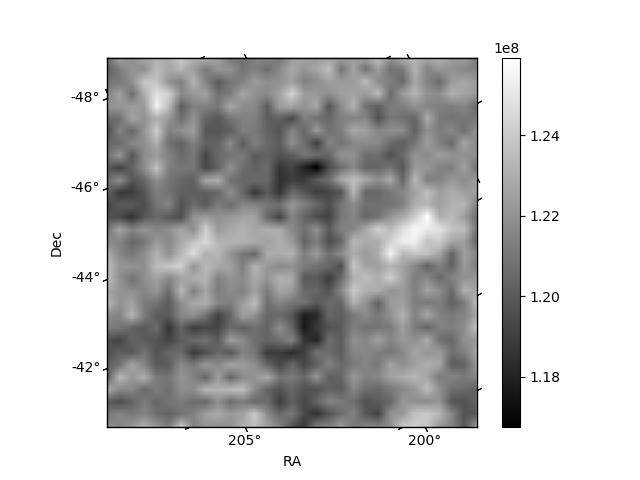
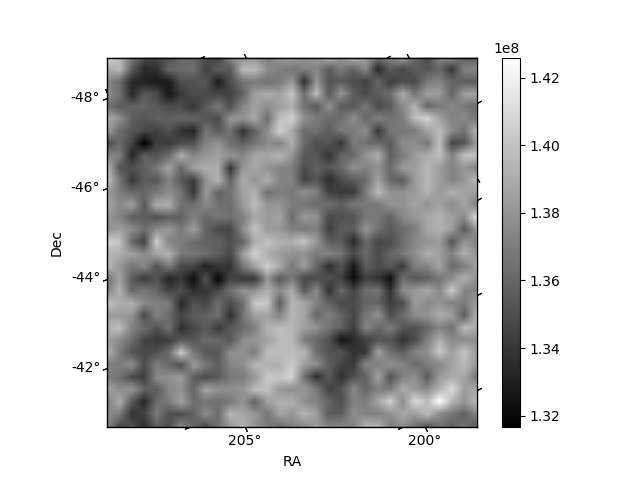
Histogram calculated using DETX and DETY for each event in the final _common_clean file
| Quadrant A | 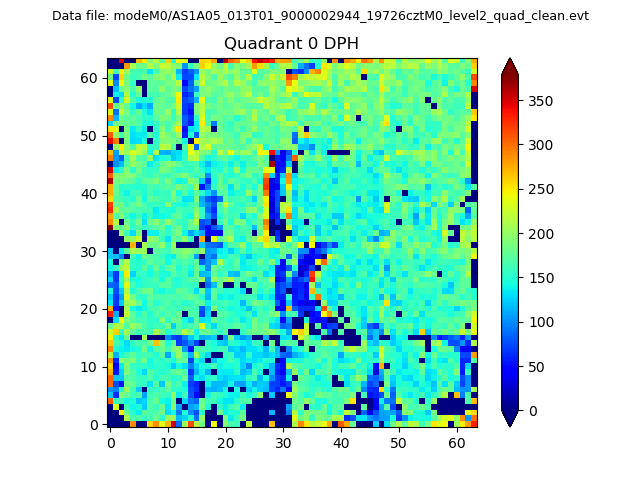 |
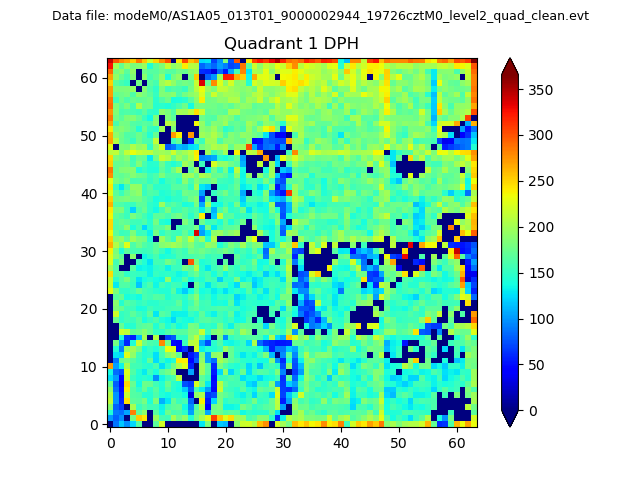 |
Quadrant B |
|---|---|---|---|
| Quadrant D | 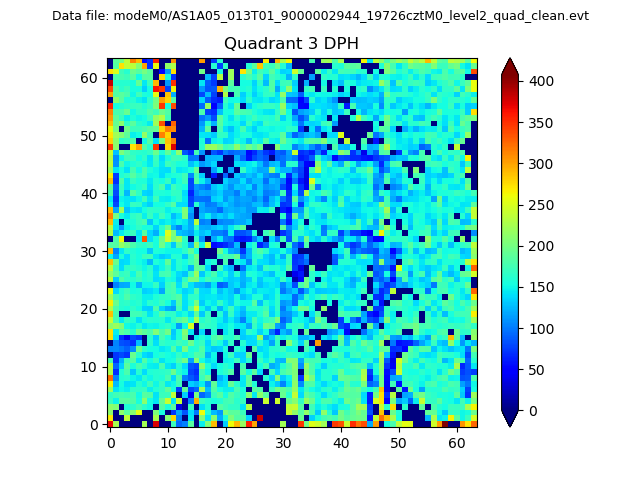 |
 |
Quadrant C |
| Plot type | Count rate plots | Images |
|---|---|---|
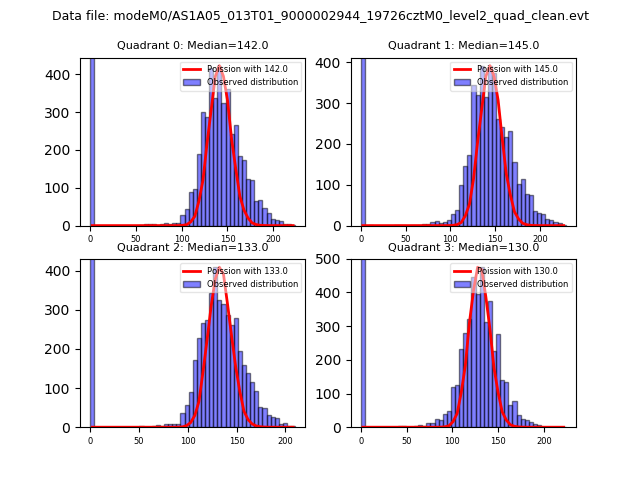
| Comparison with Poisson distribution Blue bars denote a histogram of data divided into 1 sec bins. Red curve is a Poisson curve with rate = median count rate of data. |
 |
 |
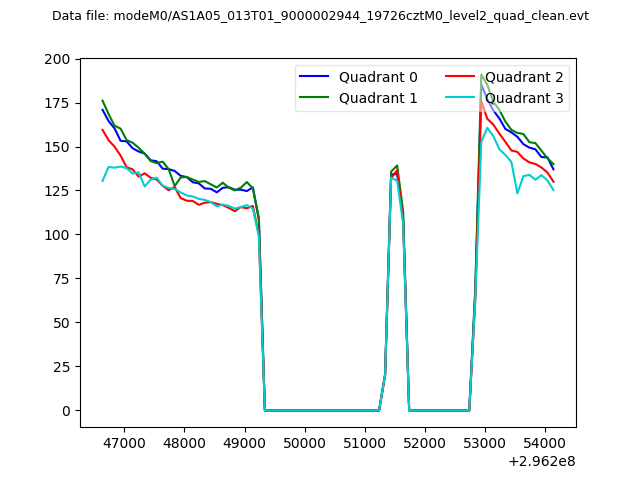
| Quadrant-wise count rates Data is divided into 100 sec bins |
 |
|
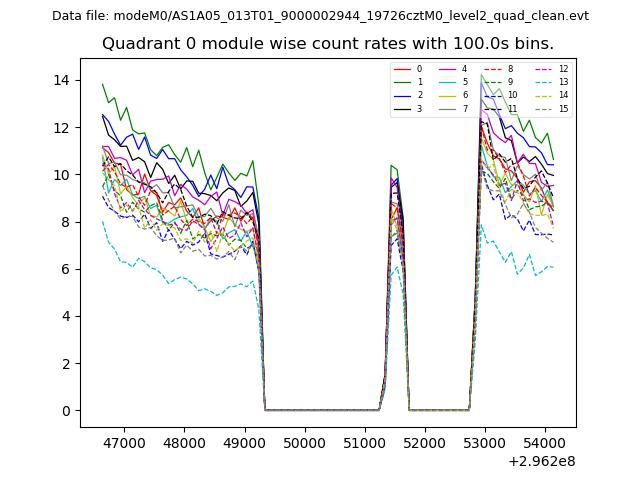
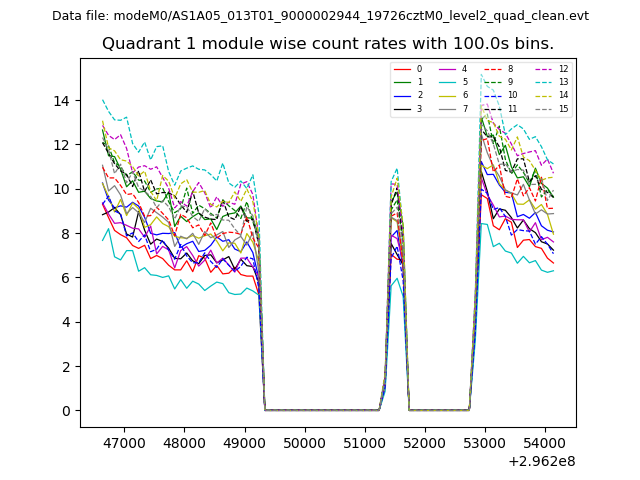
| Module-wise count rates for Quadrant A Data is divided into 100 sec bins |
 |
 |
| Module-wise count rates for Quadrant B Data is divided into 100 sec bins |
 |
 |
| Module-wise count rates for Quadrant C Data is divided into 100 sec bins |
 |
 |
| Module-wise count rates for Quadrant D Data is divided into 100 sec bins |
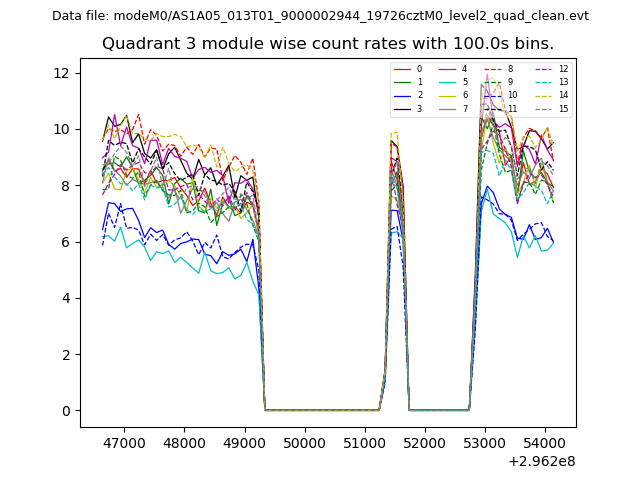 |
 |
| Parameter | Plot |
|---|---|
| CZT HV Monitor | 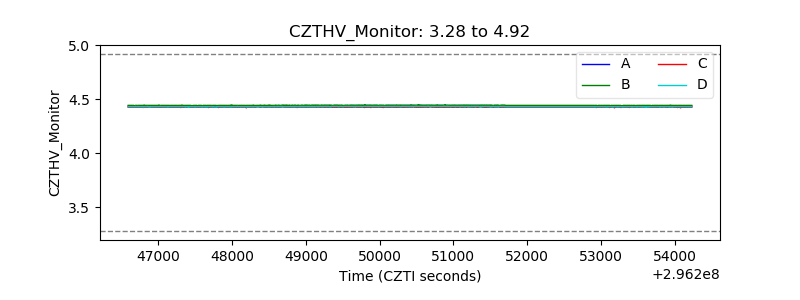 |
| D_VDD | 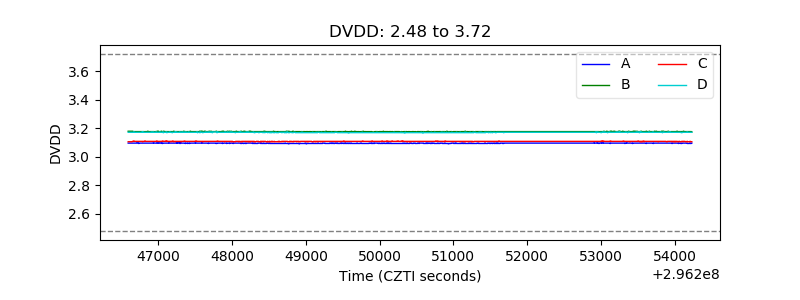 |
| Temperature 1 | 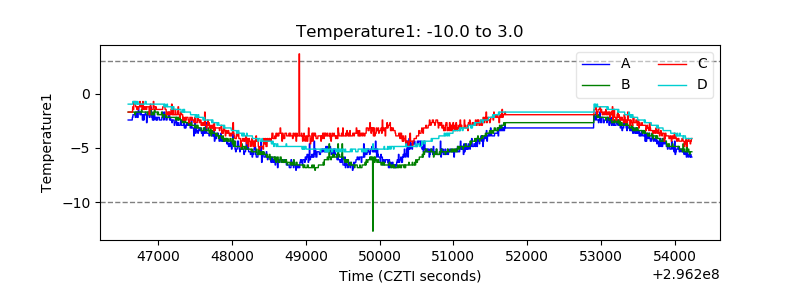 |
| Veto HV Monitor | 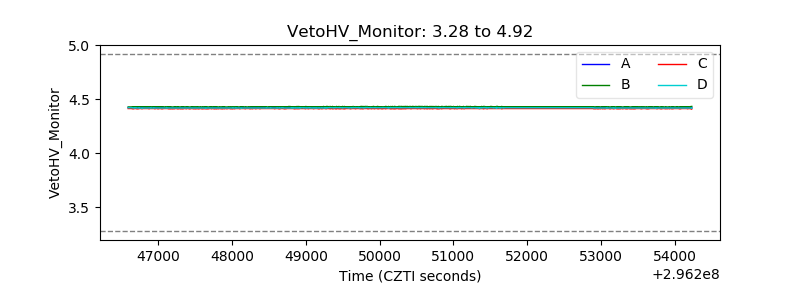 |
| Veto LLD | 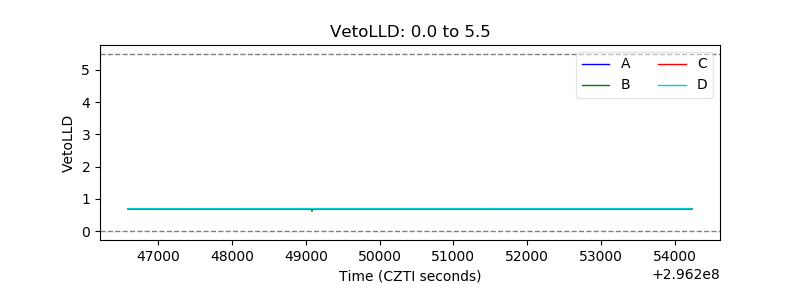 |
| Alpha Counter | 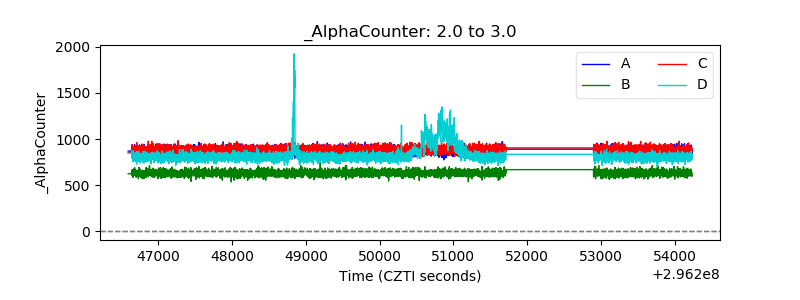 |
| _CPM_Rate | 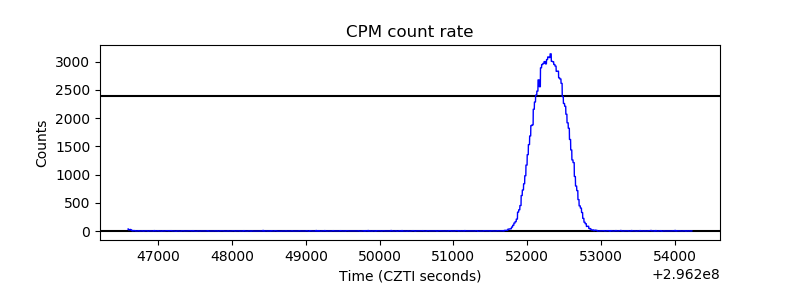 |
| CZT Counter | 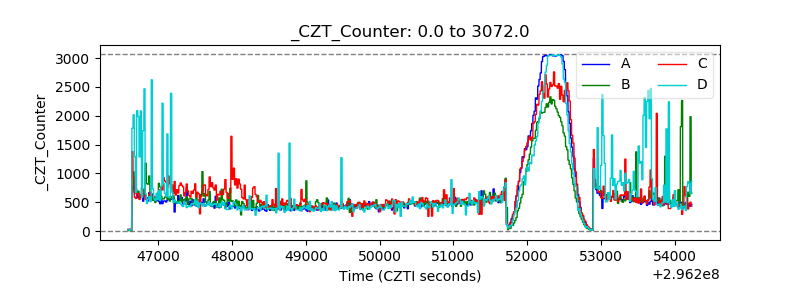 |
| +2.5 Volts monitor |  |
| +5 Volts monitor |  |
| _ROLL_ROT | 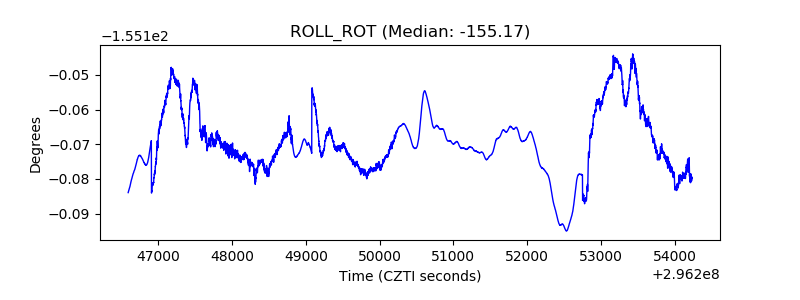 |
| _Roll_DEC |  |
| _Roll_RA | 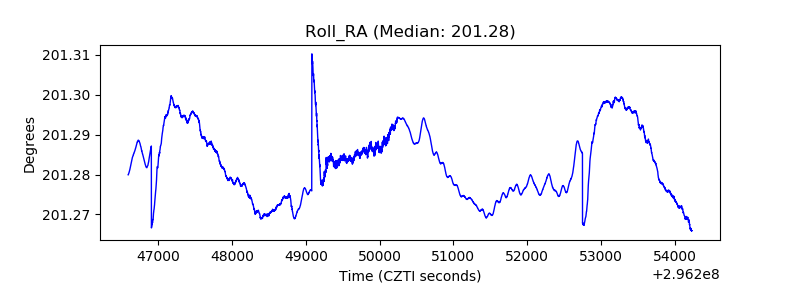 |
| Veto Counter | 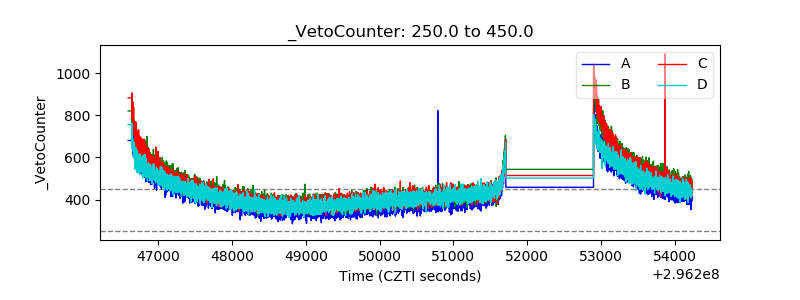 |