| Param | Original file | Final file |
|---|---|---|
| Filename | modeM0/AS1A05_013T01_9000002944_19727cztM0_level2.evt | modeM0/AS1A05_013T01_9000002944_19727cztM0_level2_quad_clean.evt |
| Size (bytes) | 475,439,040 | 95,774,400 |
| Size | 453.4 MB | 91.3 MB |
| Events in quadrant A | 3,081,154 | 635,128 |
| Events in quadrant B | 3,404,706 | 649,393 |
| Events in quadrant C | 3,344,092 | 606,818 |
| Events in quadrant D | 4,143,988 | 572,419 |
| Mode SS | |||
|---|---|---|---|
| Quadrant | BADHDUFLAG | Total packets | Discarded packets |
| A | 0 | 126 | 0 |
| B | 0 | 126 | 0 |
| C | 0 | 126 | 0 |
| D | 0 | 126 | 0 |
| Mode M0 | |||
|---|---|---|---|
| Quadrant | BADHDUFLAG | Total packets | Discarded packets |
| A | 0 | 13141 | 2 |
| B | 0 | 14084 | 2 |
| C | 0 | 13825 | 3 |
| D | 0 | 16660 | 2 |
| Mode M9 | |||
|---|---|---|---|
| Quadrant | BADHDUFLAG | Total packets | Discarded packets |
| A | 0 | 21 | 0 |
| B | 0 | 22 | 0 |
| C | 0 | 22 | 0 |
| D | 0 | 22 | 0 |
| Quadrant | Total seconds | Saturated seconds | Saturation percentage |
|---|---|---|---|
| A | 6262 | 23 | 0.367295% |
| B | 6262 | 45 | 0.718620% |
| C | 6261 | 46 | 0.734707% |
| D | 6261 | 251 | 4.008944% |
Noise dominated data is calculated using 1-second bins in cleaned event files. If a bin has >2000 counts, and if more than 50% of those come from <1% of pixels, then it is considered to be noise-dominated and hence unusable.
| Quadrant | # 1 sec bins | Bins with >0 counts | Bins with >2000 counts | High rate bins dominated by noise | Noise dominated (total time) | Noise dominated (detector-on time) | Marked lightcurve |
|---|---|---|---|---|---|---|---|
| A | 7572 | 6263 | 0 | 0 | 0.00% | 0.00% | 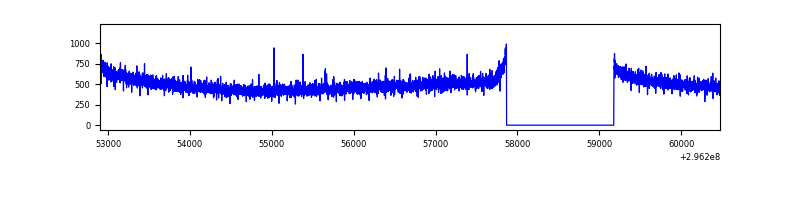 |
| B | 7572 | 6263 | 11 | 11 | 0.15% | 0.18% | 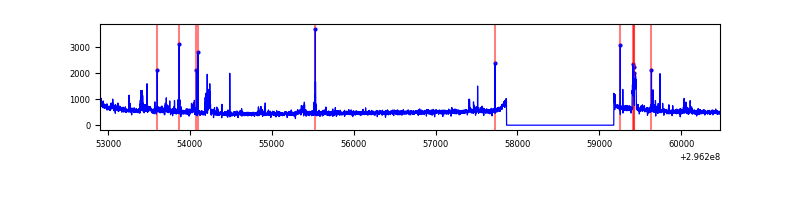 |
| C | 7571 | 6262 | 3 | 3 | 0.04% | 0.05% | 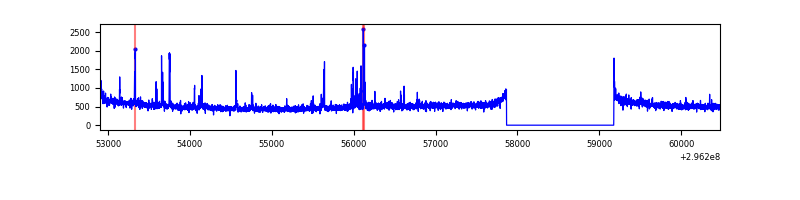 |
| D | 7571 | 6262 | 205 | 205 | 2.71% | 3.27% | 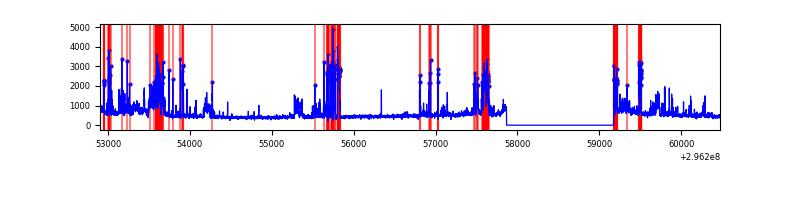 |
Top three noisy pixels from each quadrant. If the there are fewer than three noisy pixels in the level2.evt file, extra rows are filled as -1
| Pixel properties | Quadrant properties | ||||||
|---|---|---|---|---|---|---|---|
| Quadrant | DetID | PixID | Counts | Sigma | Mean | Median | Sigma |
| A | 13 | 254 | 7123 | 38.84 | 800 | 784 | 163.2 |
| A | 0 | 226 | 6938 | 37.71 | 800 | 784 | 163.2 |
| A | 3 | 137 | 6111 | 32.64 | 800 | 784 | 163.2 |
| B | 0 | 189 | 71483 | 467.92 | 805 | 786 | 151.1 |
| B | 3 | 64 | 58278 | 380.52 | 805 | 786 | 151.1 |
| B | 0 | 197 | 35153 | 227.47 | 805 | 786 | 151.1 |
| C | 3 | 233 | 213752 | 1208.01 | 761 | 767 | 176.3 |
| C | 14 | 238 | 121683 | 685.81 | 761 | 767 | 176.3 |
| C | 7 | 247 | 35259 | 195.63 | 761 | 767 | 176.3 |
| D | 1 | 52 | 605532 | 3330.53 | 748 | 725 | 181.6 |
| D | 12 | 218 | 370103 | 2034.08 | 748 | 725 | 181.6 |
| D | 10 | 199 | 183426 | 1006.09 | 748 | 725 | 181.6 |
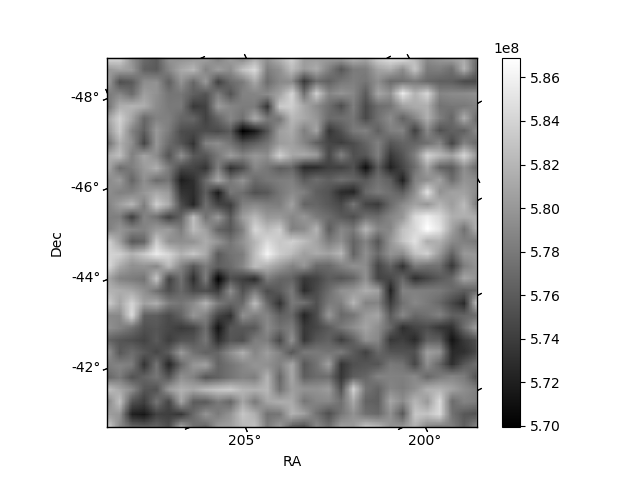
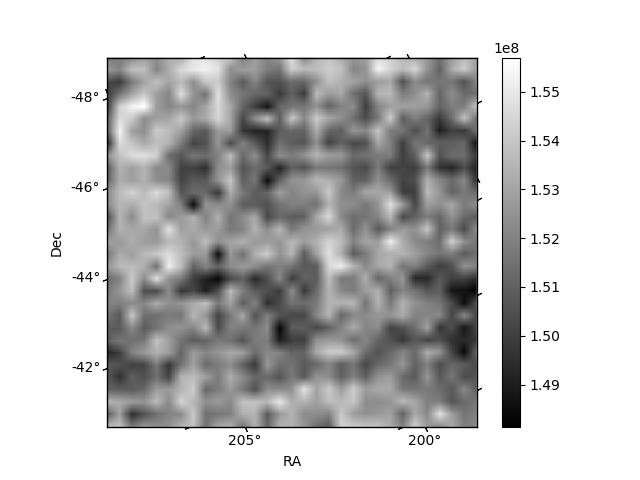
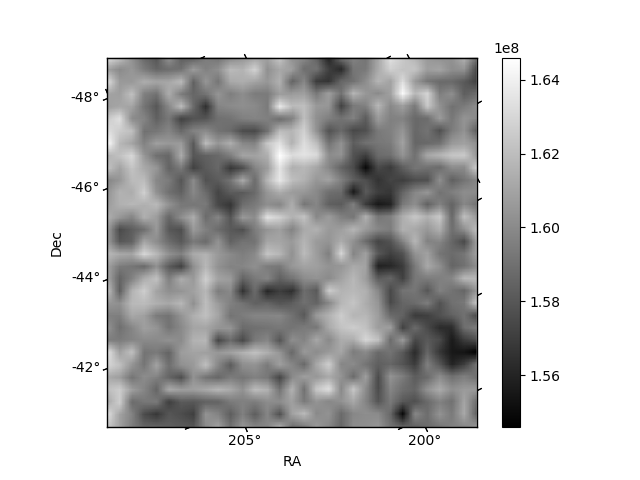
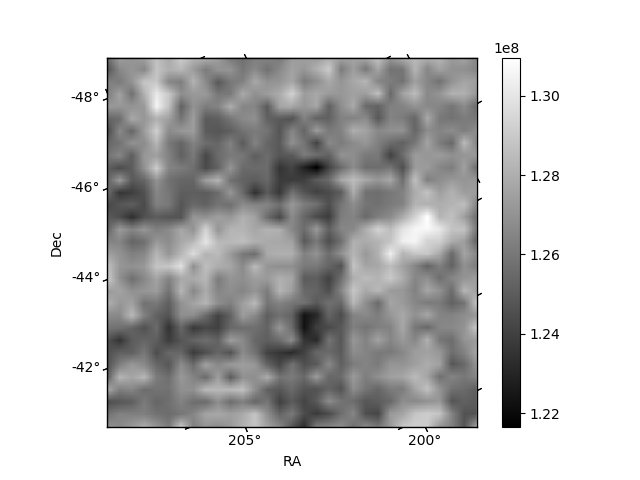
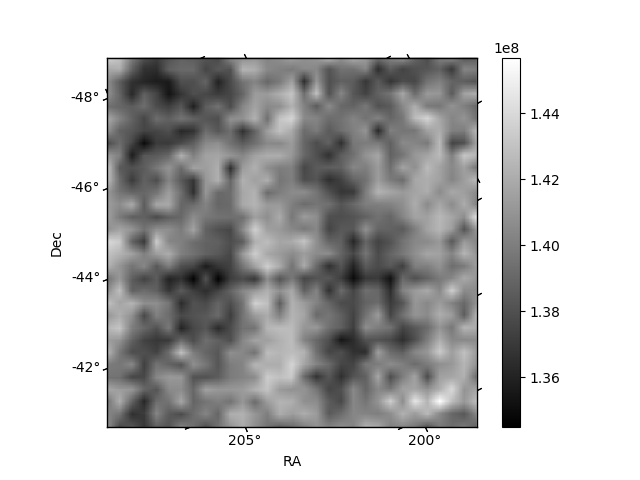
Histogram calculated using DETX and DETY for each event in the final _common_clean file
| Quadrant A | 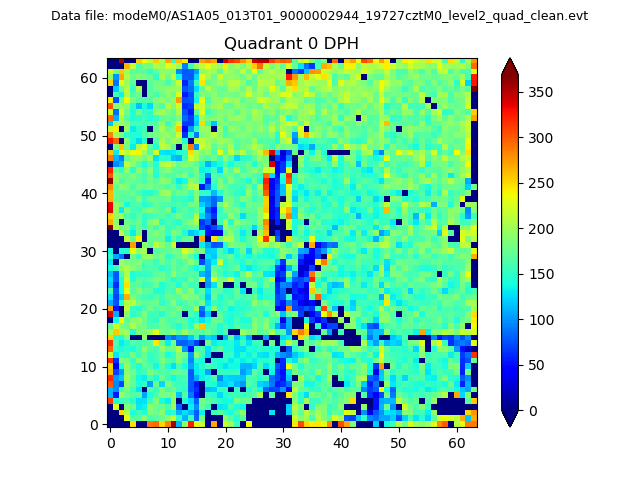 |
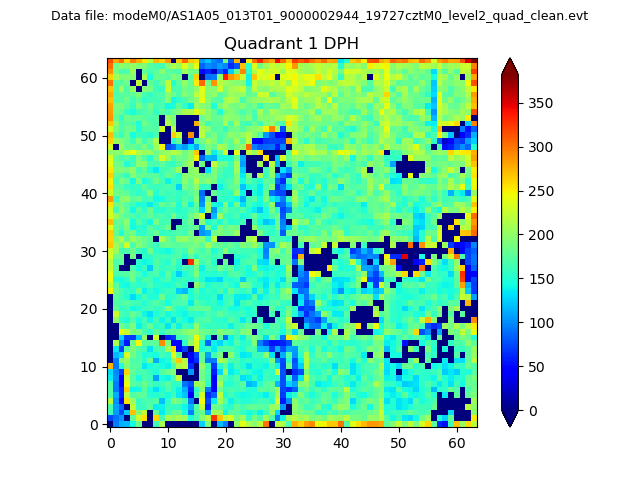 |
Quadrant B |
|---|---|---|---|
| Quadrant D |  |
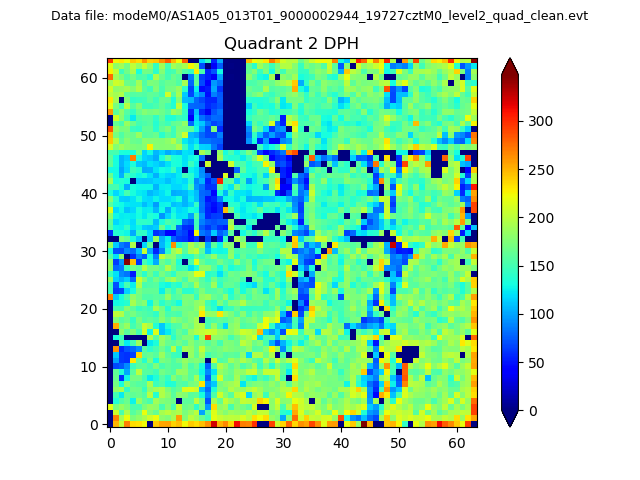 |
Quadrant C |
| Plot type | Count rate plots | Images |
|---|---|---|
| Comparison with Poisson distribution Blue bars denote a histogram of data divided into 1 sec bins. Red curve is a Poisson curve with rate = median count rate of data. |
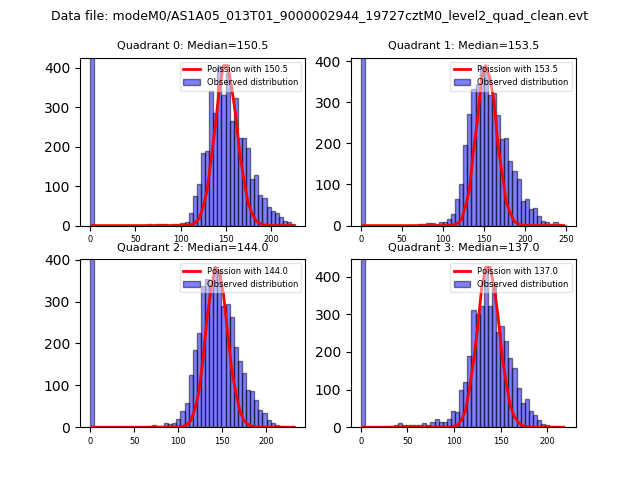 |
 |
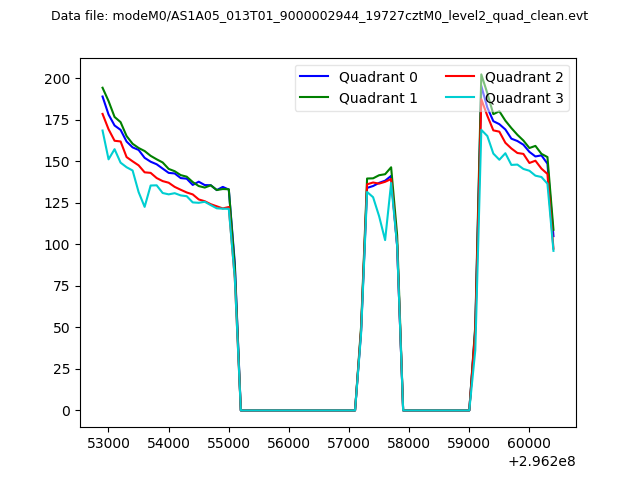
| Quadrant-wise count rates Data is divided into 100 sec bins |
 |
|
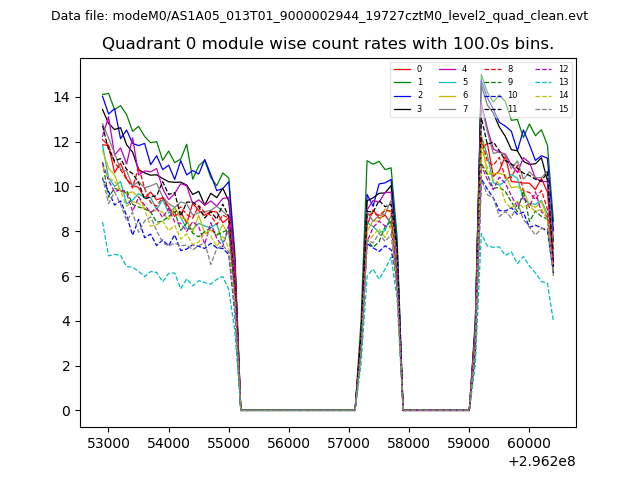
| Module-wise count rates for Quadrant A Data is divided into 100 sec bins |
 |
 |
| Module-wise count rates for Quadrant B Data is divided into 100 sec bins |
 |
 |
| Module-wise count rates for Quadrant C Data is divided into 100 sec bins |
 |
 |
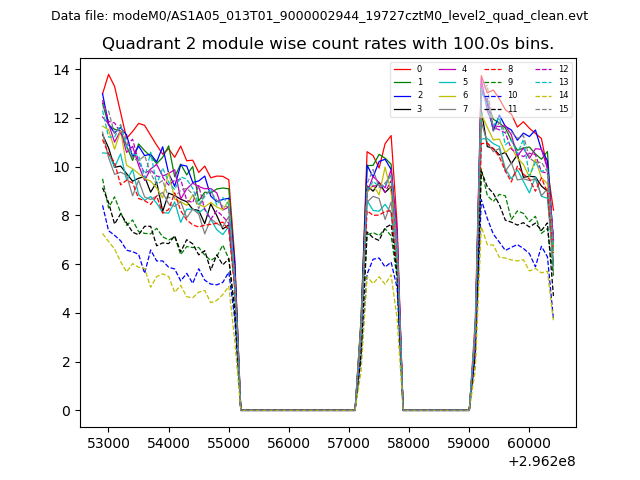
| Module-wise count rates for Quadrant D Data is divided into 100 sec bins |
 |
 |
| Parameter | Plot |
|---|---|
| CZT HV Monitor | 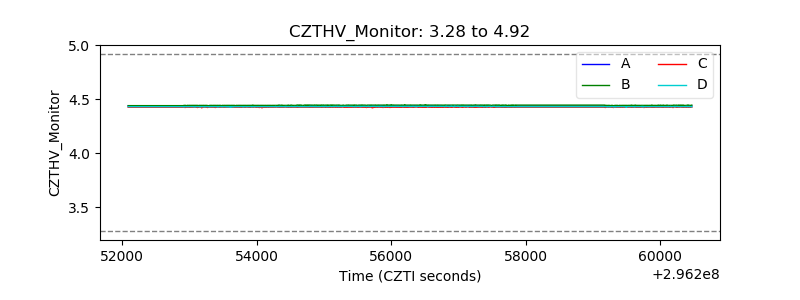 |
| D_VDD | 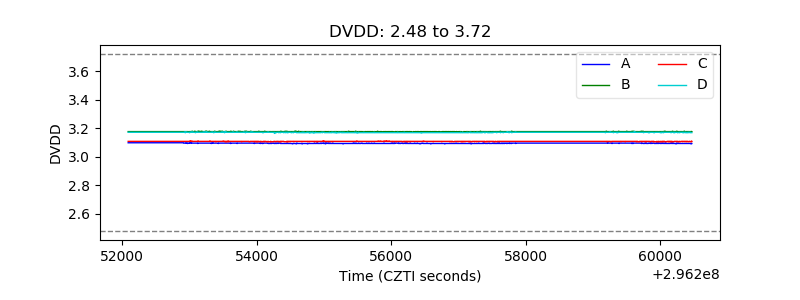 |
| Temperature 1 | 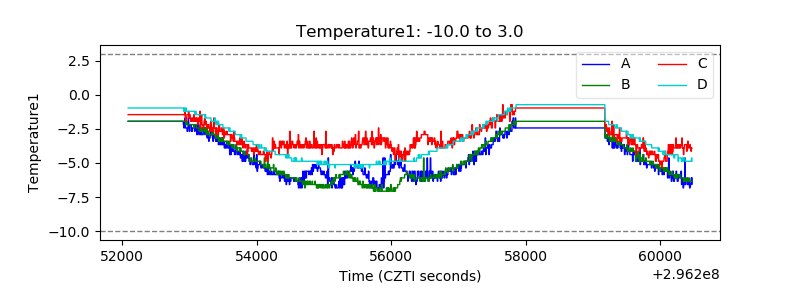 |
| Veto HV Monitor | 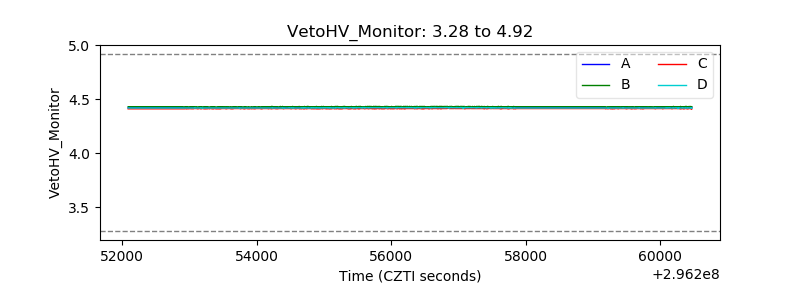 |
| Veto LLD | 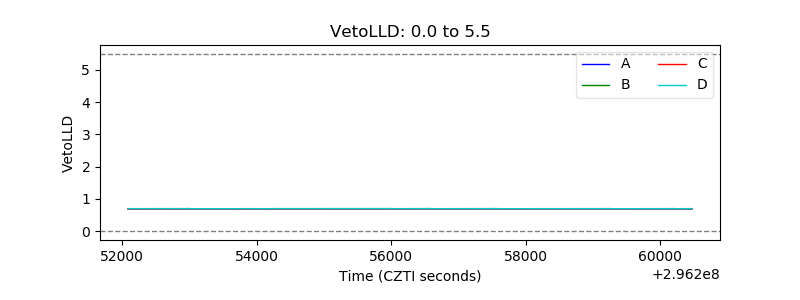 |
| Alpha Counter | 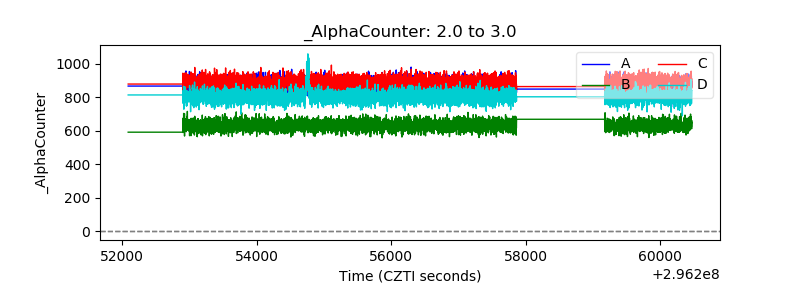 |
| _CPM_Rate | 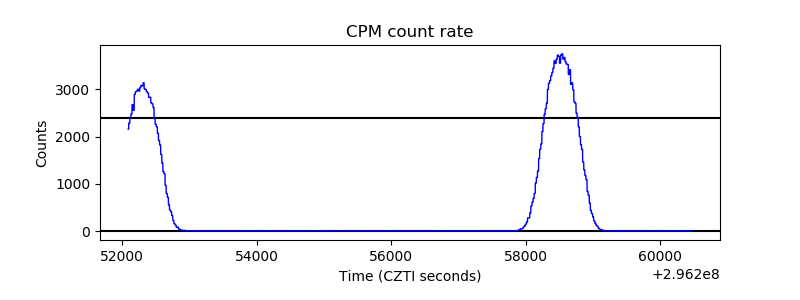 |
| CZT Counter | 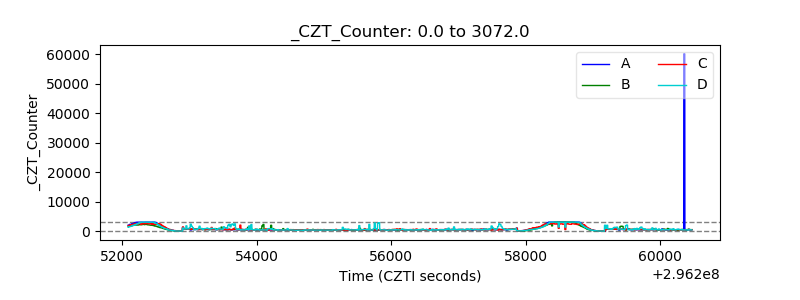 |
| +2.5 Volts monitor |  |
| +5 Volts monitor |  |
| _ROLL_ROT | 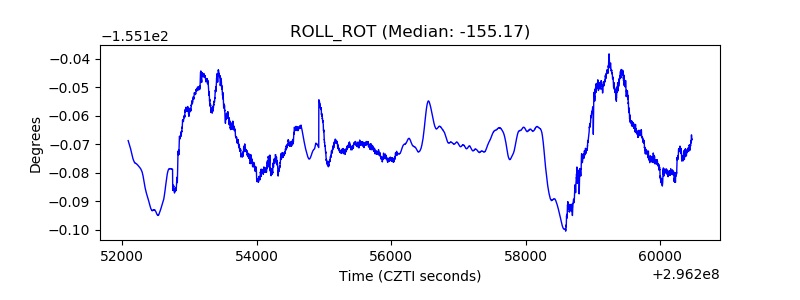 |
| _Roll_DEC | 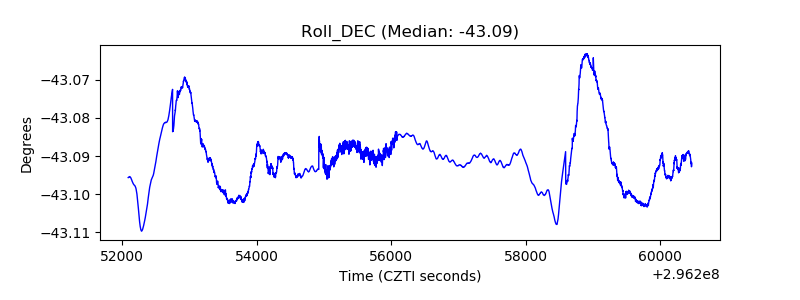 |
| _Roll_RA | 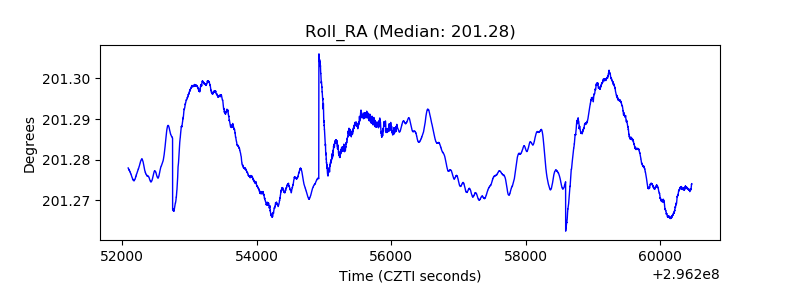 |
| Veto Counter |  |